 MetaTrader 5
 Uzmanlar
 Göstergeler
 Komut dosyaları
 Kütüphaneler
 Depo
Depo
Fan sayfamıza katılın

Value Area Levels / BhanuCodeLab - MetaTrader 5 için gösterge

- Görüntülemeler:
- 57
- Derecelendirme:
- Yayınlandı:
- Güncellendi:
-
 Alım-satım fırsatlarını kaçırıyorsunuz:
- Ücretsiz alım-satım uygulamaları
- İşlem kopyalama için 8.000'den fazla sinyal
- Finansal piyasaları keşfetmek için ekonomik haberler
Kayıt Giriş yapWeb sitesi politikasını ve kullanım şartlarını kabul edersiniz
Hesabınız yoksa, lütfen kaydolun -
 Bu koda dayalı bir robota veya göstergeye mi ihtiyacınız var? Freelance üzerinden sipariş edin
Freelance'e git
Bu koda dayalı bir robota veya göstergeye mi ihtiyacınız var? Freelance üzerinden sipariş edin
Freelance'e git
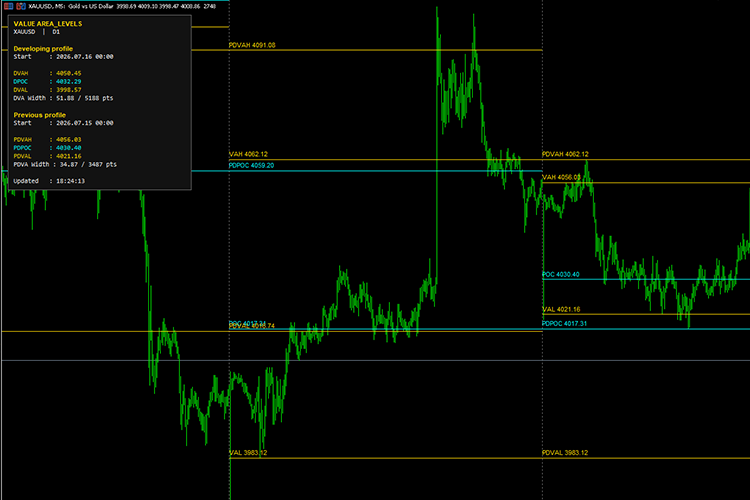
Value Area Levels, daha kısa zaman dilimlerine ait mum verilerinden bir fiyat-hacim dağılımı hesaplar ve aşağıdaki önemli piyasa profili seviyelerini gösterir:
- VAH — Değer Alanı Yüksek Seviyesi
- POC — Kontrol Noktası
- VAL — Değer Alanı Düşük Seviyesi
- DVAH, DPOC ve DVAL — Gelişmekte Olan Profil Seviyeleri
- PDVAH, PDPOC ve PDVAL — Önceki tamamlanmış profil seviyeleri
Gösterge, profil oluşturma için ayrı bir kaynak zaman dilimi kullanarak günlük, haftalık, aylık veya diğer zaman dilimlerine dayalı profilleri hesaplayabilir.
Örneğin, gösterge M15 mum verilerini kullanarak günlük Değer Alanı seviyelerini hesaplayabilir.
Mevcut profil periyodik olarak güncellenirken, tamamlanmış geçmiş profiller, grafiğin tamamen yenilenmesine veya yeni bir profil döneminin başlamasına kadar sabit kalır.
Ana Özellikler
Değer Alanının Oluşturulması
Şu anda aktif olan profilin Değer Alanı Yüksek Seviyesi, Kontrol Noktası ve Değer Alanı Düşük Seviyesini gösterir.
Gelişmekte olan seviyeler şu şekilde tanımlanır:
- DVAH
- DPOC
- DVAL
Bu seviyeler, yeni piyasa verileri elde edildikçe güncellenir.
Önceki Profil Seviyeleri
Mevcut seans boyunca önceki seansın tamamlanmış Değer Alanı seviyelerini gösterir.
Önceki profil seviyeleri şu şekilde tanımlanır:
- PDVAH
- PDPOC
- PDVAL
Bu seviyeler, potansiyel destek, direnç, kabul, reddetme veya kırılma referans alanları olarak faydalı olabilir.
Geçmiş Değer Alanları
Gösterge, birden fazla geçmiş seans için tamamlanmış VAH, POC ve VAL seviyelerini görüntüleyebilir.
Ayrıca, önceki her seansın Değer Alanı seviyelerini bir sonraki tarihsel seansa yansıtabilir.
Örneğin, Pazartesi gününün tamamlanmış Değer Alanı seviyeleri, Salı gününün grafik alanında önceki günün seviyeleri olarak görüntülenebilir.
Yapılandırılabilir Profil Zaman Aralığı
Profil hesaplama dönemi, grafik zaman diliminden bağımsız olarak seçilebilir.
Desteklenen örnekler şunlardır:
- Günlük profiller
- Haftalık profiller
- Aylık profiller
- H4 profilleri
- H1 profilleri
Yapılandırılabilir Kaynak Zaman Aralığı
Profil oluşturma için veri kaynağı olarak ayrı bir alt zaman aralığı seçilebilir.
Örneğin:
- Profil zaman aralığı: D1
- Kaynak zaman aralığı: M15
Daha düşük bir kaynak zaman aralığı kullanmak genellikle daha ayrıntılı bir profil oluşturur, ancak daha fazla işlem gerektirir.
Tick veya Gerçek Hacim
Gösterge şunları destekler:
- Tik hacmi
- Gerçek hacim
Gerçek hacim seçildiğinde ancak mevcut değilse veya sıfıra eşitse, gösterge otomatik olarak tick hacmine geçer.
Özel Değer Alanı Yüzdesi
Değer Alanı yüzdesi yapılandırılabilir.
Varsayılan değer %70'tir ve bu değer genellikle piyasa profili ve hacim profili analizlerinde kullanılır.
Seans Ayırma
Seansları görsel olarak ayırmak için her profil döneminin başında isteğe bağlı dikey çizgiler görüntülenebilir.
Dikey çizginin rengi, genişliği ve stili özelleştirilebilir.
MetaQuotes Ltd tarafından İngilizceden çevrilmiştir.
Orijinal kod: https://www.mql5.com/en/code/75056
Footprint XRay (Order Flow Volume Delta)
Pine Script'ten MQL5'e aktarılan, kurumsal düzeyde bir emir akışı ve piyasa izi grafiği göstergesi. Bu gösterge, her bir fiyat seviyesindeki alım/satım hacmi farkını hesaplamak için daha düşük zaman dilimlerine (LTF) ait geçmiş tick/gerçek hacim verilerini kullanarak ana zaman dilimindeki çubukları dinamik olarak ayrıştırır. Gösterge, otomatik zaman dilimi seçimi, Kontrol Noktası (POC) vurgulama, Yığılmış Dengesizlikler, aşırı Emilim algılama, canlı risk azaltma özelliğine sahip Tamamlanmamış İşlem (UB) izleme ve gerçek zamanlı uyarı tetikleyicileri gibi özelliklere sahiptir.
Portfolio Correlation and Margin Risk Calculator
Herhangi bir enstrüman grubu ile hesabınızın bu enstrümanların tümünü aynı anda tutabilmesi için ihtiyaç duyacağı toplam teminat arasındaki tarihsel Pearson korelasyonunu, öz sermayenizin yüzdesi olarak hesaplar. MetaTrader 5'te harici kütüphaneler, Python veya yapay zeka (AI) kullanmadan yerel olarak çalışır — sembol listenizi ve lot büyüklüklerinizi girdi olarak belirleyin; uzmanlar sekmesinde ve grafikte tam matrisi gösterir ve zamanlayıcıya göre yenilenir.
PRO SCREENER
Pro Dashboard Screener ile işlem performansınızı kontrol altına alın. Ciddi yatırımcılar için tasarlanan bu araç, hesabınızın durumuna ilişkin net, profesyonel ve gerçek zamanlı bir genel bakışı doğrudan grafiğiniz üzerinde sunar.
Breakout Distance - Donchian channel with distance-to-trigger panel in ATR units
Çoğu kanal göstergesi, kırılma seviyesinin nerede olduğunu gösterir. Bu gösterge ise, şu anda o seviyeden ne kadar uzakta olduğunuzu, harekete geçebileceğiniz bir biçimde size bildirir. Panel, hem kanalın üst hem de alt kenarı için şunları gösterir: seviyenin kendisi; mevcut fiyattan uzaklığı, sembolün kendi fiyat birimlerinde; aynı uzaklığın ATR birimlerinde ifade edilmesi; fiyat tetik noktasına yaklaştıkça dolan bir yakınlık çubuğu; ATR sütunu neden önemlidir? Bir kırılma seviyesinden 8 dolarlık bir uzaklık, bir haber açıklanması sırasında ifade ettiğinden tamamen farklı bir anlam ifade eder. Mesafeyi mevcut ATR’ye bölmek, bu sayının farklı seanslar, farklı volatilite rejimleri ve farklı semboller arasında karşılaştırılabilir olmasını sağlar. 0,30 ATR değeri, altın için de EURUSD için de aynı anlama gelir. Renk kodlaması: normal metin : InpNearATR'den daha uzakta (varsayılan 1,0 ATR) altın : InpNearATR dahilinde turuncu-kırmızı : InpVeryNearATR dahilinde (varsayılan 0,5 ATR)