 MetaTrader 5
 Sistemi Esperti
 Indicatori
 Script
 Librerie
 Archiviazione
Unisciti alla nostra fan page

Value Area Levels / BhanuCodeLab - indicatore per MetaTrader 5

- Visualizzazioni:
- 48
- Valutazioni:
- Pubblicato:
- Aggiornato:
-
 Ti stai perdendo delle opportunità di trading:
- App di trading gratuite
- Oltre 8.000 segnali per il copy trading
- Notizie economiche per esplorare i mercati finanziari
Registrazione AccediAccetti la politica del sito e le condizioni d’uso
Se non hai un account, registrati -
 Hai bisogno di un robot o indicatore basato su questo codice? Ordinalo su Freelance
Vai a Freelance
Hai bisogno di un robot o indicatore basato su questo codice? Ordinalo su Freelance
Vai a Freelance
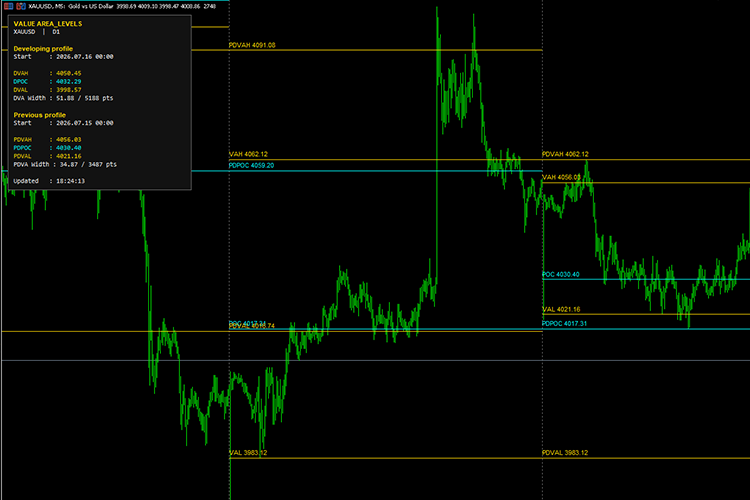
Value Area Levels calcola una distribuzione prezzo-volume a partire dai dati delle candele su timeframe inferiori e visualizza i seguenti importanti livelli del profilo di mercato:
- VAH — Massimo dell’area di valore
- POC — Punto di controllo
- VAL — Minimo dell’area di valore
- DVAH, DPOC e DVAL — Livelli di profilo in via di sviluppo
- PDVAH, PDPOC e PDVAL — Livelli di profilo precedentemente completati
L'indicatore è in grado di calcolare profili su base giornaliera, settimanale, mensile o su altri intervalli di tempo, utilizzando un intervallo di tempo separato come base per la costruzione del profilo.
Ad esempio, l’indicatore può calcolare i livelli dell’Area di Valore giornalieri utilizzando i dati delle candele M15.
Il profilo corrente viene aggiornato periodicamente, mentre i profili storici completati rimangono fissi fino all’aggiornamento completo del grafico o all’inizio di un nuovo periodo di profilo.
Caratteristiche principali
Sviluppo dell’Area di Valore
Visualizza il massimo dell’Area di Valore, il Punto di Controllo e il minimo dell’Area di Valore del profilo attualmente attivo.
I livelli in via di sviluppo sono identificati come:
- DVAH
- DPOC
- DVAL
Questi livelli si aggiornano man mano che diventano disponibili nuovi dati di mercato.
Livelli del profilo precedente
Visualizza i livelli dell'Area di Valore completati nella sessione precedente durante la sessione corrente.
I livelli di profilo precedenti sono identificati come:
- PDVAH
- PDPOC
- PDVAL
Questi livelli possono essere utili come potenziali aree di riferimento per supporto, resistenza, accettazione, rifiuto o breakout.
Aree di valore storiche
L'indicatore può visualizzare i livelli VAH, POC e VAL completati per più sessioni storiche.
Può inoltre proiettare i livelli dell’Area di Valore di ciascuna sessione precedente nella sessione storica successiva.
Ad esempio, i livelli dell’area di valore (Value Area) completati lunedì possono essere visualizzati come livelli del giorno precedente nell’area del grafico di martedì.
Intervallo di tempo del profilo configurabile
Il periodo di calcolo del profilo può essere selezionato indipendentemente dall’intervallo di tempo del grafico.
Tra gli esempi supportati figurano:
- Profili giornalieri
- Profili settimanali
- Profili mensili
- Profili H4
- Profili H1
Intervallo di tempo della fonte configurabile
È possibile selezionare un intervallo di tempo inferiore come fonte dei dati per la creazione del profilo.
Ad esempio:
- Intervallo di tempo del profilo: D1
- Intervallo di tempo di origine: M15
L'utilizzo di un intervallo di tempo di origine inferiore crea generalmente un profilo più dettagliato, ma richiede una maggiore elaborazione.
Volume tick o volume reale
L'indicatore supporta:
- Volume per tick
- Volume reale
Quando si seleziona il volume reale ma questo non è disponibile o è pari a zero, l'indicatore ricorre automaticamente al volume dei tick.
Percentuale dell’area valore personalizzata
La percentuale dell'area di valore è configurabile.
Il valore predefinito è 70%, comunemente utilizzato nell'analisi del profilo di mercato e del profilo di volume.
Separazione delle sessioni
È possibile visualizzare linee verticali opzionali all'inizio di ciascun periodo del profilo per separare visivamente le sessioni.
È possibile personalizzare il colore, la larghezza e lo stile della linea verticale.
Tradotto dall’inglese da MetaQuotes Ltd.
Codice originale https://www.mql5.com/en/code/75056
Footprint XRay (Order Flow Volume Delta)
Un indicatore grafico di flusso degli ordini e impronta di livello istituzionale, convertito da Pine Script a MQL5. Esso scompone dinamicamente le barre dei timeframe principali utilizzando i dati storici di tick e volume reale dei timeframe inferiori (LTF) per calcolare il delta del volume di acquisto/vendita a ciascun livello di prezzo. L'indicatore offre la selezione automatica del timeframe, l'evidenziazione del Point of Control (POC), gli squilibri sovrapposti, il rilevamento dell'assorbimento estremo, il monitoraggio dell'Unfinished Business (UB) con mitigazione in tempo reale e l'attivazione di avvisi in tempo reale.
Portfolio Correlation and Margin Risk Calculator
Calcola la correlazione storica di Pearson tra un qualsiasi insieme di strumenti e il margine complessivo che il tuo conto dovrebbe detenere per poterli detenere tutti contemporaneamente, espresso in percentuale del tuo capitale proprio. Funziona in modo nativo su MetaTrader 5 senza librerie esterne, senza Python e senza IA: basta impostare l’elenco dei simboli e le dimensioni dei lotti come dati di input e il sistema riporta la matrice completa nella scheda «Esperti» e sul grafico, aggiornandola a intervalli regolari.
PRO SCREENER
Prendi il controllo delle tue prestazioni di trading con Pro Dashboard Screener. Progettata per i trader più esigenti, questa utility offre una panoramica chiara, professionale e in tempo reale dello stato del tuo conto direttamente sul grafico.
Breakout Distance - Donchian channel with distance-to-trigger panel in ATR units
La maggior parte degli indicatori di canale indica dove si trova il livello di breakout. Questo invece ti dice quanto sei lontano da esso, in questo preciso momento, in un formato che ti permette di agire di conseguenza. Il pannello mostra, sia per il bordo superiore che per quello inferiore del canale: il livello stesso la distanza dal prezzo attuale, nelle unità di prezzo del titolo stesso la stessa distanza espressa in unità ATR una barra di prossimità che si riempie man mano che il prezzo si avvicina al trigger Perché la colonna ATR è importante. Una distanza di 8 dollari da un breakout ha un significato completamente diverso in una sessione asiatica tranquilla rispetto a quanto avviene durante la pubblicazione di notizie. Dividere la distanza per l’ATR attuale rende il numero comparabile tra le diverse sessioni, tra i diversi regimi di volatilità e tra i diversi simboli. Un valore di 0,30 ATR significa la stessa cosa sia sull’oro che sull’EURUSD. Codifica a colori: testo normale: a più di InpNearATR di distanza (impostazione predefinita 1,0 ATR) oro : entro InpNearATR arancione-rosso: entro InpVeryNearATR (impostazione predefinita 0,5 ATR)