
|
12+ лет
опыт работы
|
34
продуктов
|
588
демо-версий
|
|
0
работ
|
0
сигналов
|
0
подписчиков
|


Evgeniy Scherbina
· 2
Evgeniy Scherbina
2024.07.28
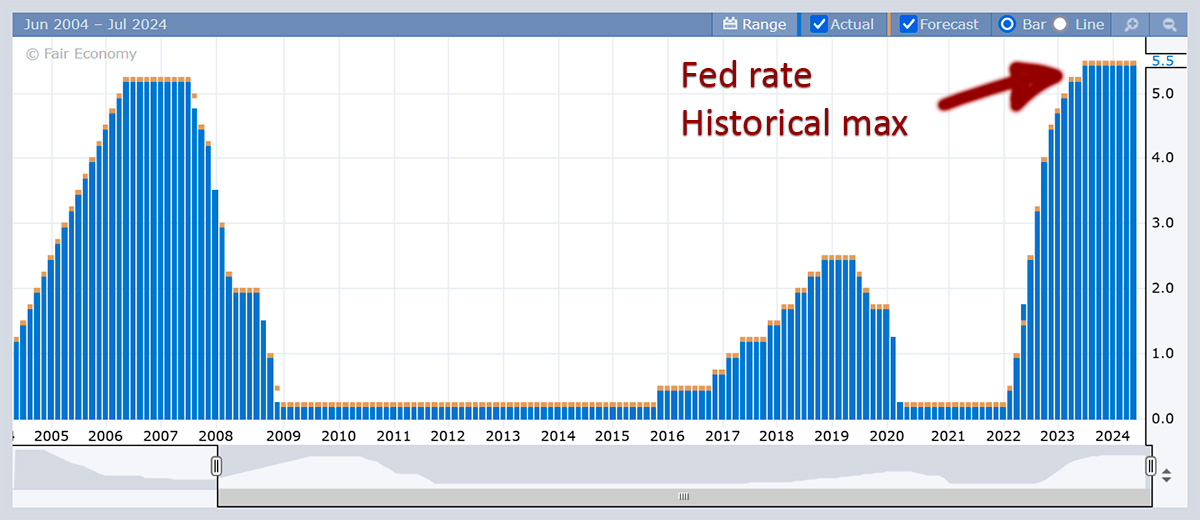
Нет, я думаю золото в канале вверх-вниз до выборов в ноябре. А осенью наконец будут большие движения.