Andrea Michelon / Профиль
- Информация
|
нет
опыт работы
|
16
продуктов
|
1
демо-версий
|
|
1
работ
|
0
сигналов
|
0
подписчиков
|
Моё правило: инструмент попадает в Маркет только после проверки его логики на реальных данных с реальным спредом брокера. Без сетки, без мартингейла, без перерисовки, без обещаний прибыли. Если статистика слабая, страница продукта так и говорит.
БЕСПЛАТНЫЕ ИНСТРУМЕНТЫ
✔️ ATS Fibonacci Golden Zones: https://www.mql5.com/en/market/product/196598
✔️ ATS Daily Volume Profile: https://www.mql5.com/en/market/product/196718
✔️ ATS Daily Performance: https://www.mql5.com/en/market/product/196881
✔️ ATS Lot Sizer: https://www.mql5.com/en/market/product/197286
✔️ ATS Gold Bias: https://www.mql5.com/en/market/product/197175
ПОЛНЫЕ ВЕРСИИ И ИНСТРУМЕНТЫ ДЛЯ ЗОЛОТА
✔️ ATS Fibonacci Zones Multi Timeframe: https://www.mql5.com/en/market/product/196649
✔️ ATS Volume Profile Statistics: https://www.mql5.com/en/market/product/196719
✔️ ATS Risk Desk: https://www.mql5.com/en/market/product/197267
✔️ ATS Performance Statistics: https://www.mql5.com/en/market/product/198305
✔️ ATS Gold Grade: https://www.mql5.com/en/market/product/197172
✔️ ATS Gold Command: https://www.mql5.com/en/market/product/186550
✔️ ATS Killzones Liquidity Statistics: https://www.mql5.com/en/market/product/196703
Бесплатный код в CodeBase: ATS Confirmed Swings, неперерисовывающиеся свинг-максимумы и минимумы.
📢 ATS channel: https://www.mql5.com/en/channels/ats-tools
РАБОТА НА ЗАКАЗ
Дашборды торговой статистики, панели, индикаторы и советники по чёткому ТЗ, через MQL5 Freelance. Напишите мне: отвечаю в течение дня.
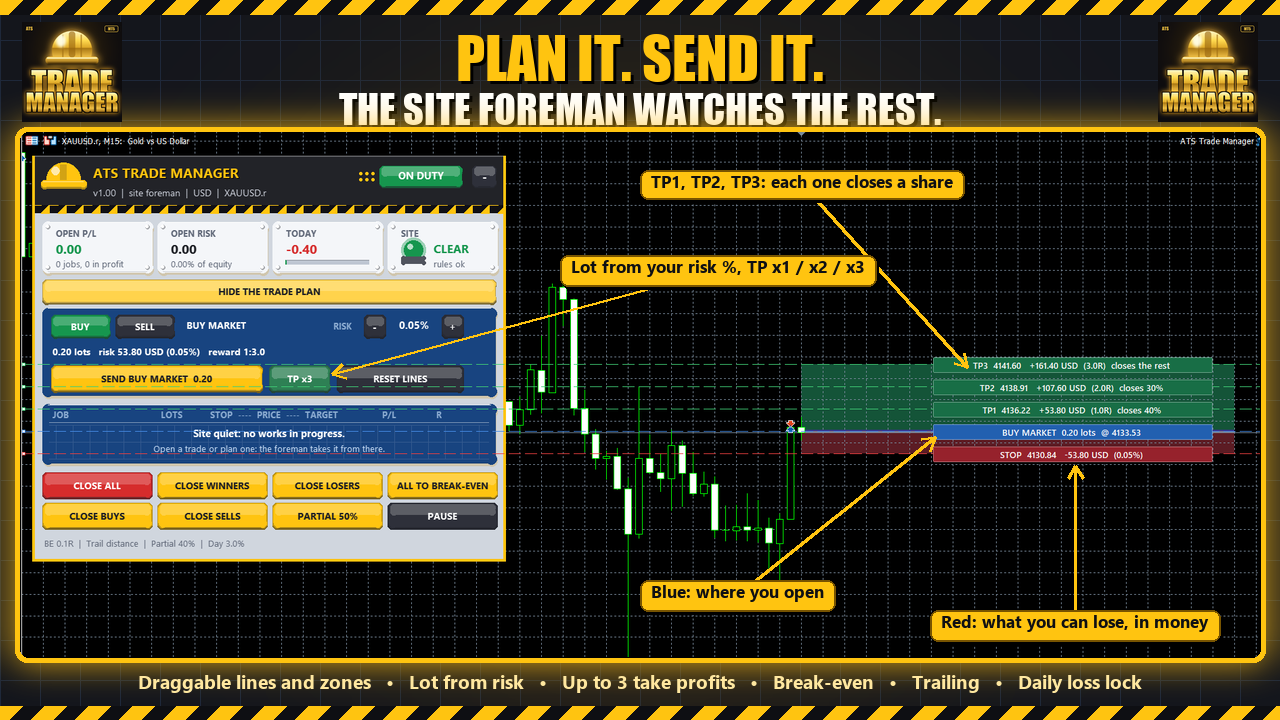
Plan a trade on the chart before you take it: a blue line where you open, a red zone down to the stop, green zones up to 1, 2 or 3 targets. Drag any line and the lot, the risk and the reward in money follow. Press SEND and the "site foreman" looks after the trade: break-even, trailing stop, a partial close at each target, a daily loss lock, and one panel to close groups of trades.
- Lot from your risk %, never rounded up. If your risk is below the broker's minimum lot, the panel tells you what the minimum lot would really risk.
- Market or pending order: drag the entry away from the price and it becomes a limit or stop order.
- It trades only when you press SEND. No signals, no promises.
Free on the Market: https://www.mql5.com/en/market/product/199601
For developers, the same management rules as an open-source include file (break-even, trailing, partial closes, automatic stop and target, with a 36-check self-test): https://www.mql5.com/en/code/78081
Andy Trading Solutions
ATS Trade Manager — это прораб ваших сделок. Спланируйте сделку на графике с помощью перетаскиваемых линий и цветных зон, отправьте её с лотом, рассчитанным от вашего риска, и доверьте остальное прорабу: безубыток, трейлинг-стоп, до трёх уровней тейк-профита с частичным закрытием на каждом, дневной лимит убытка и одна панель для закрытия групп сделок. Он торгует только тогда, когда вы нажимаете SEND. ПЛАН СДЕЛКИ НА ГРАФИКЕ Нажмите PLAN — и график покажет сделку до входа: синяя линия и зона там
Quick rule: lots = (balance x risk %) / (stop distance x value per point per lot).
Example on XAUUSD, 1,000 USD balance, 1% risk = 10 USD, stop 5 USD away: 10 / (5 x 100) = 0.02 lots. Most people would open 0.10 there, which is 5% on one trade.
Set the stop first, then the lot. Never the other way round.
Free tool that does the maths and sends the order with the stop already attached:
▶ ATS Lot Sizer: https://www.mql5.com/en/market/product/197286
✔️ Grade A / B / C from the checks, not from a hidden score
✔️ Entry, stop, target and position size for each setup
✔️ The hit rate of past graded setups, computed live on YOUR chart and broker
✔️ Closed bars only, nothing repaints
✔️ Signals only: it never trades
Honest note: the edge comes from trending gold. In a sideways market the grades still work as a filter, but results are weaker, and the panel shows it.
▶ ATS Gold Grade: https://www.mql5.com/en/market/product/197172
▶ Free H1 bias for M5/M15: https://www.mql5.com/en/market/product/197175
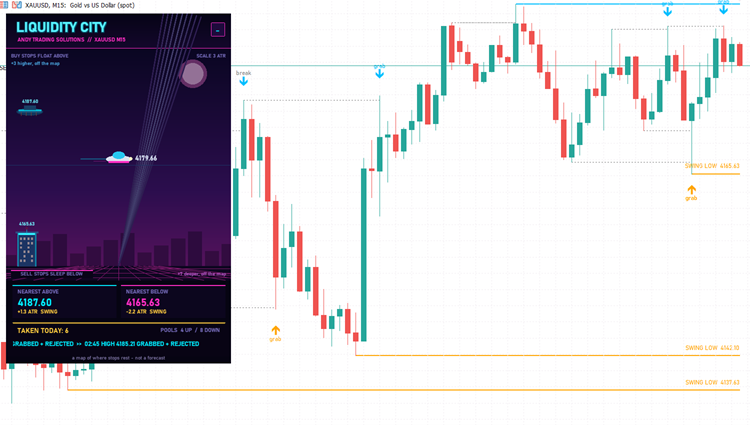
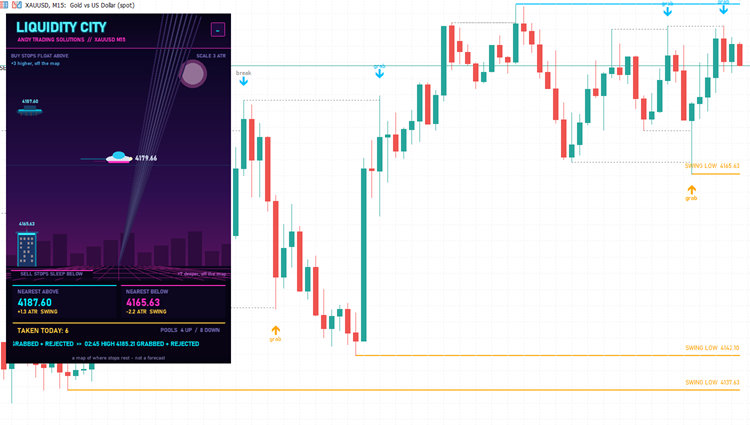
Where are the stops resting, and which ones were taken today? It marks every confirmed swing high/low that price has not traded through, equal highs/lows (bigger pools) and yesterday's high/low. When a bar trades beyond a level it says "grab" if the bar closes back inside, "break" if it closes beyond. Non-repainting, nearest pool above/below in buffers for your EA.
The panel is a neon city: the price is a flying car, sell stops are towers below it, buy stops floating platforms above it. A map of where stops rest, not a forecast.
https://www.mql5.com/en/code/77847
It reads market structure on any MT5 chart: swing highs and lows, breaks with the trend (BOS) and against it (CHoCH), and the order block each move started from, until price touches it.
✔️ Swings confirmed on closed candles only: history looks exactly like live, nothing repaints
✔️ Order blocks removed at the first touch, max 8 on the chart
✔️ Panel: trend, last break, nearest zone with the trend, reference stop and target
✔️ London / New York killzones, ATR and spread
✔️ New in 1.31: labels stay behind the panel
Honest note from my tests: I checked the first touch of these zones on 22 markets since 2017. Price does react a little more than at random levels, but not enough to pay the spread if you trade every touch. Use it to read the market and place your stop, not as an entry signal on its own.
▶ ATS Indicator (free): https://www.mql5.com/en/market/product/168569
1. Buy/sell the M1 close through a session high or low, with the H1 trend
2. Buy/sell the sweep of a session high or low (wick through, close back inside), with the H1 trend
Before any cost, both came out at a profit factor of about 1.00: a coin flip. After the real spread, both lose, because an M1 stop is only a few times the spread.
I also tested M15 breakouts in the direction of the H1 trend: they worked in 2024-2026, but on 2020-2022 data the same rules lost money. The edge came from the strong gold trend, not from the setup itself.
So before you trust any scalping rule, test it on years it has never seen. Most rules don't survive that step, including some of mine.
It shows how your MT5 account really performed, day by day, week by week and month by month, and BY EA: one row per magic number, so you see which strategy is carrying the account and which one is dragging it.
✔️ Profit, loss and win rate per day, week and month
✔️ Worst drawdown and margin of past days, rebuilt tick by tick from your own broker's history (not estimated from closed trades)
✔️ Custom date range with a calendar
✔️ Symbol filter: XAU* shows only your gold trades
✔️ View by EA / magic number
✔️ Read-only: it never opens, changes or closes a trade
Built after a request from a trader who wanted exact daily drawdown numbers for his gold EAs. He is now the first customer.
▶ ATS Performance Statistics: https://www.mql5.com/en/market/product/198305
▶ Free starter version (last 30 days): https://www.mql5.com/en/market/product/196881
📢 Updates and questions: https://www.mql5.com/en/channels/ats-tools
It shows how your MT5 account really performed, day by day, week by week and month by month, and BY EA: one row per magic number, so you see which strategy is carrying the account and which one is dragging it.
✔️ Profit, loss and win rate per day, week and month
✔️ Worst drawdown and margin of past days, rebuilt tick by tick from your own broker's history (not estimated from closed trades)
✔️ Custom date range with a calendar
✔️ Symbol filter: XAU* shows only your gold trades
✔️ View by EA / magic number
✔️ Read-only: it never opens, changes or closes a trade
Built after a request from a trader who wanted exact daily drawdown numbers for his gold EAs. He is now the first customer.
▶ ATS Performance Statistics: https://www.mql5.com/en/market/product/198305
▶ Free starter version (last 30 days): https://www.mql5.com/en/market/product/196881
📢 Updates and questions: https://www.mql5.com/en/channels/ats-tools
ATS Performance Statistics показывает, как на самом деле работал ваш счёт — по дням, неделям и месяцам: прибыль и убыток, худшая просадка и максимальная использованная маржа. Столбцы и цифры на аккуратной панели прямо на графике. То, чего не умеет большинство инструментов статистики: просадка и маржа тех дней, за которыми вы не следили. Индикатор восстанавливает путь эквити каждого прошедшего дня по истории сделок и тиковой истории самого брокера, прослеживая каждую позицию тик за тиком —
ЛОТ ОТ ВАШЕГО СТОПА. БЕСПЛАТНО. Выбор лота «на глаз» — это то, как обычный убыток превращается в плохой день. ATS Lot Sizer ставит на график две линии: стоп и цель. Перетащите их, и панель покажет размер лота под ваш риск и сумму, которую этот лот реально ставит на кон. Один клик отправляет сделку с уже привязанными стопом и целью. КАК ЭТО РАБОТАЕТ Выберите LONG или SHORT. На графике появятся линия стопа и линия цели. Перетаскивайте их. Лоты = ваш риск (процент от баланса, процент от эквити или
ЛОТ ОТ СТОПА. ЗАМОК НА ДЕНЬ. Большинство убыточных дней начинаются не с плохого сетапа. Они начинаются с лота, выбранного на глаз, а затем второй сделки, чтобы отыграть первую. ATS Risk Desk считает лот каждой сделки от вашего стопа, отправляет её в один клик, сопровождает её и закрывает вам вход, когда дневной лимит исчерпан. КАК ЭТО РАБОТАЕТ Выберите LONG или SHORT. На графике появятся линии стопа и цели. Перетащите их. Лоты = ваш риск (процент от баланса, процент от средств или фиксированная