 MetaTrader 5
 Experts
 Indicators
 Scripts
 Libraries
 Storage
Join our fan page

ATS Liquidity City - liquidity pools and sweeps, drawn as a neon city - indicator for MetaTrader 5

- Views:
- 103
- Rating:
- Published:
-
 You are missing trading opportunities:
- Free trading apps
- Over 8,000 signals for copying
- Economic news for exploring financial markets
Registration Log inYou agree to website policy and terms of use
If you do not have an account, please register -
 Need a robot or indicator based on this code? Order it on Freelance
Go to Freelance
Need a robot or indicator based on this code? Order it on Freelance
Go to Freelance

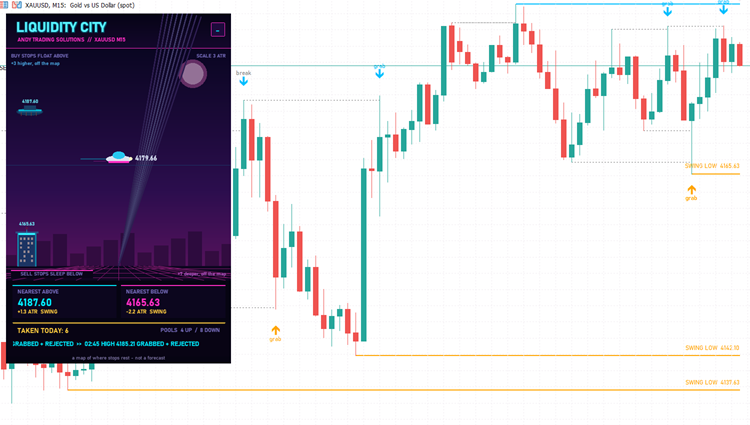
ATS Liquidity City answers two questions on any chart: where are the stops resting, and which ones got taken today?
 Repaint Inspector
Measures whether an indicator repaints instead of trusting the claim. It re-reads the buffers of any custom indicator on bars that have already closed and counts every value that changes, appears or disappears, with the furthest shift back at which that still happens. Verdict per buffer on a chart panel, every event written to CSV.
 Edge Drift Detector
Tests whether live closing deals still match the backtest of an Expert Advisor. A bootstrap-calibrated CUSUM detector raises an alarm and estimates when the drift began, a two-window check separates a short dip from a lasting decline, and an expectancy decomposition shows whether the win rate or the trade sizes changed. The script generates demonstration data on the first run and is written in pure MQL5.
Arixis Backtest Robustness Analyzer
A free open-source MT5 utility for analyzing historical trading performance beyond Profit Factor.
Mirror Hedge EA (Same terminal and account only)
Mirrors trades opened, modified, and closed by another EA on the same hedging account, selected by magic number. By default it inverts direction (Buy↔Sell, SL↔TP), so you can forward-test the reverse of a strategy with real spreads, slippage, and execution.