Andrea Michelon / 个人资料
- 信息
|
不
经验
|
16
产品
|
1
演示版
|
|
1
工作
|
0
信号
|
0
订阅者
|
我的原则:工具只有在其逻辑经过真实数据和经纪商真实点差测试后才会上架。不用网格,不用马丁格尔,不重绘,不承诺盈利。如果某项统计较弱,产品页面会如实说明。
免费工具
✔️ ATS Fibonacci Golden Zones: https://www.mql5.com/en/market/product/196598
✔️ ATS Daily Volume Profile: https://www.mql5.com/en/market/product/196718
✔️ ATS Daily Performance: https://www.mql5.com/en/market/product/196881
✔️ ATS Lot Sizer: https://www.mql5.com/en/market/product/197286
✔️ ATS Gold Bias: https://www.mql5.com/en/market/product/197175
完整版与黄金工具
✔️ ATS Fibonacci Zones Multi Timeframe: https://www.mql5.com/en/market/product/196649
✔️ ATS Volume Profile Statistics: https://www.mql5.com/en/market/product/196719
✔️ ATS Risk Desk: https://www.mql5.com/en/market/product/197267
✔️ ATS Performance Statistics: https://www.mql5.com/en/market/product/198305
✔️ ATS Gold Grade: https://www.mql5.com/en/market/product/197172
✔️ ATS Gold Command: https://www.mql5.com/en/market/product/186550
✔️ ATS Killzones Liquidity Statistics: https://www.mql5.com/en/market/product/196703
CodeBase 免费代码:ATS Confirmed Swings,不重绘的波段高低点。
📢 ATS channel: https://www.mql5.com/en/channels/ats-tools
定制开发
交易统计仪表板、图表面板、指标和EA,按清晰的需求说明开发,通过 MQL5 Freelance 交付。给我发消息:一天内回复。
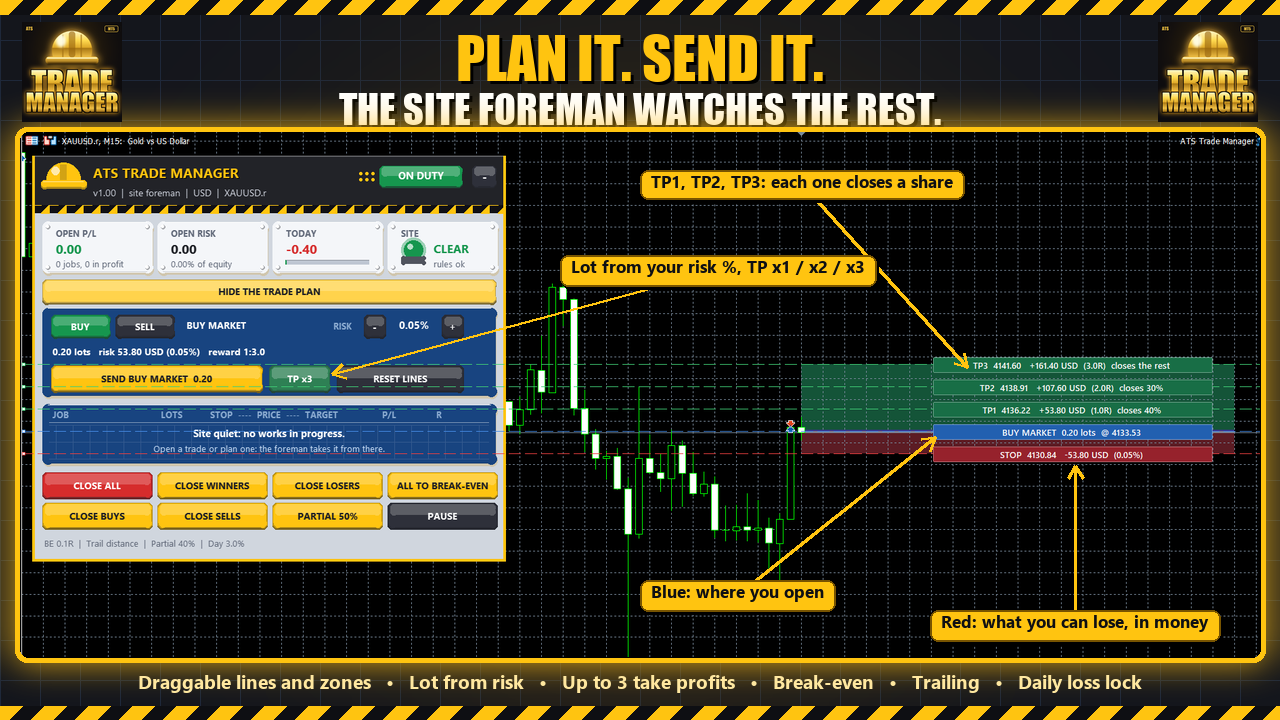
Plan a trade on the chart before you take it: a blue line where you open, a red zone down to the stop, green zones up to 1, 2 or 3 targets. Drag any line and the lot, the risk and the reward in money follow. Press SEND and the "site foreman" looks after the trade: break-even, trailing stop, a partial close at each target, a daily loss lock, and one panel to close groups of trades.
- Lot from your risk %, never rounded up. If your risk is below the broker's minimum lot, the panel tells you what the minimum lot would really risk.
- Market or pending order: drag the entry away from the price and it becomes a limit or stop order.
- It trades only when you press SEND. No signals, no promises.
Free on the Market: https://www.mql5.com/en/market/product/199601
For developers, the same management rules as an open-source include file (break-even, trailing, partial closes, automatic stop and target, with a 36-check self-test): https://www.mql5.com/en/code/78081
Andy Trading Solutions
ATS Trade Manager 是您交易的“工地主管”。在图表上用可拖动的线条和彩色区域规划交易,按您的风险计算手数后发送,其余交给主管:保本、移动止损、最多三个止盈位且每个位置可部分平仓、每日亏损锁定,以及一个用于成组平仓的面板。只有在您按下 SEND 时才会交易。 在图表上规划交易 按下 PLAN,图表会在您入场前显示这笔交易:蓝线和蓝色区域表示开仓位置,红色区域延伸到止损,绿色区域延伸到目标。拖动任何一条线,数字随之变化。每条线都有标签,以金额说明含义:止损处的亏损、各目标处的盈利、以 R 表示的结果。 按风险计算手数:您选择占余额的百分比,面板根据止损距离算出手数。手数绝不向上取整:如果经纪商的最小手数风险超过您的设定,面板会显示它的实际风险,并允许您一键使用(绝不超过余额的 10%)。 一个、两个或三个止盈位,用面板上的 TP 按钮选择。在前两个位置,管理器按您设定的比例平仓(例如 40% 和 30%),其余由经纪商的止盈平掉。第一个止盈位之后,止损可以移到保本。
Quick rule: lots = (balance x risk %) / (stop distance x value per point per lot).
Example on XAUUSD, 1,000 USD balance, 1% risk = 10 USD, stop 5 USD away: 10 / (5 x 100) = 0.02 lots. Most people would open 0.10 there, which is 5% on one trade.
Set the stop first, then the lot. Never the other way round.
Free tool that does the maths and sends the order with the stop already attached:
▶ ATS Lot Sizer: https://www.mql5.com/en/market/product/197286
✔️ Grade A / B / C from the checks, not from a hidden score
✔️ Entry, stop, target and position size for each setup
✔️ The hit rate of past graded setups, computed live on YOUR chart and broker
✔️ Closed bars only, nothing repaints
✔️ Signals only: it never trades
Honest note: the edge comes from trending gold. In a sideways market the grades still work as a filter, but results are weaker, and the panel shows it.
▶ ATS Gold Grade: https://www.mql5.com/en/market/product/197172
▶ Free H1 bias for M5/M15: https://www.mql5.com/en/market/product/197175
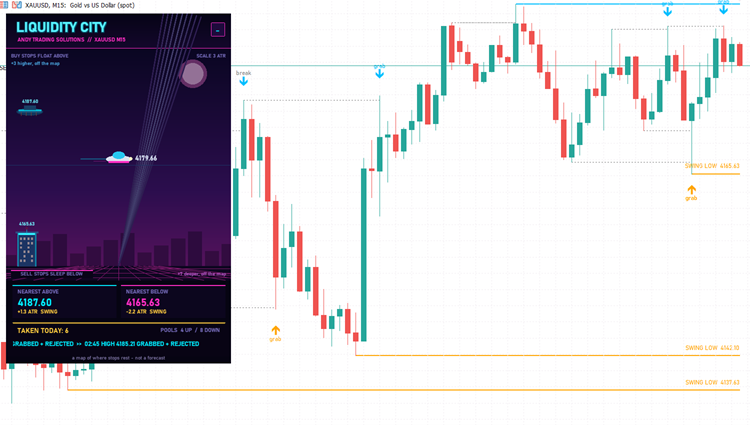
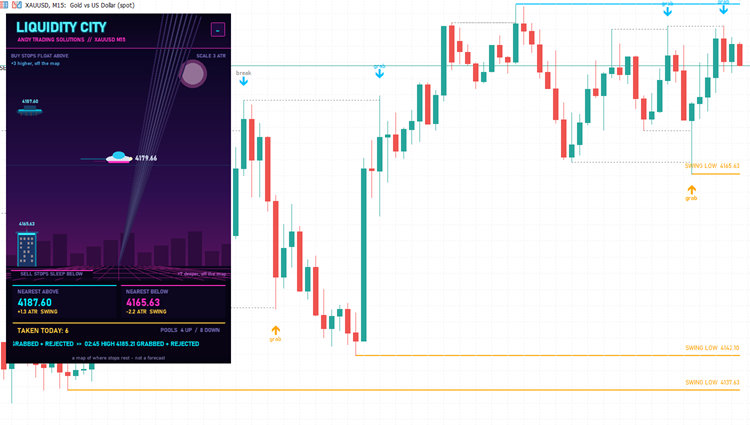
Where are the stops resting, and which ones were taken today? It marks every confirmed swing high/low that price has not traded through, equal highs/lows (bigger pools) and yesterday's high/low. When a bar trades beyond a level it says "grab" if the bar closes back inside, "break" if it closes beyond. Non-repainting, nearest pool above/below in buffers for your EA.
The panel is a neon city: the price is a flying car, sell stops are towers below it, buy stops floating platforms above it. A map of where stops rest, not a forecast.
https://www.mql5.com/en/code/77847
It reads market structure on any MT5 chart: swing highs and lows, breaks with the trend (BOS) and against it (CHoCH), and the order block each move started from, until price touches it.
✔️ Swings confirmed on closed candles only: history looks exactly like live, nothing repaints
✔️ Order blocks removed at the first touch, max 8 on the chart
✔️ Panel: trend, last break, nearest zone with the trend, reference stop and target
✔️ London / New York killzones, ATR and spread
✔️ New in 1.31: labels stay behind the panel
Honest note from my tests: I checked the first touch of these zones on 22 markets since 2017. Price does react a little more than at random levels, but not enough to pay the spread if you trade every touch. Use it to read the market and place your stop, not as an entry signal on its own.
▶ ATS Indicator (free): https://www.mql5.com/en/market/product/168569
1. Buy/sell the M1 close through a session high or low, with the H1 trend
2. Buy/sell the sweep of a session high or low (wick through, close back inside), with the H1 trend
Before any cost, both came out at a profit factor of about 1.00: a coin flip. After the real spread, both lose, because an M1 stop is only a few times the spread.
I also tested M15 breakouts in the direction of the H1 trend: they worked in 2024-2026, but on 2020-2022 data the same rules lost money. The edge came from the strong gold trend, not from the setup itself.
So before you trust any scalping rule, test it on years it has never seen. Most rules don't survive that step, including some of mine.
It shows how your MT5 account really performed, day by day, week by week and month by month, and BY EA: one row per magic number, so you see which strategy is carrying the account and which one is dragging it.
✔️ Profit, loss and win rate per day, week and month
✔️ Worst drawdown and margin of past days, rebuilt tick by tick from your own broker's history (not estimated from closed trades)
✔️ Custom date range with a calendar
✔️ Symbol filter: XAU* shows only your gold trades
✔️ View by EA / magic number
✔️ Read-only: it never opens, changes or closes a trade
Built after a request from a trader who wanted exact daily drawdown numbers for his gold EAs. He is now the first customer.
▶ ATS Performance Statistics: https://www.mql5.com/en/market/product/198305
▶ Free starter version (last 30 days): https://www.mql5.com/en/market/product/196881
📢 Updates and questions: https://www.mql5.com/en/channels/ats-tools
It shows how your MT5 account really performed, day by day, week by week and month by month, and BY EA: one row per magic number, so you see which strategy is carrying the account and which one is dragging it.
✔️ Profit, loss and win rate per day, week and month
✔️ Worst drawdown and margin of past days, rebuilt tick by tick from your own broker's history (not estimated from closed trades)
✔️ Custom date range with a calendar
✔️ Symbol filter: XAU* shows only your gold trades
✔️ View by EA / magic number
✔️ Read-only: it never opens, changes or closes a trade
Built after a request from a trader who wanted exact daily drawdown numbers for his gold EAs. He is now the first customer.
▶ ATS Performance Statistics: https://www.mql5.com/en/market/product/198305
▶ Free starter version (last 30 days): https://www.mql5.com/en/market/product/196881
📢 Updates and questions: https://www.mql5.com/en/channels/ats-tools
ATS Performance Statistics 按日、按周、按月展示您的账户真实表现:盈亏、最大回撤和最高保证金占用。在图表上以简洁的仪表板呈现柱状图和数字。 大多数统计工具做不到的部分:您没有盯盘的那些日子的回撤和保证金。指标根据您的成交历史和经纪商自己的逐笔报价历史,逐笔跟踪每个持仓,重建过去每一天的净值路径——包括同时持有的交易和对冲持仓。 您将看到 - 所选时段的净结果、最大回撤、最大保证金、交易笔数、胜率和盈利因子 - 同一时间轴上的三组柱状图:结果、回撤和保证金 - 日、周、月三种视图,每种都有可滚动的表格 - By EA 视图:每个 magic number 一行,显示品种、交易数、胜率、盈利因子、结果和回撤——看清哪个EA真正赚钱,哪个在亏钱 - 时间范围:7天、30天、90天、1年、全部历史,或直接在面板中输入自定义日期(起 / 止) - 按净值(含持仓)或仅按已平仓交易计算回撤,一键切换 - 每行都有质量圆点:绿色 = 由真实逐笔报价重建,黄色 = 经纪商没有逐笔历史时由M1K线估算 - 深色和浅色主题,面板可拖动、可折叠 数字如何计算 - 结果 = 盈利 +
按您的止损算手数。免费。 凭感觉选手数,就是一笔普通亏损变成糟糕一天的原因。ATS Lot Sizer 在您的图表上放两条线:止损和目标。拖动它们,面板就会告诉您符合风险的手数,以及这个手数实际押上的金额。一键下单,止损和目标一并附上。 工作方式 选择 LONG 或 SHORT。图表上会出现止损线和目标线,拖动它们即可。 手数 = 您的风险(余额百分比、净值百分比或固定金额)除以止损距离,向下取整到手数步长,绝不向上取整。 面板显示该手数实际会亏损多少,而不是您设定的预算。 在您亲自拖动之前,目标会按您设定的 R 跟随止损。 右侧边缘的方框标签显示 STOP 和 TARGET 以及涉及的金额。 SEND 第一次点击为待发,第二次点击才确认,因此手滑不会发送任何订单(可关闭)。 计划 入场、止损和目标及其距离、手数、以金额和百分比表示的风险、回报和 R:R,以及点差吃掉了多少止损。如果计划无法执行(止损方向错误、小于经纪商最小距离、手数低于最小值、保证金不足),按钮会显示 NOT READY,面板会说明原因。 面板 标题栏显示品种、周期和点差。R 按钮可在 0.25、0.5、1、1.5
按止损算手数。按天锁定。 大多数亏损的日子并不是从糟糕的形态开始的,而是从凭感觉选的手数开始,然后再开第二单想把第一单赢回来。ATS Risk Desk 根据您的止损计算每笔交易的手数,一键下单,管理持仓,并在当天亏损额度用完时把您锁在门外。 工作方式 选择 LONG 或 SHORT。图表上会出现止损线和目标线,拖动它们即可。 手数 = 您的风险(余额百分比、净值百分比或固定金额)除以止损距离,按手数步长向下取整,绝不向上取整。 面板显示该手数实际会亏多少,而不是您设定的预算。 目标线按您设定的 R 跟随止损,直到您自己拖动它。 右侧边缘的标签显示 STOP 和 TARGET 以及对应金额。 SEND 第一次点击为准备,第二次点击才确认,手滑不会下单(可选)。 交易计划 入场、止损和目标及其距离,手数,风险金额和百分比,盈利和 R:R,以及点差占止损的比例。 管理 保本(可选锁定利润)、部分平仓(设定的百分比)和全部平仓,适用于该品种的所有持仓,无论是本工具开的还是其他地方开的 可选:在设定的 R 自动保本,以及自动移动止损