Confluence Gold Lab
- Эксперты
- Версия: 1.2
- Активации: 5

"Wait" as a strategy: a GOLD-only EA that fires about 5 times a month and returned +39.1% over 4 years 10 months of real-tick data (5,000 USD account, fixed 0.02 lot).
If the three confluences are not aligned, it does not fire. That is why it trades rarely and keeps drawdown shallow.
The win rate is 32%. Two out of three trades lose. The design still works because every winner targets 3x the risk.
What this EA does
Confluence Gold Lab is a trend-following Expert Advisor for GOLD (XAUUSD) on M5 only.
It defines direction on a higher timeframe, locates the pullback zone on a middle timeframe, and confirms the trigger on a lower timeframe.
It enters only when all three timeframes agree at the same moment.
Design philosophy
Most EAs enter when a single signal appears. This one does not.
Unless direction (H4), location (M15) and timing (M5) agree, there is no trade.
That agreement is what "Confluence" means, and it is where the name comes from.
The price of that selectivity is frequency: roughly 60 trades a year, about 5 a month.
Low trade count is not a defect. It is the strategy itself.
Entry rules (closed bars only)
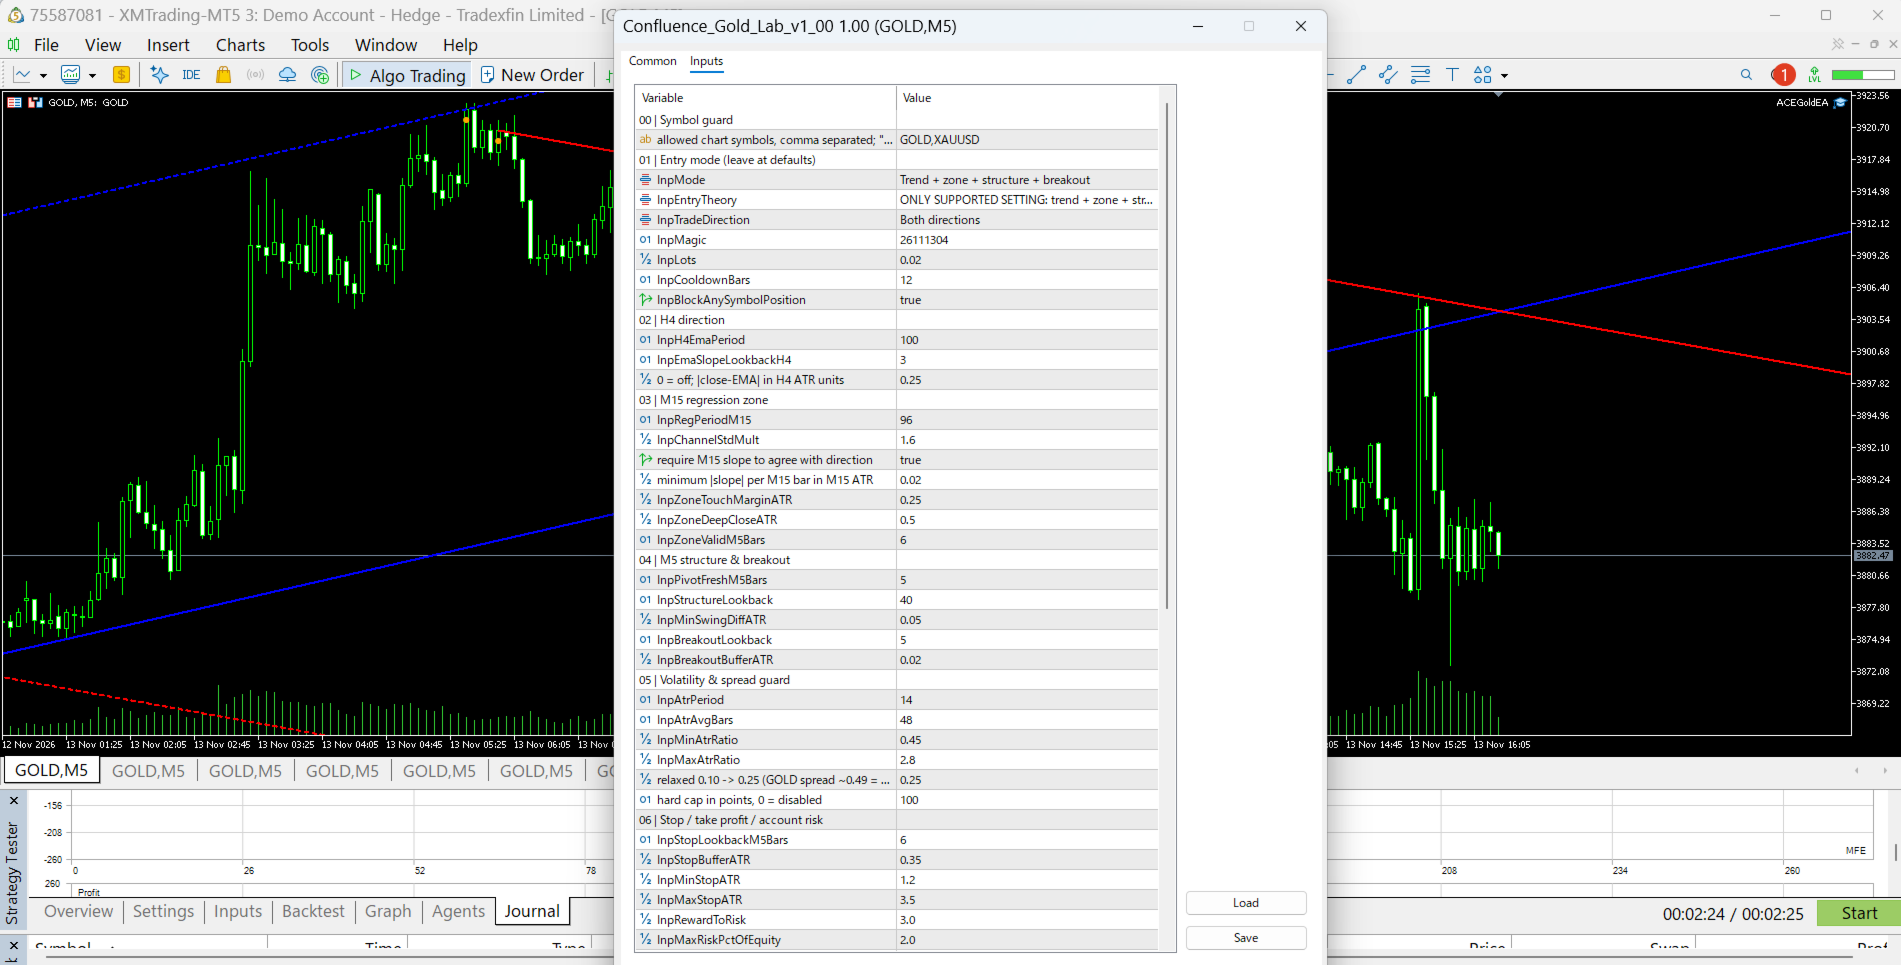
- H4 direction — the last closed H4 close is above EMA100 (long) or below it (short), and the EMA100 slope points the same way
- Trend separation — the distance between H4 close and EMA100 is at least 0.25 ATR (this filters out ranges glued to the EMA)
- M15 pullback — a regression line is fitted to the last 96 closed M15 closes (24 hours) with a ±1.6 sigma band. When a closed M15 touches the band it is recorded as a "zone", valid for 6 M15 bars (30 minutes)
- M5 structure — a confirmed pivot within the last 5 bars, with a higher low than the previous pivot (for longs)
- M5 breakout — the closed M5 close breaks the previous 5-bar high by +0.02 ATR
- Channel slope agreement — the M15 regression slope points in the trade direction (this prevents buying the lower band of a falling channel)
Additional safety filters:
- Volatility: M5 ATR must be between 0.45x and 2.8x its own 48-bar average (excludes dead and violent markets)
- Spread: within 25% of M5 ATR and within 100 points (2-digit gold basis)
- Cross-market: EURUSD M15 EMA50 must point the same way as the trade (a proxy for USD conditions)
- One position per symbol, plus a 1-hour cooldown after each entry
The forming bar is never used. All checks run once, on the first tick after a new M5 bar closes.
Exit rules
Stop loss
The stop goes 0.35 x M5 ATR beyond the extreme of the last 6 closed M5 bars. In addition:
- If it is too tight (less than 1.2 ATR), it is widened to 1.2 ATR
- If it is too wide (more than 3.5 ATR), the trade is skipped
- Prices are normalized to the tick size
The SL distance therefore always sits between 1.2 and 3.5 ATR.
Take profit
SL distance x 3.0 (reward-to-risk 3). With a 1.2 ATR stop the target is 3.6 ATR away; with a 3.5 ATR stop it is 10.5 ATR.
Holding
By default a position is held until SL or TP is hit. Trailing stop and break-even are implemented but disabled by default (enable them by setting InpTrailStartR / InpBreakEvenR above 0). A time-based exit is also available and disabled by default.
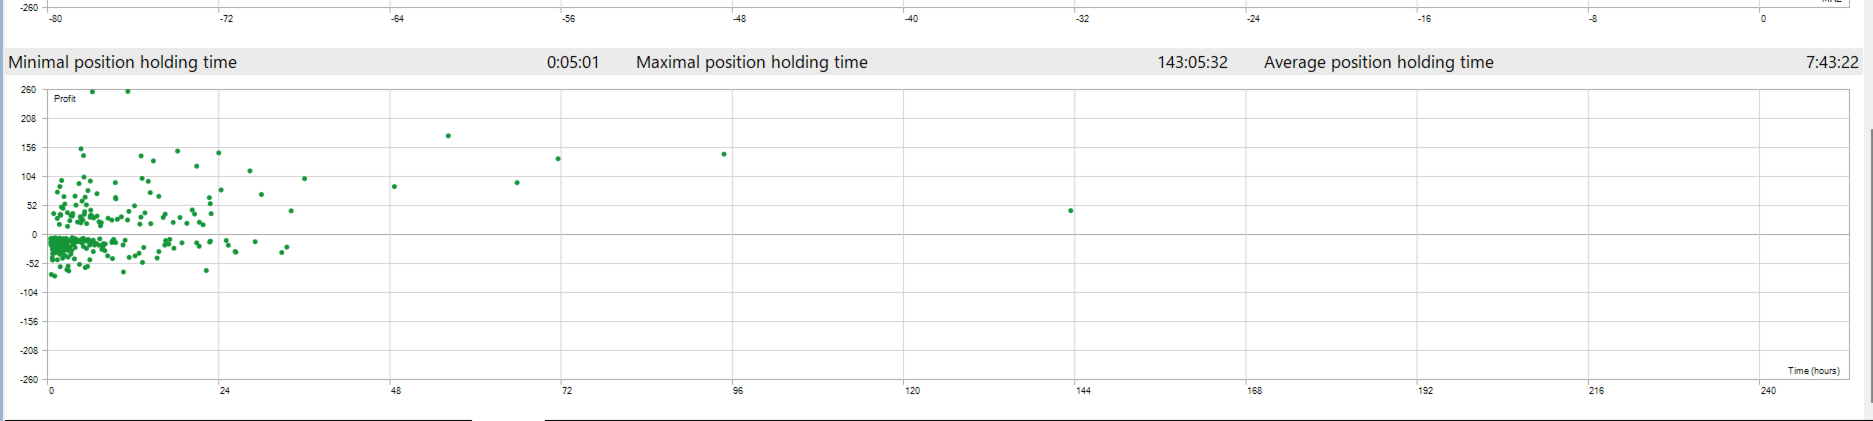
Measured holding time: about 10.3 hours on average, 8.0 days at the longest. This is a swing-style EA that spends less than 10% of the time in the market.
Backtest results
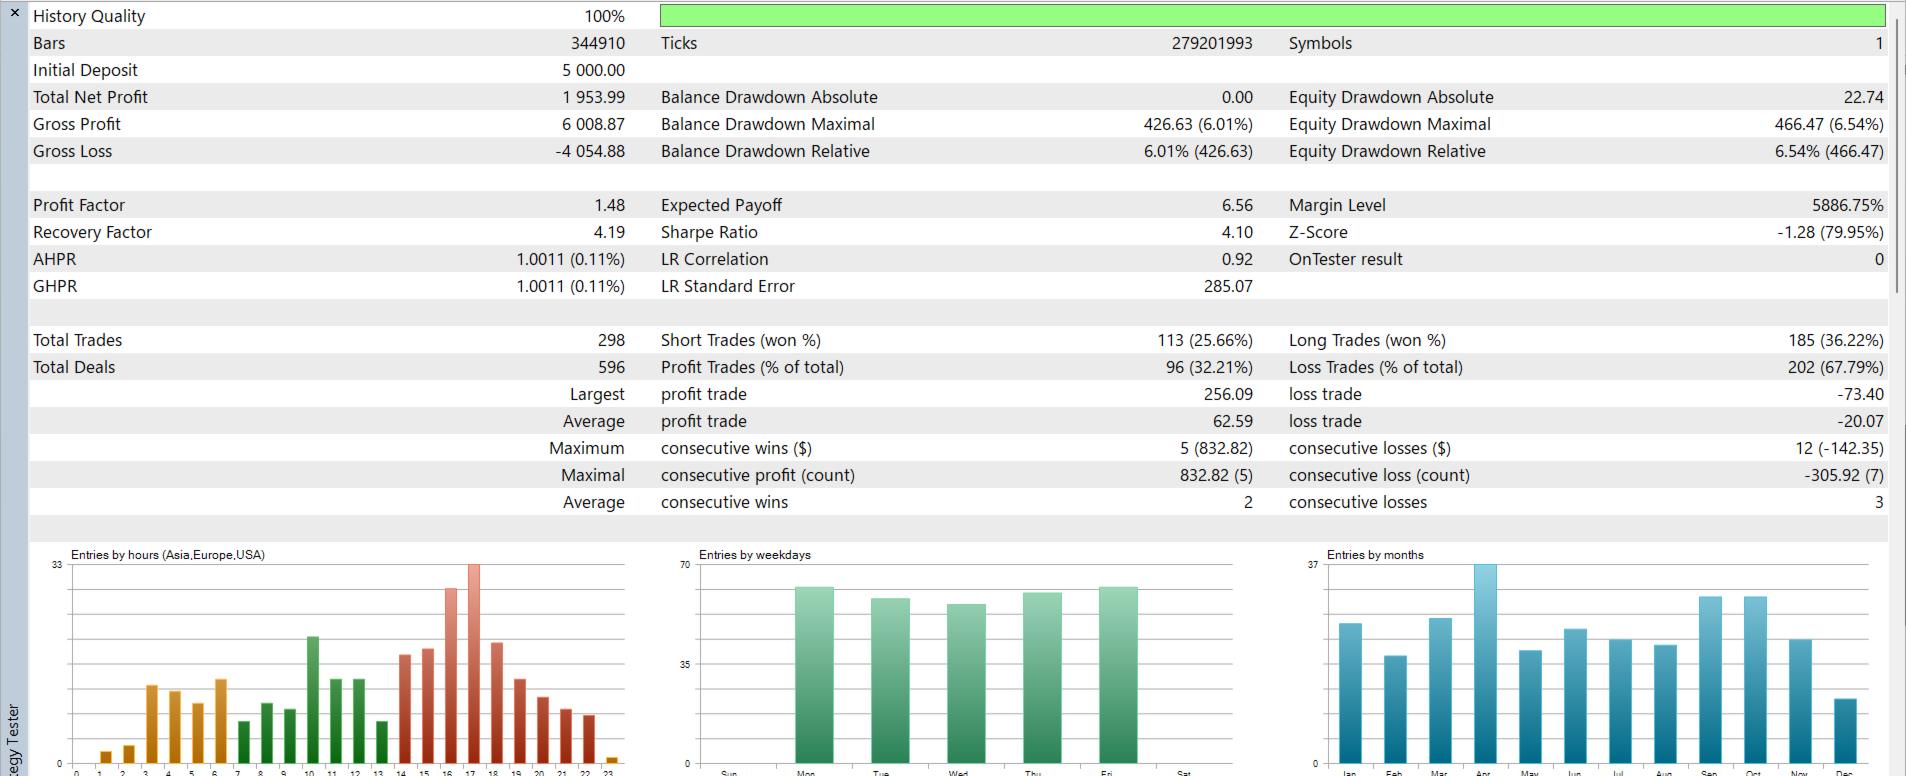
GOLD M5 / 2022.01.03–2026.11.13 (4 years 10 months) / real ticks (279.2 million) / initial deposit 5,000 USD / fixed 0.02 lot / leverage 1:100
| Total trades | 298 (596 deals) |
| Net profit | +1,953.99 USD (+39.1%) |
| Profit factor | 1.4819 |
| Max drawdown (equity) | 6.54% (466.47 USD / balance basis 6.01%) |
| Sharpe ratio | 4.0979 |
| Win rate | 32.2% (96 wins / 202 losses) |
| Average win / average loss | 62.59 / 20.07 |
| Best / worst single trade | +256.09 / −73.40 |
| Max consecutive losses | 12 |
| Expected payoff | 6.56 USD per trade |
| Recovery factor | 4.19 |
Year by year (each year run independently, 5,000 USD / 0.02 lot, real ticks)
| Year | Trades | PF | Net profit | Max DD (equity) |
| 2022 | 40 | 1.7022 | +161.60 | 1.23% |
| 2023 | 31 | 0.8091 | −51.96 | 2.14% |
| 2024 | 51 | 1.2885 | +130.29 | 3.37% |
| 2025 | 83 | 1.8809 | +939.31 | 3.06% |
| 2026 (Jan 1 – Nov 13) | 93 | 1.3808 | +774.75 | 7.84% |
| Sum | 298 | 1.4819 | +1,953.99 | 6.54% (continuous) |
The yearly trade count and the yearly profit add up exactly to the continuous run (298 trades, +1,953.99 USD). No year is counted twice.
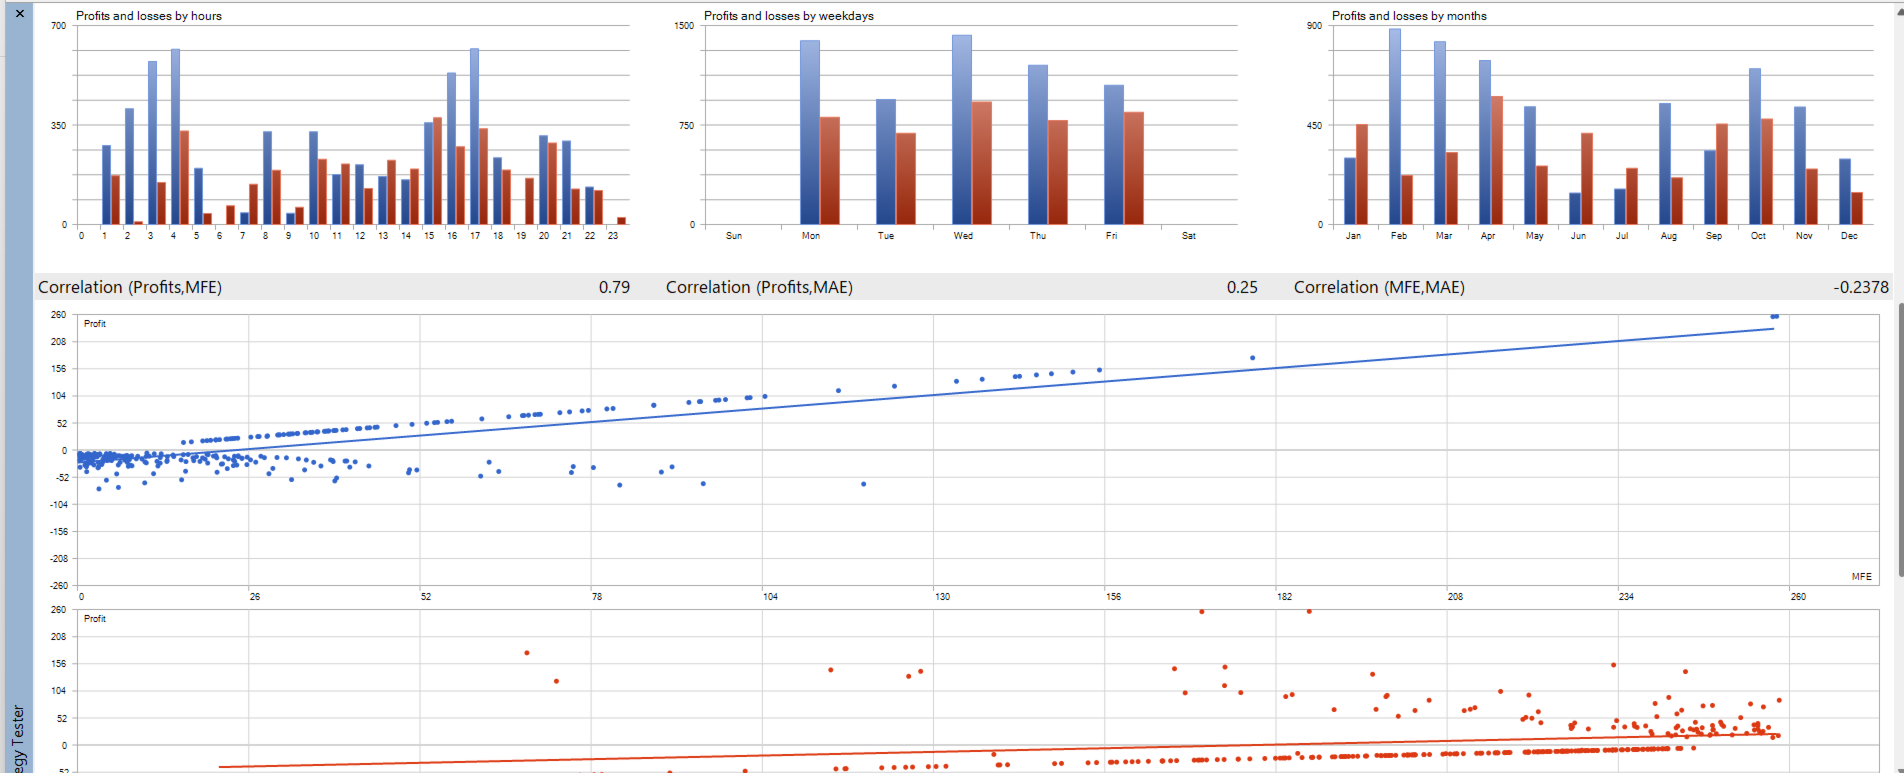
2023 lost money (−51.96 USD). 87.7% of the profit comes from 2025–2026.
2022–2024 together produced +239.93 over 122 trades (essentially flat). 2025–2026 produced +1,714.06 over 176 trades.
Note: real tick data for GOLD at the test broker starts on 2022.01.03, so 2018–2021 is not included in these figures (M1 OHLC reference only). This is not a "fully real-tick verified" claim.
Robustness work done during development
All of the following was measured on the same price data. There is no independent out-of-sample period. Treat the figures as reference.
This section only was produced on the development dataset (M1 OHLC, 2018–2026) with 0.01 lot / 10,000 USD (profit amounts roughly double at 0.02 lot; drawdown percentages depend on account size).
- Parameter stability — reward-to-risk 1.2–4.0, cross EMA 30–70, channel slope 0.01–0.04, trend separation 0.05–0.35, spread allowance 0.15–0.40, band width 1.4–1.8, zone touch margin 0.15–0.40: a plateau on every axis (neighbouring values do not break PF)
- Simultaneous perturbation — 10 parameters moved together by about ±10%, 8 combinations: all 8 profitable (PF 1.25–1.36, profit +591 to +930, DD 1.52–3.04%). This is only "8 out of 8 tested sets were profitable" on the same data. The baseline (PF 1.3465 / +872.81) is the best of the nine runs, so a realistic expectation is the perturbation mean (PF about 1.29 / profit about +740)
- Ablation — removing any one of the three confluences multiplies trade count by 1.3–3.5x while profit stays flat or halves. Removing all three gives PF 0.9717 and a loss
- Random entry control — keeping the same SL/TP but randomizing entry produces PF 0.89–0.90 with 48% drawdown. This suggests the edge sits in the entry logic (it is hard to explain by exit design alone; trade counts differ greatly, so this is not conclusive)
- Direction split — long-only PF 1.4725, short-only PF 1.1513, so it is not purely dependent on a rising market
Requirements
| Platform | MetaTrader 5 (build 3000 or newer recommended) |
| Symbol | GOLD / XAUUSD (works with 2 and 3 digits). InpSymbolFilter (default GOLD,XAUUSD ) uses a partial match, so a chart whose name does not contain GOLD or XAUUSD will refuse to start |
| Timeframe | M5 |
| Auxiliary symbol | EURUSD (required for the cross filter; must be in Market Watch) |
| Recommended minimum deposit | 5,000 USD or more (fixed 0.02 lot) |
| Recommended leverage | 1:100 or higher |
| Account type | Hedging or netting |
| DLL | Not used |
Drawdown by account size (fixed 0.02 lot, real ticks 2022.01–2026.11, all four measured)
With a fixed 0.02 lot the trades and the profit amount do not depend on account size (5,000 USD and above: +1,953.99 USD over 298 trades). Only the percentages change.
| Initial deposit | Return | Net profit | Max DD (equity) | Trades | Assessment |
| 2,000 USD | +79.0% | +1,579.89 | 12.42% | 294 | Not recommended (4 trades skipped by the 2% cap, PF 1.4033) |
| 4,000 USD | +48.8% | +1,953.99 | 7.61% | 298 | Works, but with little room |
| 5,000 USD | +39.1% | +1,953.99 | 6.54% | 298 | Recommended (basis of this description) |
| 10,000 USD | +19.5% | +1,953.99 | 3.85% | 298 | Safest |
* At 2,000 USD the 2% equity risk cap (40 USD) blocks 4 trades, so the run shows 294 trades instead of 298. The practical floor for a fixed 0.02 lot is 4,000 USD; 5,000 USD or more is recommended.
* Plan for 2 to 3 times the measured drawdown. On 5,000 USD that means being able to absorb 13–20% (650–1,000 USD).
* The per-trade risk limit ( InpMaxRiskPctOfEquity ) is 2% of account equity, and a trade whose estimated loss exceeds it is skipped (the EA never silently reduces the lot). Because the limit is evaluated on an OrderCalcProfit estimate, the realized loss including spread and swap can slightly exceed it (at 2,000 USD the measured worst trade was 70.80 USD against a 40 USD cap).
Live accounts
The EA works on demo, live and in the strategy tester right after installation, with no extra setup.
To intentionally prevent live trading, set InpAllowLiveTrading to false (a guard against accidental operation).
Running it on a demo account for 2–3 weeks first is recommended.
Included presets
Load one of the attached preset files and you are ready (both are 0.02 lot, 5,000 USD basis).
- Standard: spread cap 0.25 ATR (for brokers with stable, tight spreads)
- Narrow-spread selection: spread cap 0.15 ATR (stricter than standard; trades only in exceptionally tight moments, about 58% of the trade count with a similar PF of 1.37)
Read this before buying
1. It trades rarely
About 60 trades a year, about 5 a month. Months with no trades at all are normal. This is not an EA that enters every day.
2. Profit is modest even at 0.02 lot
4 years 10 months on 5,000 USD produced +1,954 USD (about 8% a year, simple). That is the result of a deliberately conservative size, where the average loss is about 0.3% of the account. Raising the lot scales profit linearly and scales drawdown the same way (0.03 lot is not measured, but scaling from the measured 6.54% gives about 9.8%). 0.03 lot or more is not recommended: drawdown approaches 10% and realized losses get close to the 2% cap.
3. The win rate is 32%
Two of three trades lose. There has been a 12-loss streak (the real-tick report value, consistent across all 2022–2026 runs). At 5 trades a month, that is several months of continued losses, and it has happened.
4. It has good and bad regimes
It earned in the strongly trending 2025–2026 period and was essentially flat in 2022–2024 (three years +239.93 combined, with 2023 at −51.96). It is not an EA that earns steadily every year.
5. Six months of monitoring cannot judge it
Six months contains about 30 trades. 2023 was negative for the full year. Do not judge it on short-term results.
6. GOLD only
No edge was confirmed on SILVER (PF 0.60) or USDJPY (PF 0.85), and other symbols are out of scope. The default InpSymbolFilter is GOLD,XAUUSD : a chart whose symbol does not contain this text (for example EURUSD) is rejected at initialization. The check is a partial match so that suffixes and prefixes work ( GOLD.a , XAUUSDm , #GOLD all pass, and so would another symbol containing "GOLD"). To restrict strictly, enter the exact symbol name.
7. One position at a time
One position per symbol. No averaging down, no pyramiding, no multiple positions. Adding to winners was tested and rejected: drawdown doubled and the recovery factor fell.
Disclaimer
- Backtest results do not guarantee future performance
- All validation was done on the same price history; there is no guarantee the same edge persists
- Leveraged FX and CFD trading can lose more than the initial deposit
- The author accepts no liability for any loss arising from the use of this EA
- Trade at your own risk and responsibility, and confirm behaviour on a demo account first
Tags
GOLD, XAUUSD, trend following, multi-timeframe, swing