Volatility Target Allocator
- Эксперты
- Версия: 1.2
- Активации: 5

Volatility Target Allocator holds a long position in an index CFD and decides
how large that position should be from a forecast of volatility, not of
price. When the market is calm it holds more; when it turns violent it holds
less; below the 200-day average it holds nothing.
It is a risk-sizing expert, not a signal generator. It never sells short and
it does not try to call the next move.
WHAT IT DOES
Once a week, after a daily bar closes:
1. Forecasts next week's volatility with a HAR regression on yesterday's,
last week's and last month's high-low range volatility, refitted from
scratch on up to six years of daily bars at every resize.
2. Sizes the position as Target Volatility divided by that forecast, capped.
3. Stands aside while price is below its 200-day average. Between resizes the
average is still checked every day, but only to leave: a break is exited
the same day, and re-entry waits for the next resize.
4. Adjusts the position, ignoring changes too small to be worth the spread.
WHAT THE RESEARCH SHOWED
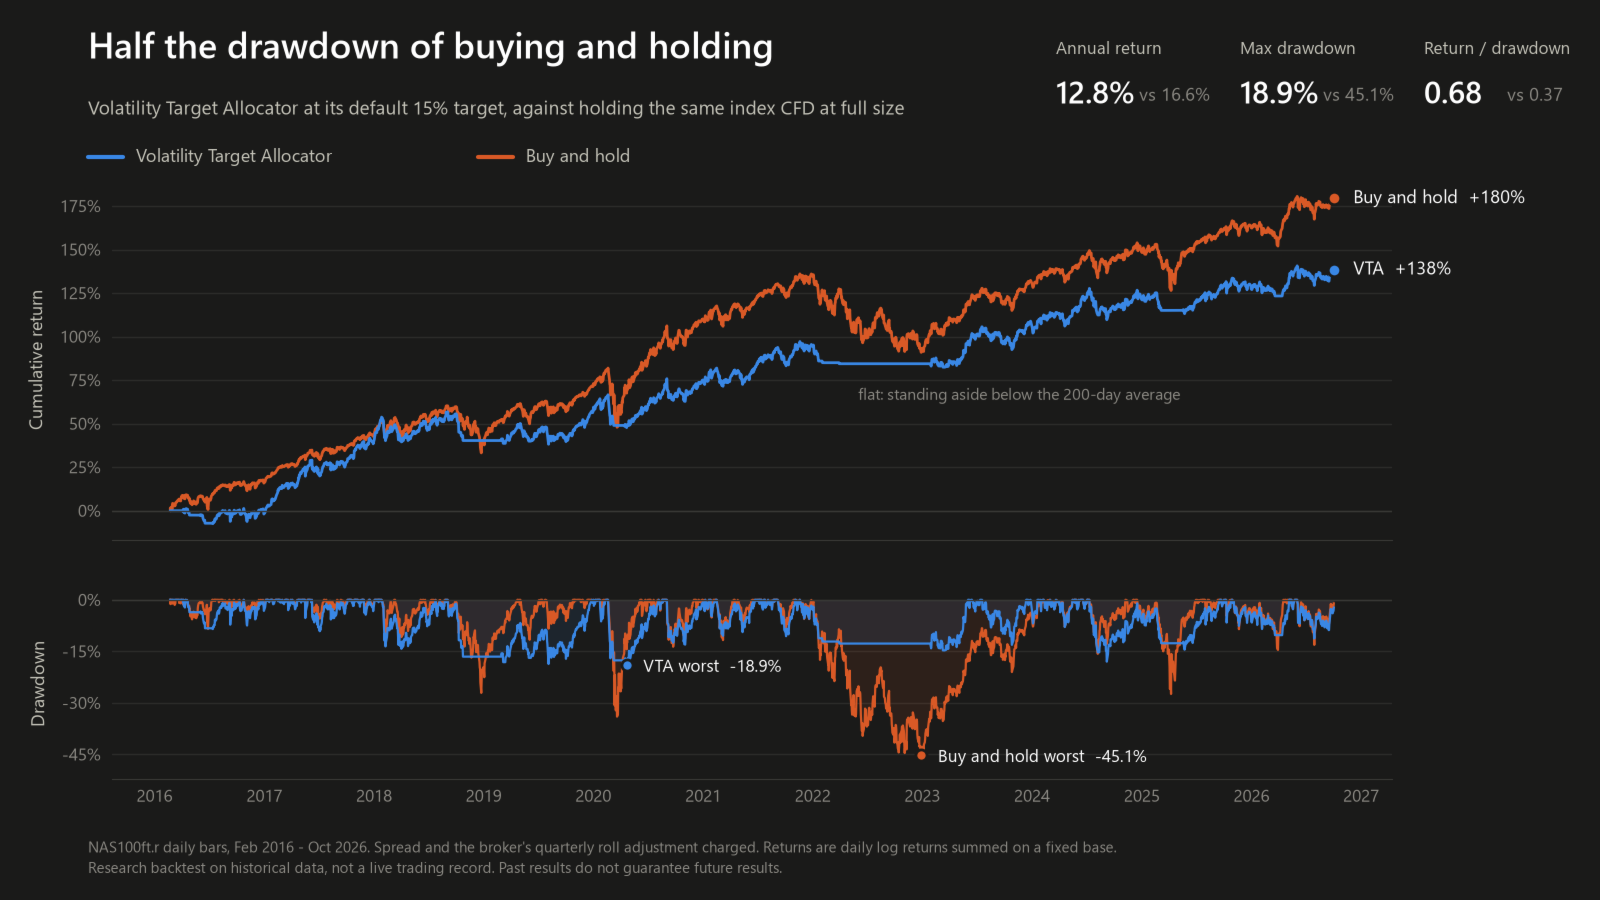
NAS100 index CFD, February 2016 to October 2026, daily bars, walk-forward,
with the spread and the broker's quarterly roll adjustment charged:
annual max drawdown return / drawdown
Buy and hold, full size 16.6% 45.1% 0.37
This EA, 15% target 12.8% 18.9% 0.68
It does not add return. It earns about four points a year less than holding
the index outright, and in exchange its worst drawdown is well under half.
That is not just a smaller position: holding the same average exposure fixed
keeps buy-and-hold's 0.37 ratio. The EA gets to 0.67 by being small at the
right times rather than small all the time.
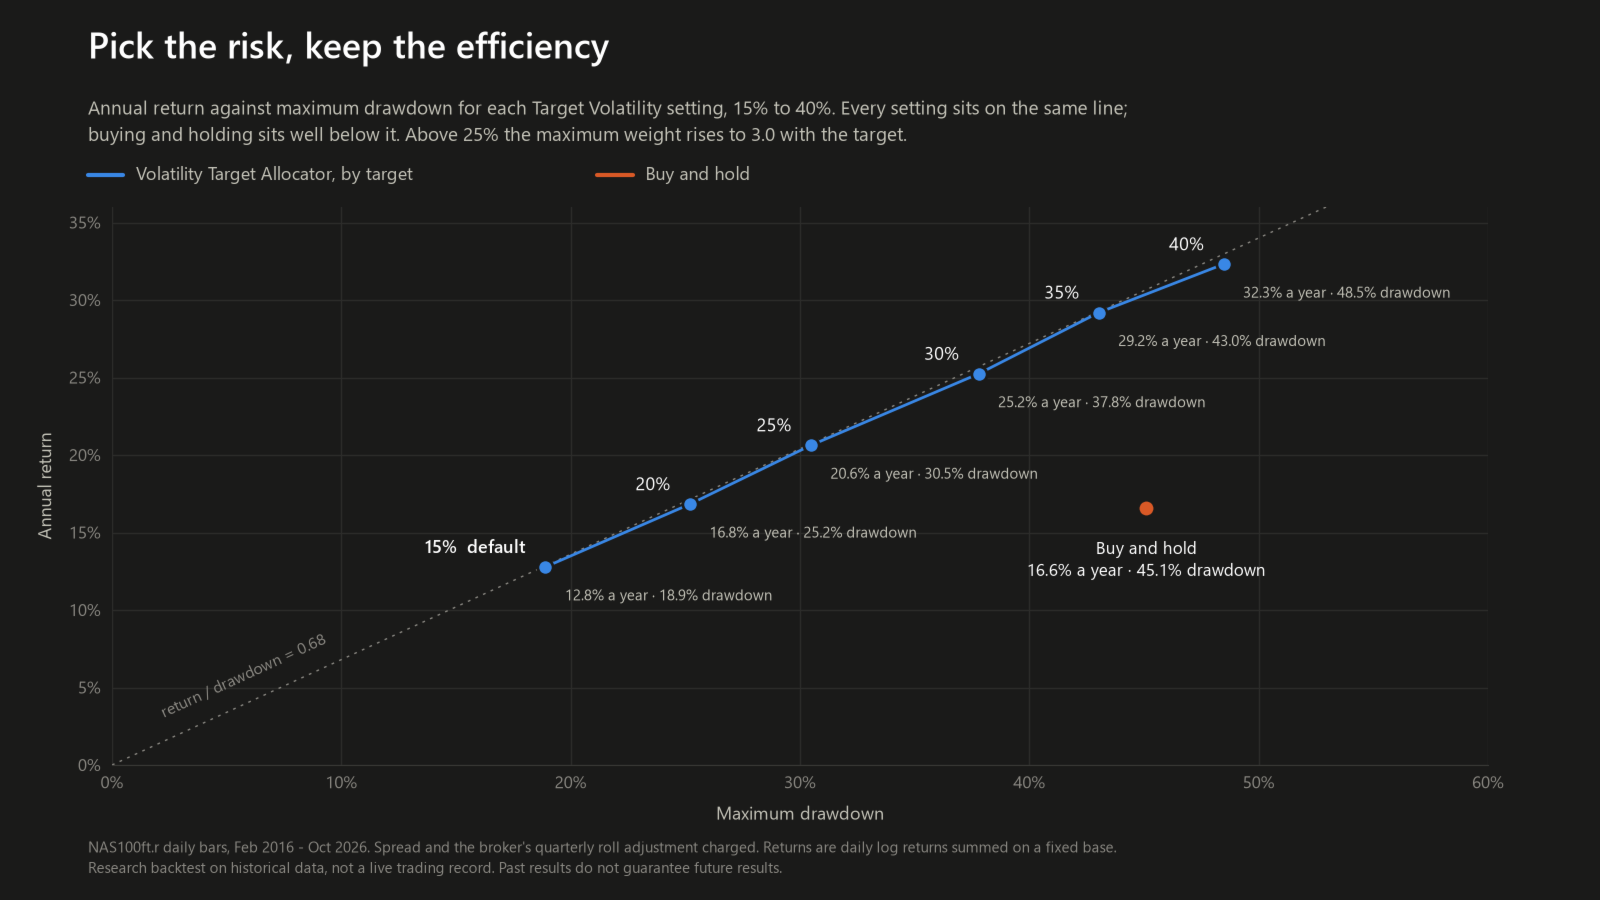
TARGET VOLATILITY: 15% UP TO 40%
The target is chosen from a list - 15, 20, 25, 30, 35 or 40% - and every
setting up to 40% may be used. Raising it raises return and drawdown
together; the ratio between them stays at 0.67-0.68 on every setting,
because the maximum weight and the equity brake move with the target
automatically.
target annual max drawdown max weight brake
15% 12.8% 18.9% 2.0 35%
20% 16.8% 25.2% 2.0 40%
25% 20.6% 30.5% 2.0 50%
30% 25.2% 37.8% 3.0 60%
35% 29.2% 43.0% 3.0 70%
40% 32.3% 48.5% 3.0 80%
At 35% and 40% the drawdown is as deep as holding the index itself, or
deeper. Choose them only if you could sit through that, and allow for live
drawdowns running deeper than any backtest. The default, 15%, is the
setting for most accounts.
SAFETY
- Equity brake: flattens on a severe drawdown from the peak, then waits for
a fresh trend signal before trading again
- Margin cap: a resize never takes the margin in use past 50% of equity
- Spread guard and session check: a resize waits rather than paying a
rollover spread or sending orders into a closed market; refused orders
are retried at most once per chart bar
- One copy per symbol: a second chart with the same magic number refuses to
start, so the position is never bought twice
- State survives a terminal restart
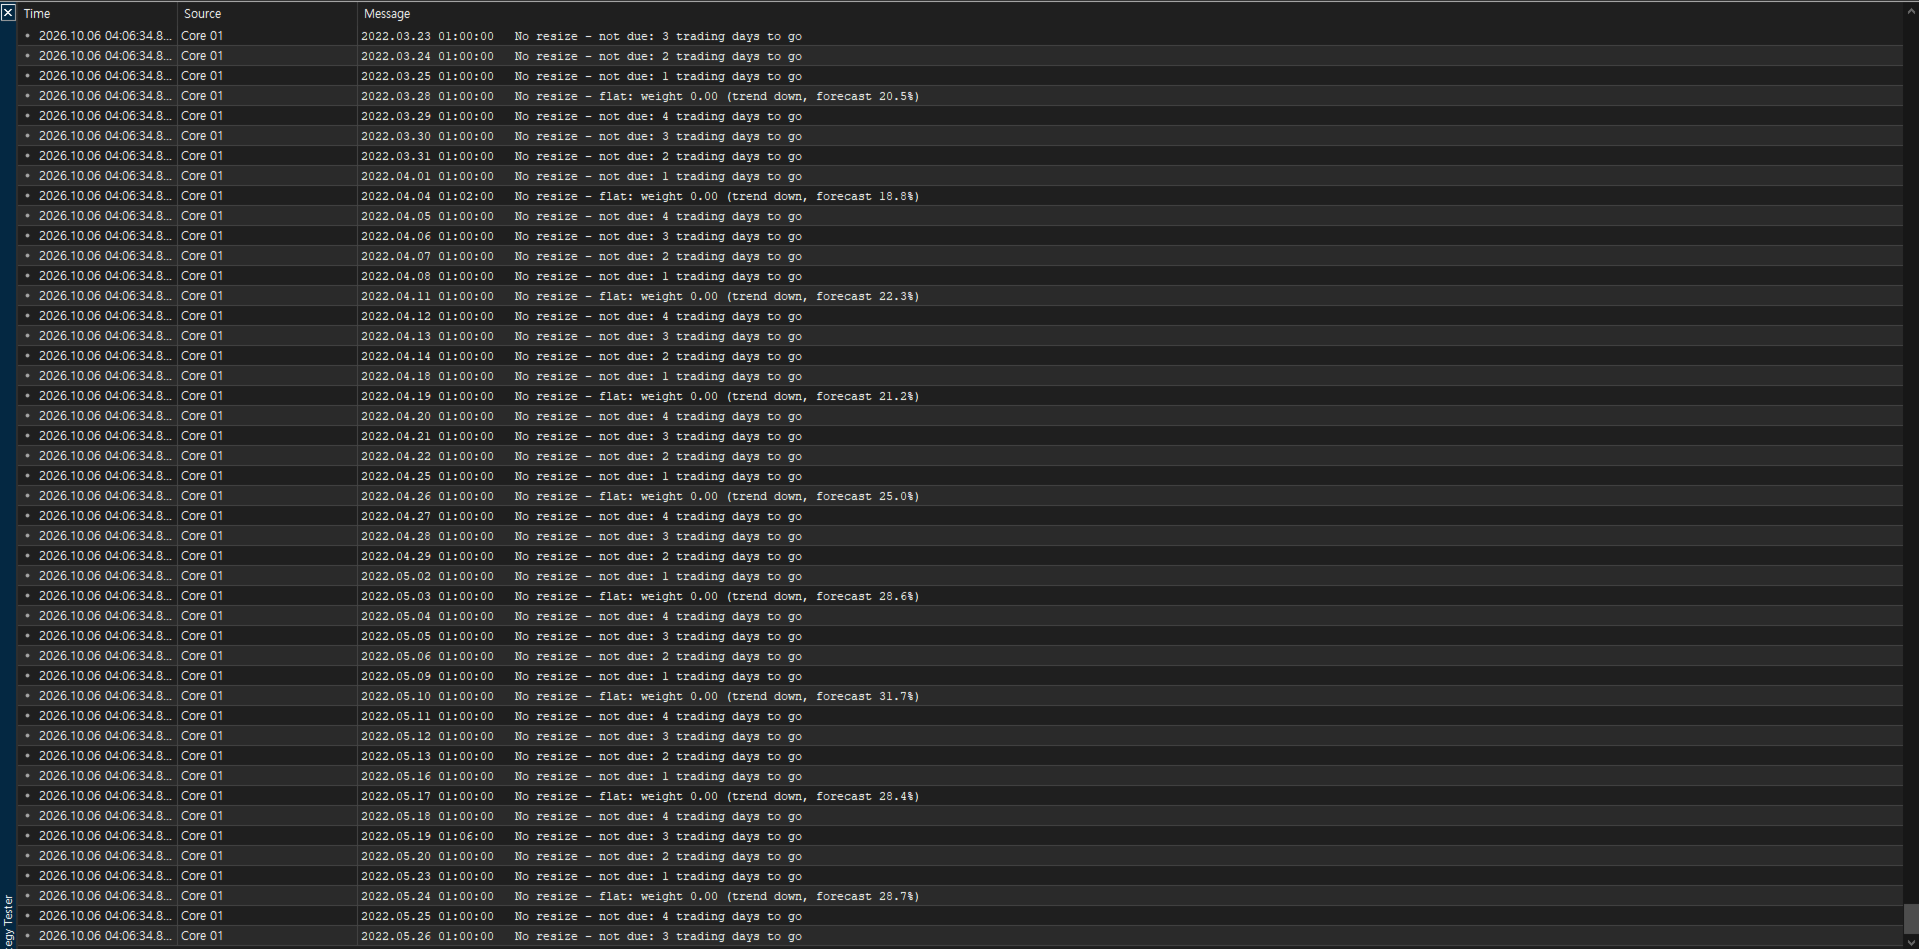
- Every reason for not trading is printed to the journal, so a flat stretch
can always be explained
WHERE IT WORKS
Recommended: equity index CFDs with a long-term upward drift that clearly
exceeds the cost of holding them - NAS100 in the research. It can be
attached to any symbol, but on an instrument with no upward drift, such as a
currency pair, there is nothing for it to size and it should not be expected
to make money.
HOW TO USE
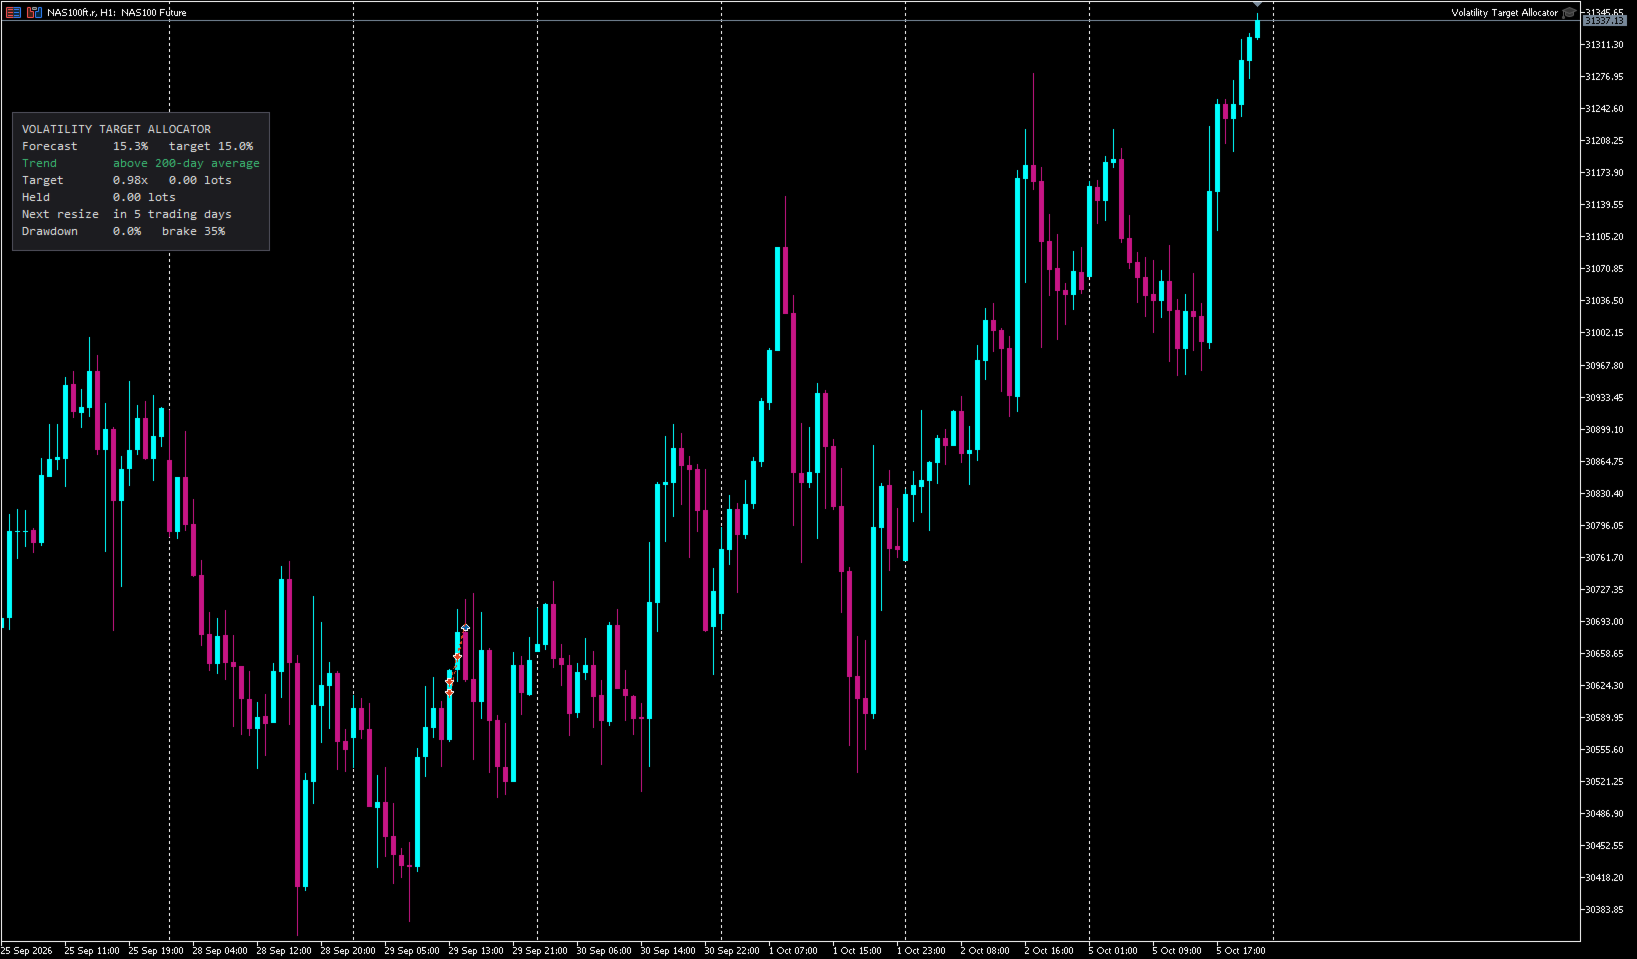
1. Attach it to an index CFD chart. H1 is recommended; it reads daily bars
internally whatever the chart shows.
2. It needs 250 daily bars before the first trade, so let the history
download first.
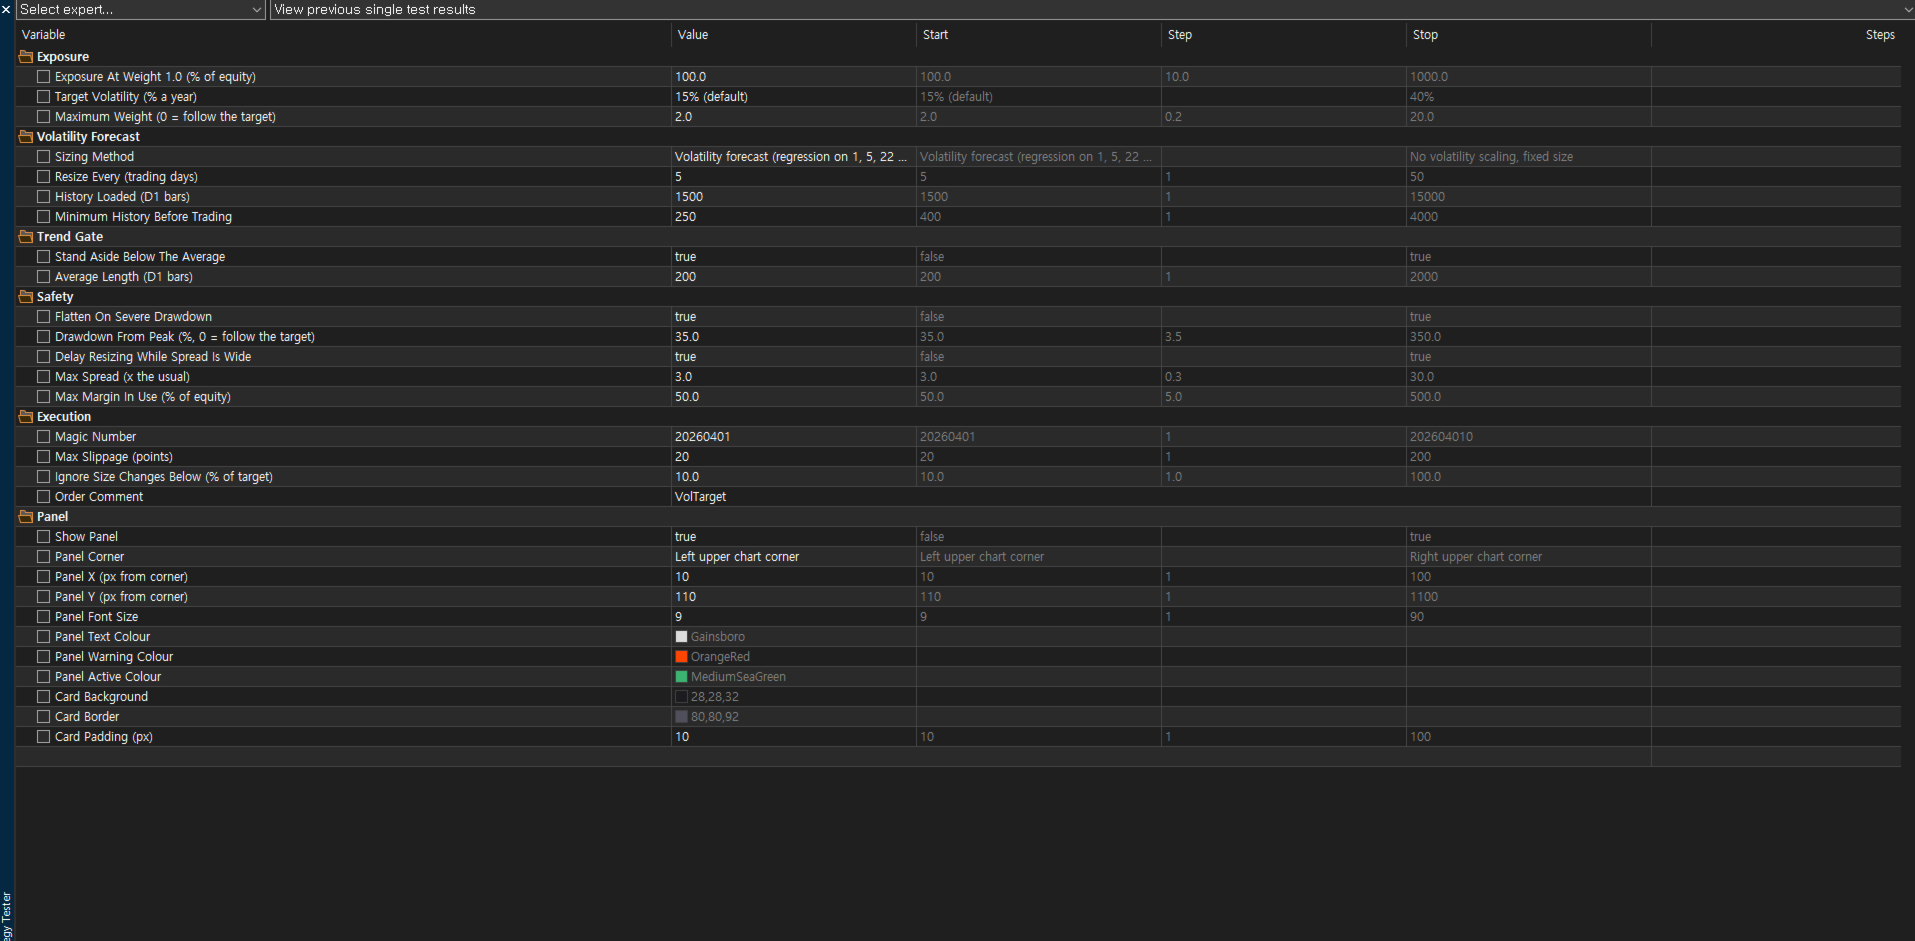
3. Keep Exposure At Weight 1.0 at 100% on an account dedicated to it, and
lower it if the account is shared with other strategies.
4. Run it on a demo account for a few weekly resizes before going live.
NOTES
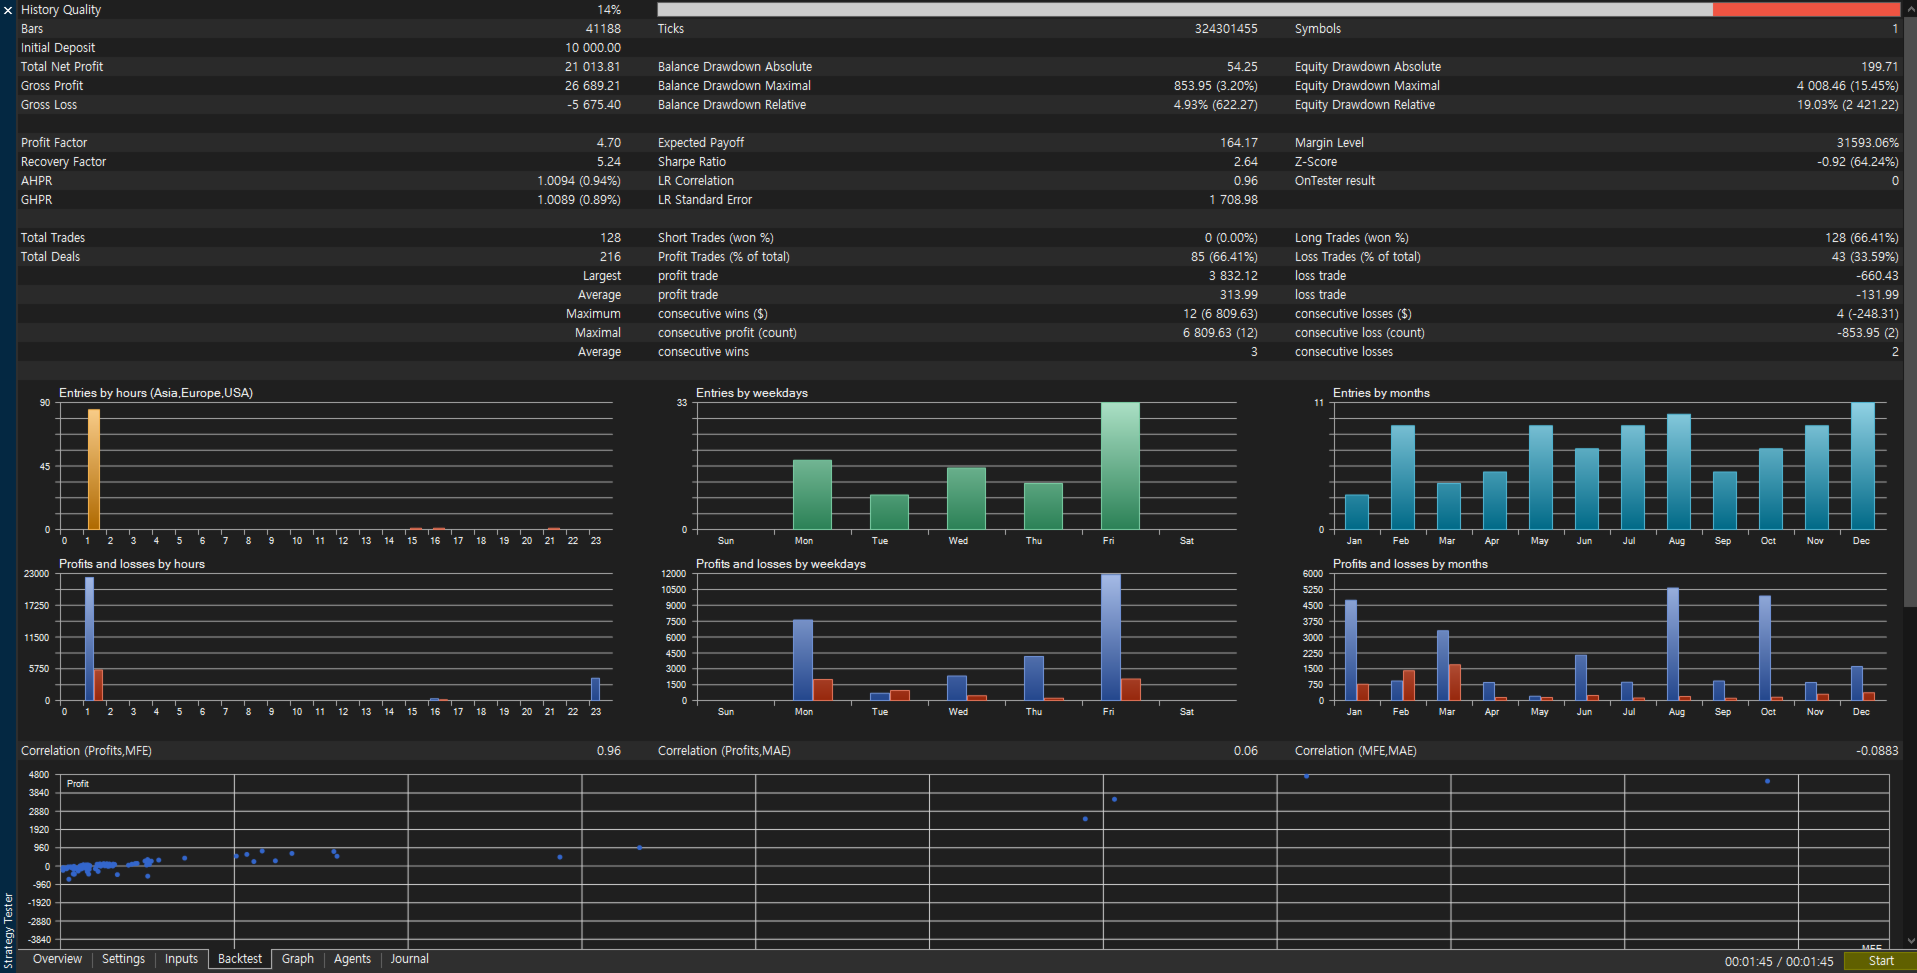
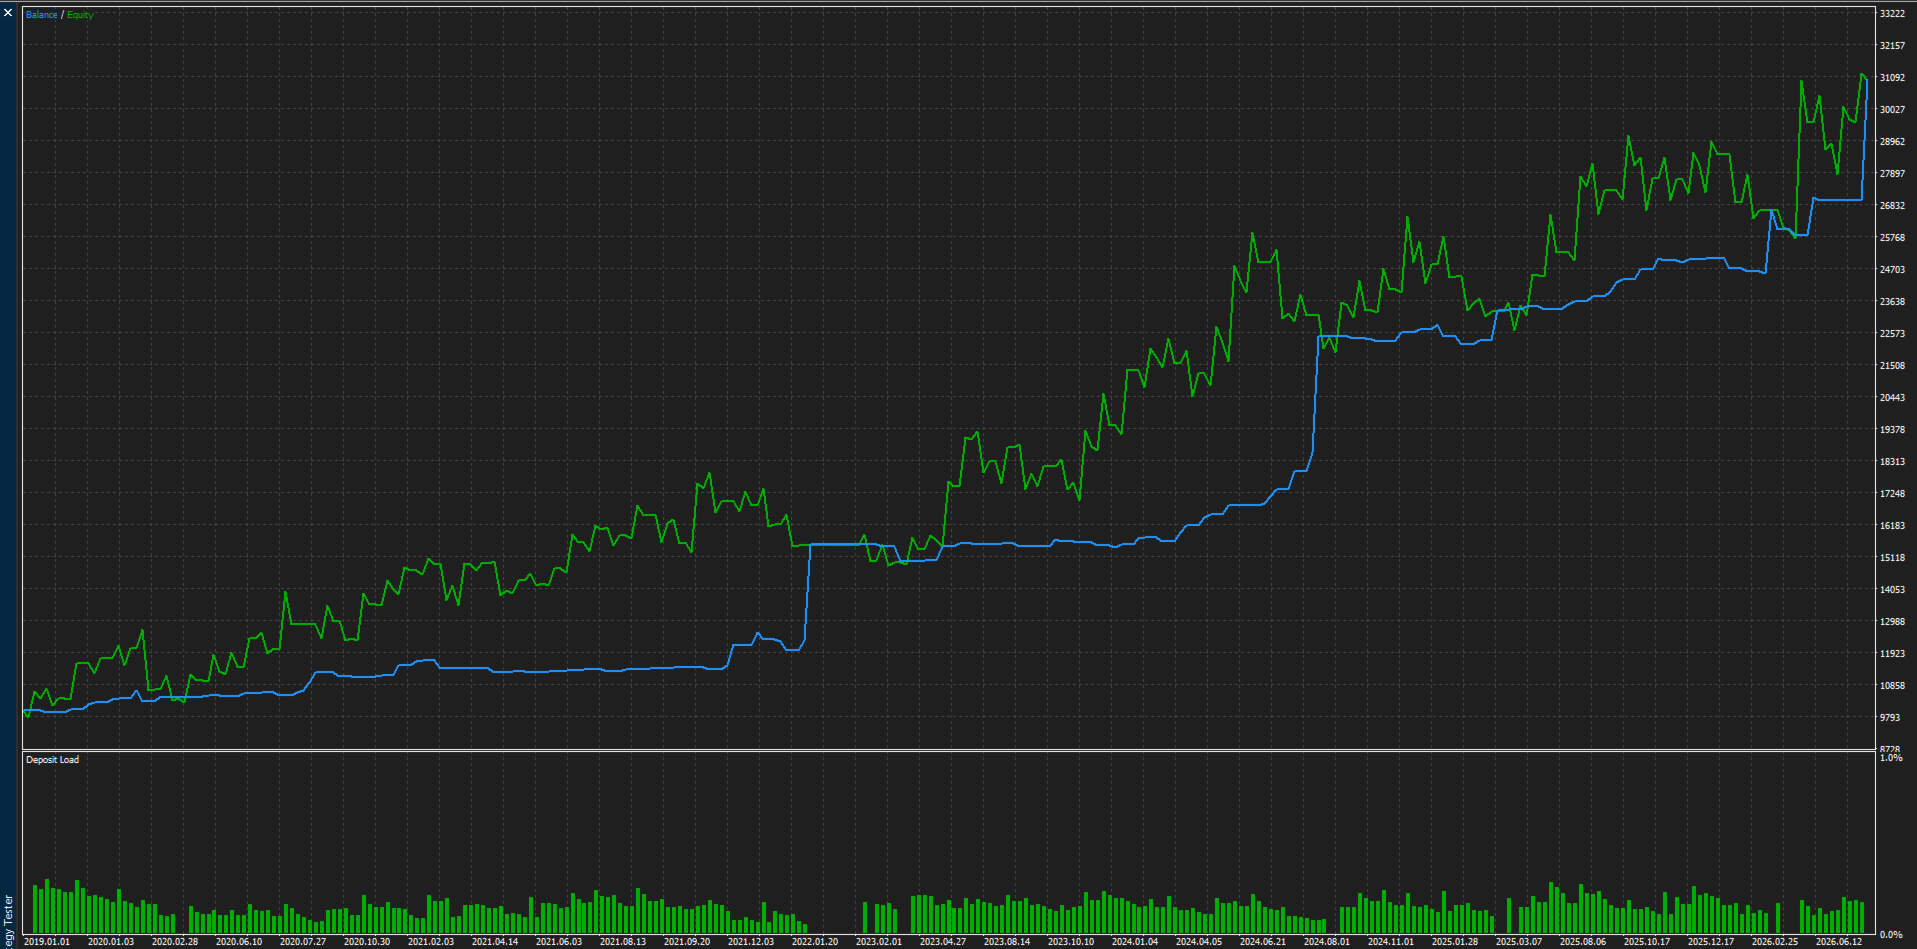
- The figures above come from a research backtest on daily data
(2016-2026), checked against the MT5 Strategy Tester (2019-2026). The
tester charges no rollover adjustment on futures-based index CFDs, so its
results run 2-4 points a year higher than a real account would see.
- The account must be large enough for the position to be expressed. On an
index CFD traded in 0.1-lot steps, a 10,000 account can only adjust in
steps of about a third of its equity.
- This is a position-sizing tool, not a promise of profit. Past results do
not guarantee future results.