Parabolic SAR Oscillator Indicator MT4
- Индикаторы
- Eda Kaya
- Версия: 1.2
Parabolic SAR Oscillator Indicator for MT4 Download
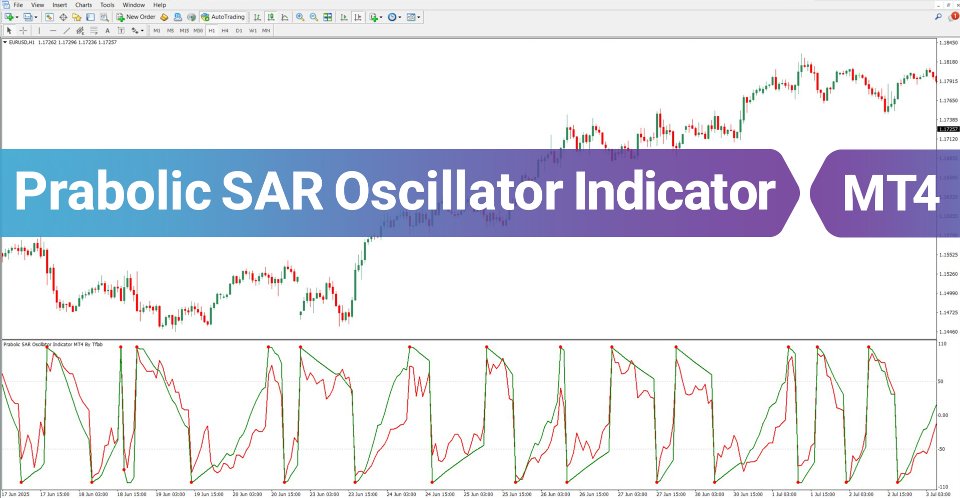
The Parabolic SAR Oscillator Indicator serves as a reliable instrument for spotting overbought and oversold zones, evaluating momentum dynamics, and identifying trend direction shifts with greater speed. This oscillator is derived from the traditional Parabolic SAR tool, but instead of plotting dots directly on the price chart, it visualizes the data as a responsive oscillator panel beneath the main chart.
«Indicator Installation & User Guide»
MT4 Indicator Installation | Parabolic SAR Oscillator Indicator MT5 | ALL Products By TradingFinderLab | Best MT4 Indicator: Refined Order Block Indicator for MT4 | Best MT4 Utility: Trade Assistant Expert TF MT4 | TP & SL Tool: Risk Reward Ratio Calculator RRR MT4 | Prop Firm Protector: Prop Draw Down Protector Expert Advisor MT4 | Money Management: Easy Trade Manager MT4
Parabolic SAR Oscillator Specifications Table
Below are the core specifications of the Parabolic SAR Oscillator:
| Feature | Description |
| Category | Oscillator – Momentum – Overbought/Oversold |
| Platform | MetaTrader 4 |
| Skill Level | Intermediate Users |
| Indicator Type | Trend Reversal – Trend Continuation |
| Time Frame | Supports Multiple Time Frames |
| Trading Style | Suitable for Scalping – Day Trading – Swing Trading |
| Market | Compatible with All Market Types |
Overview of the Parabolic SAR Oscillator
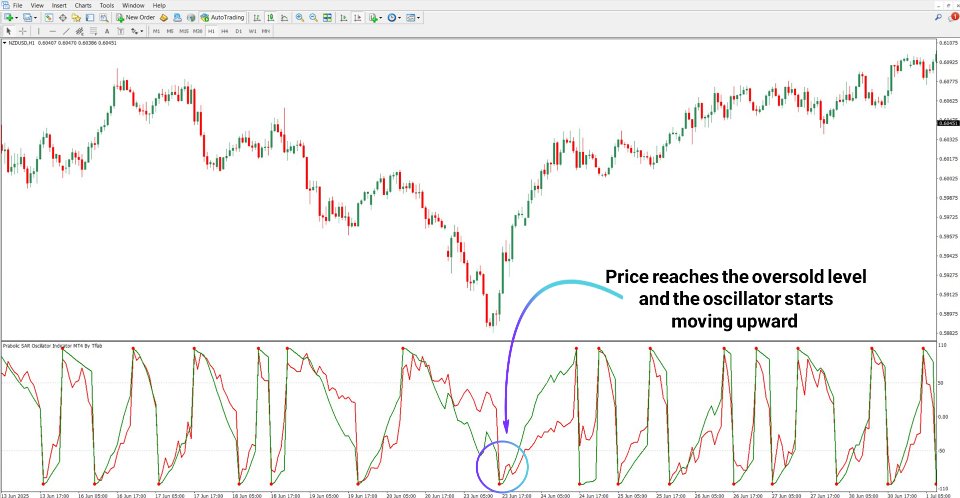
This indicator incorporates two curved lines—green and red—that dynamically track momentum shifts. When the oscillator moves into either the overbought or oversold territories, it highlights those regions with red dot markers for easy identification.
Bullish Scenario
Looking at the NZD/USD pair, the oscillator entered the oversold region, and a red dot was displayed as confirmation. The rising pattern of the oscillator lines further validated the potential for an upward reversal, signaling a trend shift.
Bearish Scenario
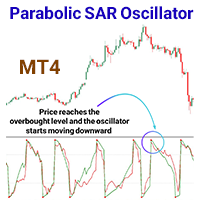
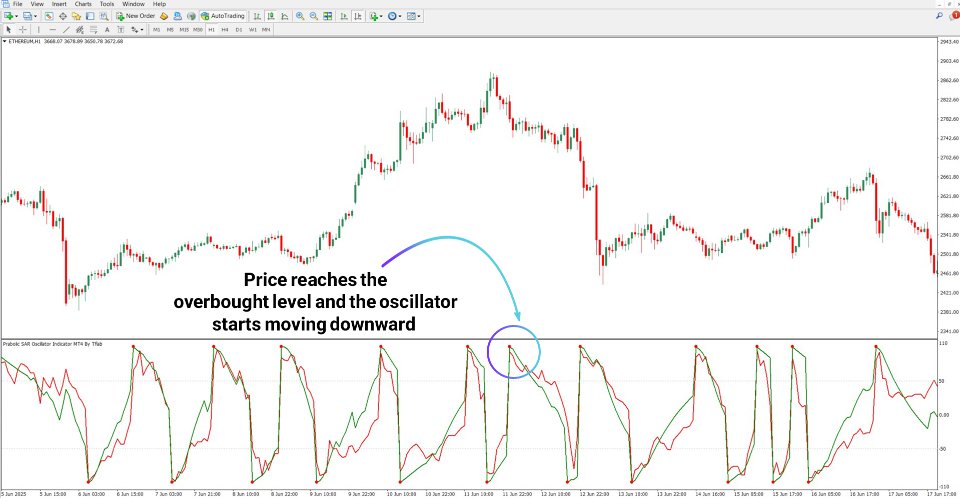
In the 1-hour timeframe of Ethereum (ETH), the oscillator signaled an overbought area, followed by a price drop once that threshold was breached, confirming a reversal in trend.
Parabolic SAR Oscillator Settings
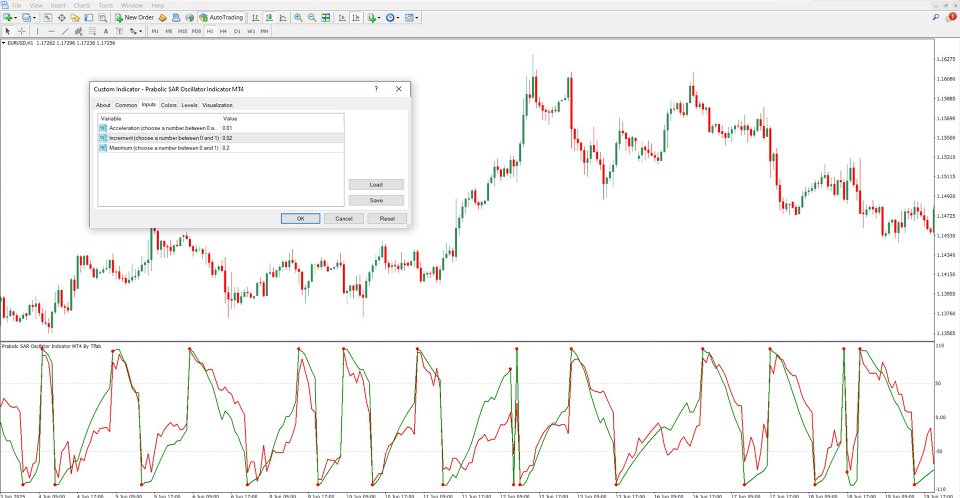
The image below illustrates the main parameters of the Parabolic SAR Oscillator:
- Acceleration: Defines the initial SAR speed.
- Increment: Determines the step-by-step acceleration rate.
- Maximum: Limits the highest value for SAR acceleration.
Conclusion
The Parabolic SAR Oscillator Indicator for MT4 Download presents momentum and reversal insights more clearly through its oscillating visual style rather than conventional SAR dots. Key parameters such as acceleration, increment, and maximum help fine-tune its sensitivity and precision.
It's a valuable resource for traders aiming to identify trends and optimize entry and exit points effectively.
