Смотри обучающее видео по маркету на YouTube
Как купить торгового робота или индикатор
Запусти робота на
виртуальном хостинге
виртуальном хостинге
Протестируй индикатор/робота перед покупкой
Хочешь зарабатывать в Маркете?
Как подать продукт, чтобы его покупали
Платные технические индикаторы для MetaTrader 4 - 71
Binary & Forex (+ 90% Ratio-Win Next Candle)
Wait for the price to reach a good (strong) zone be it support, resistance, supply or demand zone, fibonacci level key, round figure. By doing the above there will definitely be a reversal in price and you will get your ITM on the first candle giving 100% effectiveness following the trend. It is very important to be attentive to the fundamental news in the market and these do not affect your trading. Commercial sessions: any (24 hours). Currency

При торговле с использованием Strat важно следить за несколькими таймфреймами. Этот индикатор будет отображать дневное, еженедельное, месячное и квартальное состояние текущей свечи для каждого таймфрейма. Значок в виде круга показывает, что свеча на этом таймфрейме в настоящее время является внутренней или типом 1 в терминологии TheStrat. Свеча внутреннего дня консолидирует ценовое действие, и мы ищем прорыв диапазона. Значок треугольника, указывающий вверх или вниз, является трендовой свечо

Trend Thyrogen это стратегия для торговли по тренду, фильтрация и все необходимые функции, встроенные в один инструмент! Интеллектуальный алгоритм индикатора с генерирует входные сигналы и уровни выхода.
Принцип работы индикатор заключается в том, чтобы при размещении на график автоматически определять текущее состояние рынка, анализировать исторические данные, на основании исторических данных и выводить на экран трейдеру указания к дальнейшим действиям. Система сама показывает в виде стрелок

Индикатор Qubit Trend работает используя функцию циклично-волновой зависимости. Таким образом, все точки входа будут оптимальными точками, в которых изменяется движение. Точки входа нужно использовать как точки потенциального разворота рынка. Настройки индикатора по умолчанию достаточно эффективны большую часть времени. Вы можете настроить их, исходя из своих потребностей. Но не надо забывать, что подход должен быть комплексным, сигналы индикатора требуют дополнительной информации для входа в ры

The Retracement Feeder checks for retracement opportunities after the first move has occurred. Basically it scans for the second wave of trend. Works with any financial instrument, It does not repaint/change color or cancel arrows, Easy to set and use. Works great with Renko Charts
MT5 version: https://www.mql5.com/en/market/product/71340
How it works
The indicator is based on RSI and Stochastics. The algorithm used in the Retracement Feeder allows the Stochastic and RSI to minimiz

Chaos Trend это стрелочный индикатор для определения потенциальный точек входа. Нравится он, прежде всего, тем, что в нём заложен простой механизм работы, адаптация ко всем временным периодам и торговым тактикам. Надежнее говоря, Форекс индикатор Chaos Trend – настоящая торговая стратегия, с помощью которой можно добиться нужных результатов.
Как только индикатор Chaos Trend будет установлен, сразу начнется пересчитываться основные показатели по цене торгуемой пары, опираясь на постулаты техни

Индикатор канала Channel Token в автоматическом режиме строит канал сопровождения трендового движения.
Цена находится в своем трендовом движении в определенном диапазоне, а не хаотический разнос цены непонятно в каком направлении. А если цена отклоняется в определенном диапазоне, то это значит, что границы этих диапазонов являются линиями поддержки и сопротивления и формируют канал Channel Token.
Channel Token — индикатор в котором период индикатора автоматически рассчитывается по количест

Channel BEAM - индикатор канала и уровней. Если для построения ценового коридора использовать канальный индикатор Channel BEAM, то трейдеру не придется проводить детальный анализ ситуации на рынке. Все расчеты в автоматическом режиме выполнит сам индикатор. Данный инструмент отличается простотой и функциональностью. При его использовании Channel BEAM на графике выстраивается ценовой коридор: Верхняя линия канала — максимальное значение бара за определенное их количество. Нижняя линия канала — м

Индикатор предназначен для скальпинга, преимущественно на младших таймфреймах (например M15, M5) и включает в себя 2 стратегии для торговли во флете и тренде. Тестировался при помощи ручного тестера и советников, выбраны оптимальные настройки. Сигналы входа-выхода образуются на нулевом баре, без задержек. Белые стрелки показывают смену тренда, для входа не используются. Сигналы по 1 стратегии: это красные и синие стрелки в зонах перекупленности и перепроданности. Выход из сделки произвольный

Know Your Risk is a powerful tool that is developed to help traders have better risk management in a very simple way. How? The Know Your Risk indicator has two horizontal lines on the chart, a red horizontal line that represents stop-loss and a green horizontal line that represents take profit. The trader is required to place the lines on the chart at areas of stop-loss and take profit. A panel is presented on the left of the chart that displays the risk in pips/points, risk in percentages, the

It's a DYNAMIC PERIOD indicator which identifies best ENTRY PRICE in the direction of main trend. It's completely non-repaint indicator and very simple to use.
Each arrow has a specific impact value from 1 to 10. Basically there is no important difference between impact numbers. The main point is: A higher impact value means that signal is generated from a bigger swing.
When it draws a Buy arrow on a bottom, It means that we had a Trend, A correction, And now this bottom is a reliable trig

Now manual trading will be fun! This indicator is a high-quality and affordable trading solution. The indicator does not redraw,but works in real time.
It provides a complete off-the-shelf system. The system visually indicates on the chart the beginning of opening positions, their further support and
optimal closing. The indicator also has a notification about trading actions: "VOICE NOTIFICATION", "VISUAL NOTIFICATION", "ALERT" and "PUSH NOTIFICATION". You can either follow the si

Hey! I present to you my trend indicator. The indicator is easy to use There is a special template in the style of all my indicators. In addition to the entry point, the indicator shows the entry level as well as the Stop Loss and Take Profit levels. Also, information about the entry point is duplicated in the push notification. The indicator has an information table in which the current situation on the instrument will be visible. It will also convince you to display information on the trading
Индикатор Trinitron создан для того чтобы отображать тренд в наглядном виде. Одним из главных определений для мониторинга рынка валют является тренд. Тренд - это устойчивое направление движения цены. Для его нахождения индикатор использет расчёты, призванные сглаживать резкие колебания, не влияющие на общую картину движения цены.
Тренд может быть возрастающим (бычий тренд) и убывающий (медвежий тренд). В большинстве случаев тренд растёт долго и резко падает, но во всём бывают исключения. На д

Индикатор - ATR Line определяет текущий тренд и подаёт сигналы на покупку (зелёная стрелка в верх) или на продажу (красная стрелка вниз). Расчёт индикатора основан на отклонении средней цены инструмента от её среднего истинного диапазона- ATR. Для уменьшения "рыночного шума" используется скользящее среднее цен. Если основная линия индикатора - "ATR Line" находится ниже графика цены инструмента, значит на рынке "бычий" тренд. Если основная линия индикатора выше графика цены значит тренд "медве

RSI Entry Points is the upgrade of the standard RSI indicator to avoid lagging. Indicator draws the clouds and the arrows to have clear picture where price is and what to wait for. Why standard RSI is lagging? because mostly we do not use it correctly and it is with very weak visual flexibility, less informative. With my current upgrade I tried to Fix both problems same time and I got much better results and more exact entries than standard RSI has. I Made RSI line Dynamic, it gets more flexible

Hello Seasonal Traders! The seasonality trading strategy works because the smart money is doing the same thing every single year more often than not. The month of the year or the day of the week and the time of the day can call the shots in any market. The seasonal cycle is another useful tool in your trading arsenal. I'm not saying to trade solely off of seasonality and forget anything else. I'm only giving you another trading tool that you can incorporate into your own trading strategy to ga
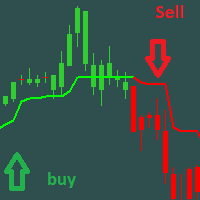
Трендовый индикатор МТ4, дающий точные сигналы для входа в сделки. Работает без перерисовки и запаздываний! Только покупателем данного индикатора прилагается основной фильтр,обращайтесь в личку. Идеальные точки входа в сделки для валют, крипты, металлов, акций, индексов . Наилучшие результаты на таймфрейме M30 и выше!
Наш канал в Telegram | Версия индикатора для MT5 Скоро
видео for indicator Большинство трейдеров улучшают торговые результаты в первую неделю торговли с и

Dream Catcher Pro
This is a Scalping indicator for MetaTrader 4 platform based on Moving average crossover strategy. Dream Catcher Pro is a professional indicator for the MetaTrader 4 terminal. Unlike other Indicators , Dream Catcher Pro provides better signals and is able to identified prolonged trends . the indicator painting arrows and histogram channel that assist you for scalping trading system .
Advantages of the indicator Perfect for scalping. Generates minimum false sign
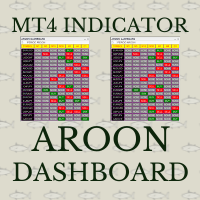
Aroon crossover Dashboard uses the value of Aroon indicator. The Aroon period can be adjusted via the Edit box of this dashboard. The monitoring pairs will be selected by adding to the Market Watch (no need to set prefixes or suffixes) , you can monitor many pairs as you like. This dashboard will check almost popular time frame (M1,M5,M15,M30,H1,H4 and D1). The colors can be customized. The Aroon indicator has been included in to this Dashboard, you do not need purchasing it. Crossover signal c
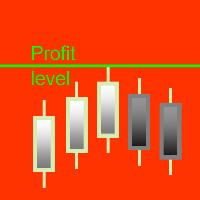
Показывает общий профит/убыток от всех ордеров в окне валютной пары. Индикатор удобен для быстрой проверки стойкости счёта при большом количестве локированых или сеточных позиций. После загрузки на график "Calculation ProfitLoss" строит горизонтальную линию по текущей цене Ask. Если переместить линию мышкой, то на новом уровне индикатор вычислит: сумму прибыли/убытка всех открытых в окне инструмента ордеров. Положительное/отрицательное значение выводится на график над контрольной линией; значени

A top-quality implementation of the famous Zig Zag indicator, which needs no introduction. It is completely coming from original algorithm. After you have this indicator, you will no need any more indicator for opposite direction of trend.
Trading direction of TREND
Very easy to understand and set It implements a multi-timeframe dashboard Buy and Sell signals on same chart Working M5-M15-M30-H1-H4 and D1
After the purchase, please contact me for to learn how to use it.
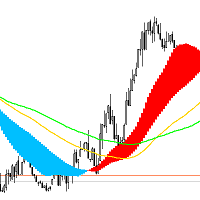
Индикатор направления тренда, также индикатор фиксирует флэтовые участки движения цены.
Описание настроек индикатора: MaPeriod1 - Первый период усреднения для вычисления индикатора. MaPeriod2 - Второй период усреднения для вычисления индикатора. MaMethod - Метод усреднения. Может быть любым из значений перечисления: MODE_SMA - Простое усреднение, MODE_EMA - Экспоненциальное усреднение, MODE_SMMA - Сглаженное усреднение, MODE_LWMA - Линейно-взвешенное усреднение MaPrice - Используемая цена. Мо
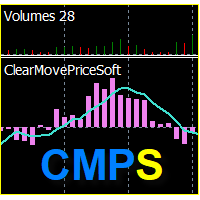
Индикатор "ClearMovePriceSoft" отображает чистоту изменения цены за период расчёта ( "CMP_period" ), и линию само смягчения за количество баров ( "Softing" ). Чем выше значение индикатора, тем чище складываются бары, за приходом тикового объёма.
Входные параметры:
DRAWs =120 - количество баров для отрисовки главной линии индикатора ( "CMP_MAIN" гистограмма); CMP_period =8 - главный период индикатора; Softing =5 - период само смягчения для линии "Softing_average" .
Диапазон варьирования зн
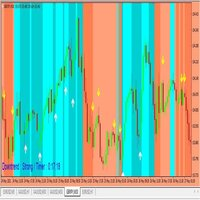
You have to wait the background colors, if the background's RED, you have to wait the yellow arrows to take selling orders. If the background's BLUE, you have to wait the white arrows to take buying orders. When the arrows show out, please wait for the close candles, otherwise it repaints. Please you watch the background colors, if the background's Lighter Red, that means big downtrend signals, if it's Darker Red, you have to be carefull. Because the downtrend can change to uptrend suddenly. if

Индикатор Super Trend TV , выдаёт точные сигналы для входа в сделки. Работает без перерисовки! Super Trend TV - трендовый мультивалютный индикатор, может использоваться на любых финансовых инструментах валюта, криптовалюта, металлы, акции, индексы. Индикатор не перерисовывается и не запаздывает. Рекомендуемый тайм-фрейм M15, M30, H1, H4, D1.
Какие точки входа в сделку являются идеальными? Лучшая точка для входа в сделку – это начало или продолжение движения цена в определенную сторону. В т

This trend following system was designed by Dennis Gartman and Bill Eckhart , and relies on breakouts of historical highs and lows to take and close trades: it is the complete opposite to the "buy low and sell high" approach. This trend following system was taught to a group of average and normal individuals, and almost everyone turned into a profitable trader.
The main rule is "Trade an N-day breakout and take profits when an M-day high or low is breached (N must me above M)" . Exampl

Advanced Ichimoku Toggle Button With Alert Indicator
A Very useful tool that every trader should have in their tool box This Indicator is an unique and high quality tool because it has many useful features. The ichimoku indicator consists of many elements such as kumo cloud,Kijunsen,Tenkansen,chinkou span,Span A and Span B. Different Traders use the ichimoku indicator for different strategies such as cloud breakout strategy, Tenkan kijun cross, chinkou price cross and many more... But for m
GO Multi Oscillator Divergence Entry is a unique divergence indicator that is different from all other divergence indicators on the market. After purchase, leave a review, a comment or make a screenshot of your purchase and contact me to receive for free the Trade Entry Manager utility ! Feel free to check out my other products here : https://www.mql5.com/en/users/gyila.oliver/seller#products
The uniqueness of the indicator consists of two key elements : unlike other divergence indicators, t

Уровни разворота — это хорошо зарекомендовавший себя технический уровень, признанный на каждом рынке. Этот индикатор будет отображать текущие квартальные, месячные, недельные, дневные и четырехчасовые развороты на графике для любого символа. Вы также можете отобразить уровни поддержки и сопротивления для каждого периода и выбрать, какие из уровней 1–4 отображать. Выберите тип Pivot из: Стандарт Камарилья Демарк Вуди Фибоначчи Обратите внимание, что пивоты ДеМарка имеют один уровень поддержки
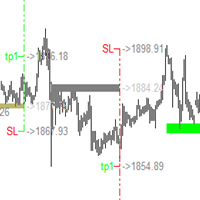
В настоящее время действует полная скидка на покупку! Лучший партнер для любого трейдера! Этот индикатор имеет уникальную программу расчета уровней поддержки и сопротивления, которая представляет собой уникальную торговую систему. Характеристики индекса Представьте, что если вы можете заранее точно определить важные торговые области и точки поддержки и сопротивления, как улучшится ваша торговля? Основываясь на уникальном методе расчета, индикатор анализирует тренд, анализирует те

Smooth Flow is an indicator where it uses a stochastic oscillator. According to the indicator buffer for buying, It crosses above and it has a current timeframe with a 5% K period and a 3% D period. In addition to the timeframe, it is below 20 in value. For the arrow, it's "Arrow Up" with 1 in width and blue with the label "buy" along with a current timeframe and low candlestick value. It has an average true range. As you insert the indicator, there will be blue and red arrows displayed in the

This indicator may or may not be within your interest but I call it Cosmic Dream. When I backtested the indicator, colored level zones appear on your chart. It can work on any currency pair you want. There are 5 level zones. 5 are red and 5 are green. The purpose of this indicator is to let traders see the number of level zones. The interval of the zones is 50 at best. In terms of zone width, the number is 10. It can utilized for any direction. The colors will be visible as long as the indicator

This is a Multi-currency multi-timeframe Support/Resistance Scanner Dashboard for Metatrader 4 (MT4) platform.
Get all extras and download free demo here: https://abiroid.com/product/abiroid-support-resistance-scanner
Read detailed description in post above.
Features: Scan Support/Resistance zones (also called Supply/Demand zones) Show alert when price is inside these zones and highlights the pair/timeframe Show or hide SR zones price nearest to current price (Price_Close) Show or hide cur
Volume-weighted average price
In finance, volume-weighted average price (VWAP) is the ratio of the value traded to total volume traded over a particular time horizon (usually one day). It is a measure of the average price at which a stock is traded over the trading horizon. VWAP is calculated using the following formula: *It is shown second screenshot in the screenshots.
trade that takes place over the defined period of time, excluding cross trades and basket cross trades. for more informatio

Do you like candles? We see candles all the time in the forex market don't we? Candlesticks MA is a moving average indicator that can work on any timeframe. This indicator has been backtested and has the ability to let you see additional candlesticks. There are purple and red candlesticks. The value for the moving average period is 5. It is used for observing the moving average flow pattern of the forex market. It's usable for any currency pair you invest in. It is also good for any MA you use.
Price Action Indicator gives you reverse or even continous trend signals depending on your timeframe and Strategy used. !!!This is not a holy grail indicator and it will not give 100% winning rate!!! As you can see, it is not giving a lot of signals because of the price movements in side way (flat) trend. You can use it on every major currency pairs and even on indices. Please be aware of using this indicator with other strategies and indicators. Use MM and Risk Management properly. Sometimes

A resistance level is the opposite of a support level. It is where the price tends to find resistance as it rises. Again, this means that the price is more likely to "bounce" off this level rather than break through it. However, once the price has breached this level, by an amount exceeding some noise, it is likely to continue rising until meeting another resistance level. A support level is a level where the price tends to find support as it falls. This means that the price is more likely to "b
Привет, ребята,
Для того чтобы безопасно торговать на Форекс, все, что вам нужно, - это индикатор "профессиональная внутридневная торговля".
Индикатор декабря определяет точки "Безопасной покупки/продажи", анализируя "самое низкое и самое высокое значение дня" этого инструмента в установленные вами временные интервалы, и мгновенно выдает вам "целевой канал декабрь" на живом графике.
Он предлагает Купить 1 декабря Купить 2 канала (2 зоны покупки с синей линией) в качестве безопасных то

Сканер Heiken Ashi на четырех таймфреймах. Индикатор не рисует и не подсматривает историю. Модифицированный расчет повышает чувствительность! Возможно отключить модифицированный расчет для каждого таймфрейма отдельно, а также отключить анализ 4 таймфрейма. В нулевом (скрытом) буфере хранится информация о совпадении трендов на всех рабочих ТФ. Эта опция упрощает анализ и чтение из советников.
Требователен к истории. Наиболее простое отсутствие данных по старшим ТФ проверяется при загрузке. Осно

Индикатор "VSA on the FLY" предназначен для быстрого отображения различных параметров Volume Profile / Market Profile . Исходные данные для работы индикатор берет из минутного таймфрейма. Индикатор устанавливается на
любой таймфрейм и начинает отображать данные начиная от выбранной левой границы. Этой границей может быть
начало дня, недели, торговой сессии, любого часа и т.д.
Версия данного индикатора для MetaTrader 5 находится здесь .
Доступны следующие входные параметры: Show VWAP . Отоб

Currency Weight FX ( CW8) You are going to see the Forex Treasure If you think in Forex Trading you are dealing with one chart only, then you are on your way to be plunged into misery. The weight of one's currency will affect other currency or currencies. This Currency Weight FX is a breakthrough in trading tools
With Currency Weight FX ( CW8 ) indicator you will see each weight of major currency. This currency WEIGHT is very much different from currency STRENGTH most people usually mean.

The AutoTarget Indicator For MT4 is an indicator that is built for the traders that work with the Meta Trader 4 charting platform during their trading day and it is built for a singular reason which is to help the Trader using it to predict the next price target on the current timeframe or currency pair that the trader attaches it to. It works across all currency pairs and trading platforms and can help a seasoned trader by reducing the amount of technical analysis he or she has to do every day
MAs Crossover Dashboard Pro uses the value of Moving Average indicator. The periods of 2 MAs can be adjusted via the Edit boxes of this dashboard. The monitoring pairs will be selected by adding to the Market Watch (no need to set prefixes or suffixes) , you can monitor many pairs as you like. This dashboard will check almost popular time frame (M1,M5,M15,M30,H1,H4 and D1). The colors can be customized. The parameter of MAs can be set at the input. Crossover signal can be sent to you screen, yo
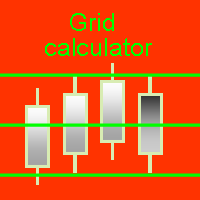
Графический калькулятор для быстрого расчёта сеток ордеров или стратегий усреднения. Показывает объёмы ордеров по уровням, коэффициент мартингейла, шаг сетки, просадку каждого ордера и всей сетки, уровень безубытка ( Loss = 0) . Чтобы программа выполнила расчёты достаточно натянуть сетку на график, перетащив мышкой начальный ( Level 1) или контрольный (Level control) уровни. Параметры по умолчанию можно изменить через окно настроек. Оно появляется при первой загрузке Grid calculator либо п

Индикатор отображает показания RSI со старшего таймфрейма (ТФ) на младшем. Не перерисовывает начиная с 1 бара. Не подсматривает в будущее на истории на старшем ТФ. Индикатор отличается симметричной шкалой относительно 0. Для получения значений стандартного добавьте к показаниям 50.0. Может отображать показания текущего ТФ. Требователен к истории текущего и старшего ТФ. Параметры: RSI TimeFrame - рабочий таймфрейм (должен быть равен или больше текущего иначе ошибка инициализации) RSI Period - пер

Здравствуйте! Надоело постоянно подписываться на чужие сигналы и зарабатывать копейки? Хочешь сам управлять своей торговлей? Значит ты на правильной странице! Всё очень просто ==> покупаешь мой индикатор ==> ставишь на график ==> синяя стрелочка - заходишь в покупку ==> красная стрелочка - заходишь в продажу. Справится даже младенец! Удобная гистограмма для отслеживания направления движения рынка. Ты все еще тут? Тогда прочитай описание параметров и посмотри скриншоты: Stoch K period -

Не перерисовывает в любом режиме. Не подсматривает в будущее на истории.
Изменена формула для повышения чувствительности (отключается в настройках). Работает на текущем таймфрейме или старших с отображением на текущем. Для советников добавлен невидимый буфер с текущим трендом. Настройки: TimeFrame - рабочий таймфрейм. Включение и отключение режимов построения (ускорения ) индикатора. Цвета и толщину линий можно изменить в стандартной закладке настроек индикатора. Критичным является состояние и

Индикатор разработан для отображения показаний индикатора Stohastic со старшего таймфрейма (ТФ) на младшем. Индикатор отличается симметричной шкалой. Для получения значений стандартного добавьте к показаниям 50.0. Не подсматривает в будущее на истории и не перерисовывает Может отображать показания текущего ТФ. Параметры: Timeframe - рабочий таймфрейм (должен быть равен или больше текущего иначе ошибка инициализации) Price Type - тип цены для расчета High/Low или Close/Close K Period - K период S

Tom DeMark developed TD Sequential by hand, through a process of trial and error, in the 1970s. It never ceases to amaze me how something originally created to analyze daily price data can be applied so effectively, more than thirty years later, to any time frame—from one minute to one year—and to any market. The indicator has two components: TD Setup, which relies on momentum to define price ranges, and TD Countdown, which is trend based, and looks for low-risk opportunities to fade establishe

Graphing calculator for quick calculation of order grids or averaging strategies. This is an improved English version of the "Grid calculator" program, which shows order volumes by level (lot), martingale ratio (MG), grid step (step), drawdown of each order and the entire grid, breakeven level (Line Breakeven). For the program to perform calculations, it is enough to pull the grid onto the chart by dragging the initial (Level 1) or control (Control line) levels with the mouse. The default param

Woodies CCI is a momentum indicator that was developed by Ken Woods. It's based on a 14 period Commodity Channel Index (CCI) . It's a fully unbounded oscillator with a base value of 0 and has no lower or upper limit. Some traders use the indicator to spot a number of tradable CCI patterns both with and against the trend, such as the zero line reject, the reverse divergence and the trendline break. The 200 level signals an extreme reading. The indicator is often used in combination with other sig
Scalper Signals Trader
Best and simple Indicator for clear and safe entry and exits. Predefines- multiple targets and stop loss, as per risk reward ratios Signals can be set – based on aggressive or safe algorithm Aggressive entries are also profitable but are raw signals without checking the higher time frame trends Safe entry meanwhile will check if the lower and the higher time frame are both in same direction, thereby having lesser trade entries and more quality. The very robust macd le

Smart Multi Systems
21 STRATEGIES IN 1
INPUT
FileComment = "";- trade log file EntryOnly = false;- "TRUE"- SIGNAL TO SIGNAL MODE Can Exit by Opposite Signal = false; IndicatorAlerts = false;- EntryAlerts = true; ExitAlerts = true; Reentry=false( ENABLE reentries) ENTRY SETTING PARAMETERS EntryStyle = EP-SIG+Rev Alert ( 21strategies ) ExitStyle = Rev Alert ( 8 EXITS strategies )
ENTRY and EXIT SETTINGS ===== KPeriod = 100; DPeriod = 12; Slowing = 3; method = 0; price = 0;
This indicator: 1. Does not provide any signal for trading. 2. Shows chart symbol and timeframe more visible. 3. Shows spread in digit format. 4. Shows the value of each point of current symbol per one lot. 5. Changes the symbol of current chart by one click. 6. It is useful for someone who wants to analyze different symbols on one chart. by clicking on the desired symbol name at left side, indicator draws it fast.
By using of this indicator, you can easily set two alerts for each timeframe of each instrument. This is how it works: 1. Add the indicator to the chart. 2. Click on "New Alert" button. 3. Drag the drawn rectangle to your desired price. 4. Then click on "Add" button to active the alert. You can do the same for the second alert. Please: Keep in mind that for each rectangle only the side of the rectangle that is close to the price is important. For a different instrument, drag it from the market
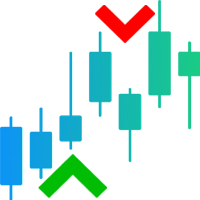
The Price Action Alert Indicator MT4 is a custom indicator made for the traders which help the traders to distinguish the price ticks that make the market price action understood. This indicator utilizes bearish or bullish signs at its cost rates. This Price Action Strategy gives open doors for different examples in elements that are undetectable to the unaided eye. This indicator is exceptionally intended for Meta trader 4 .
You can undoubtedly make benefits by understanding this indicato
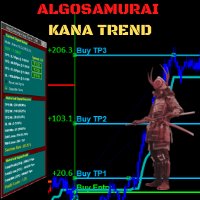
Cutting-edge solution for Trend Trading with statistically robust signals! Kana Trend’s smart algorithm detects the trend on any instrument, any timeframe, and gives powerful entry signals with exit levels. Its advanced statistics gives you deep insight as to success and profitability of its signals -- while being fully transparent on any potential for loss. Because this is an indicator, not an EA, you cannot see it in action in visual tester if you download the Free Demo. Instead, please down
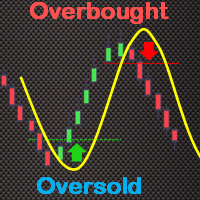
The True Oversold Overbought indicator provides you with ability to swiftly check whether the asset is oversold or overbought. Other than complementing your trading with True Oversold Overbought, you can use the indicator as your only trading system. It works with all forex instruments and will save you the headache of estimating when the market is due for a reversal or retracement. When the "Super Charge" feature is enabled, the areas where the price is in oversold/overbought status are ampl

Трендовый индикатор МТ4 с вероятностью достижения прибыли 70-90%! Работает без перерисовки и запаздываний. Индикатор показывает хорошие результаты на всех торговых инструментах: валюты, металлы, индексы, акции, криптовалюты. Рекомендуемый таймфрейм: H1-H4.
Подробная информация об индикаторе здесь : https://www.mql5.com/ru/blogs/post/744634
Рекомендации по использованию
Используйте автоматическое определение периода Главной особенностью индикатора является функция самооптимизации

Средний истинный диапазон (ATR) - это широко используемый индикатор, который измеряет величину движения цены в течение установленного времени. Однако значение, которое он дает, не определено в рамках каких-либо границ, что делает использование его для чего-либо, кроме расчета стоп-лосса или тейк-профита, практически невозможно.
Этот индикатор является вашим стандартным индикатором ATR, но мы ввели разграничения процентилей, чтобы вы могли видеть крайние значения.
Вы можете выбирать между пр
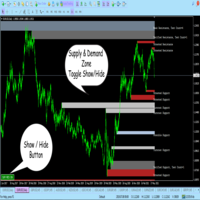
T oggle button to hide and show
In Price action Trading Support and resistance takes a important Part. But it is always a difficult job for traders to draw the supply and demand zones on their chart. Even if it is drawn the chart looks annoying if other indicator is used in congestion. So This indicator is made to draw support and resistance lines automatically and more importantly have the toggle button to hide and show those lines. Moreover it can show week zones strong zone and turncoat
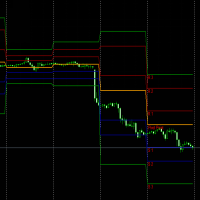
Instructions:
1. Pivot has an attractive effect. In the absence of large longs or shorts entering the market, the price moves around the axis between r1 and s1, but the movement may be irregular. Someone specializes in trading in this range, called floor trader.
2. Under the strong push of longs or shorts, the price will break through the s1-r1 area, and there will be a trend at this time, but it is still within the normal price movement range. Within this range, there will be a strong sens
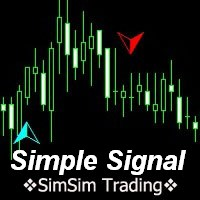
MT4 trend indicator works without redrawing. Provides signals for entering trades, works on charts of any instrument. Трендовый индикатор МТ4, работает без перерисовки. Выдает сигналы для входа в сделки, работает на графиках любого инструмента. Input parameters are for styling and messages only. / Входные параметры только для оформления и сообщений. All original signal calculations do not need additional parameters. / Все оригинальные расчеты сигнала, не нуждаются в дополнительных параметрах.
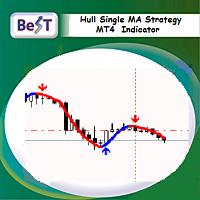
BeST_Hull Single MA Strategy is an Metatrader Indicator based on the famous indicator Hull Mov.Average . This indicator can display the Single HMA Strategy of just 1 Hull MAvg. It uses added internal filters locating the most likely Entries while it can be used as a standalone system or as an add-on to other ones.
Generally the Hull Moving Average (HMA - developed by Alan Hull) is a directional trend indicator . It captures the current state of the market and uses recent price action to determi

FUNDING DEVIL INDICATOR has been developed by traders for traders and is not another combination out of existing indicators or a "magic, solve all situations" tool.
PASS THE FUNDED ACCOUNTS WITH IT.
It is the answer for beginners and experienced traders about the misleading concepts of the mainstream, causing 90% of retail traders, never making a living out of trading.
Successful traders are "following the smart money" and do NOT try to catch every move from start to end. Consistent trade

Hypershot is a channel indicator that has the ability to do a commodity channel index. It is designed for short-term trading. This indicator can activate with the range of -150 and 150 in terms of value. The solid width for the histogram is 2. After backtesting it with currency pairs EURUSD, GBPUSD, USDCHF, and USDJPY, the histogram shows blue when the candlesticks go up and purple when they go down. Please invest at your own risk as this indicator does not promise any satisfactory results. With

Track Trend Triumph is a moving average indicator that allows you see candlesticks in multiple colors. It lets you see a trend in both short term and long term trading. Focus is the input of the indicator with the value of 5 and Focus 2 is the other input with 40 as it's value. This indicator is for anyone who enjoys moving average movement. It is set for current but can be use for all timeframes. When I backtested the product with currency pairs USDCAD, AUDUSD, GBPUSD,and EURUSD, it shows a div

Тренд позволяет прогнозировать движение цены и определять основные направления заключения сделок. Построение трендовых линий возможно различными методами, подходящими под стиль торговли трейдера. Этот индикатор рассчитывает параметры трендового движения на основе распределения фон Мизеса. Использование этого распределения дает возможность получить устойчивые значения уравнения тренда. Кроме расчета тренда, также рассчитываются уровни возможных отклонений вверх и вниз. Индикатор обновляет свои

Double Smoothed Price Momentum Oscillator
The Momentum Oscillator measures the amount that a security’s price has changed over a given period of time. The Momentum Oscillator is the current price divided by the price of a previous period, and the quotient is multiplied by 100. The result is an indicator that oscillates around 100. Values less than 100 indicate negative momentum, or decreasing price, and vice versa. Double Smoothed Price Momentum Oscillator examines the price changes in the dete
А знаете ли вы, почему MetaTrader Market - лучшее место для продажи торговых стратегий и технических индикаторов? Разработчику у нас не нужно тратить время и силы на рекламу, защиту программ и расчеты с покупателями. Всё это уже сделано.
Вы упускаете торговые возможности:
- Бесплатные приложения для трейдинга
- 8 000+ сигналов для копирования
- Экономические новости для анализа финансовых рынков
Регистрация
Вход
Если у вас нет учетной записи, зарегистрируйтесь
Для авторизации и пользования сайтом MQL5.com необходимо разрешить использование файлов Сookie.
Пожалуйста, включите в вашем браузере данную настройку, иначе вы не сможете авторизоваться.