PrimeTools Levels
- Indicadores
- Denis Glaz
- Versão: 1.1
- Atualizado: 3 outubro 2022
- Ativações: 10
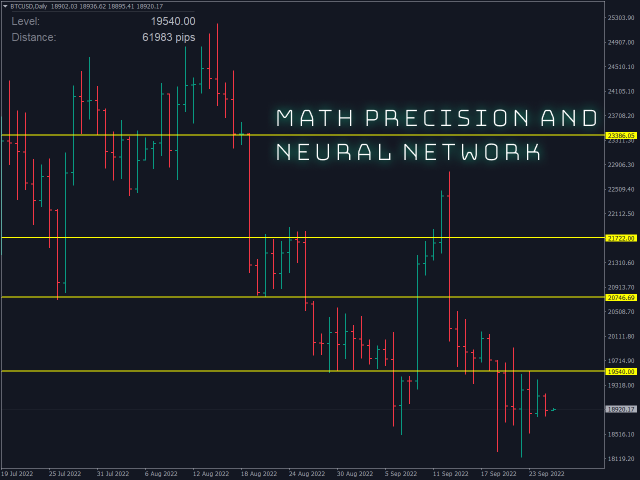
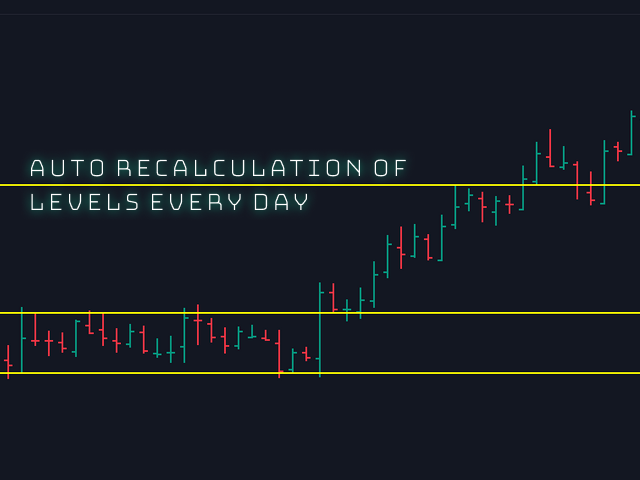
Levels indicator. It works on a neural network and is formalized according to professional rules for building horizontal levels. The indicator redraws the levels every day and notifies you when the price approaches or cross the levels. The indicator is suitable for both professionals and beginners who have only recently begun to learn how to trade in the market.
PrimeTools is a series of products designed for correct and professional trading.
[PrimeTools Levels | PrimeTools Range]
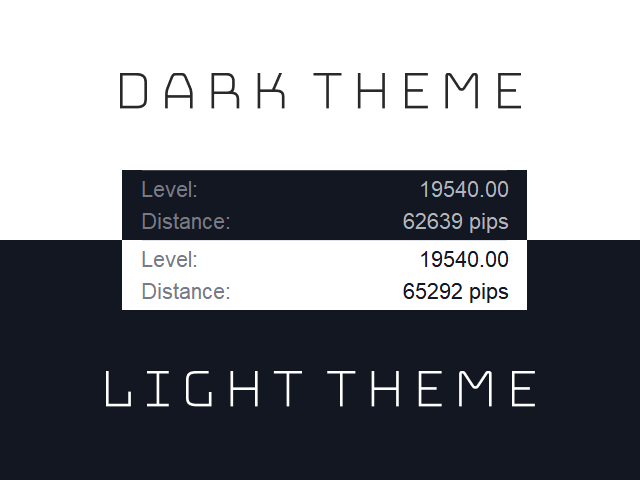
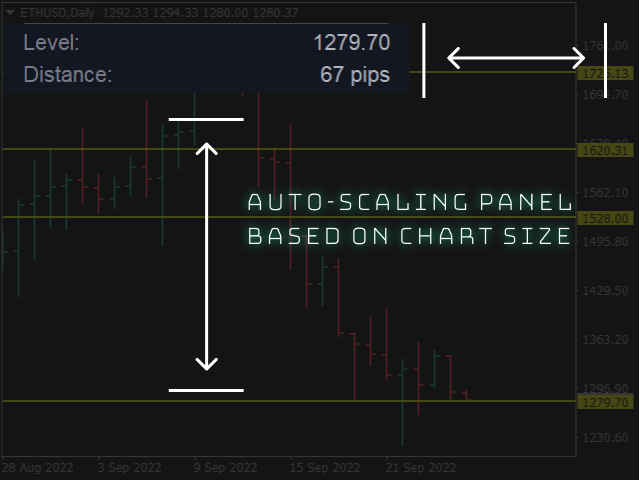
Panel
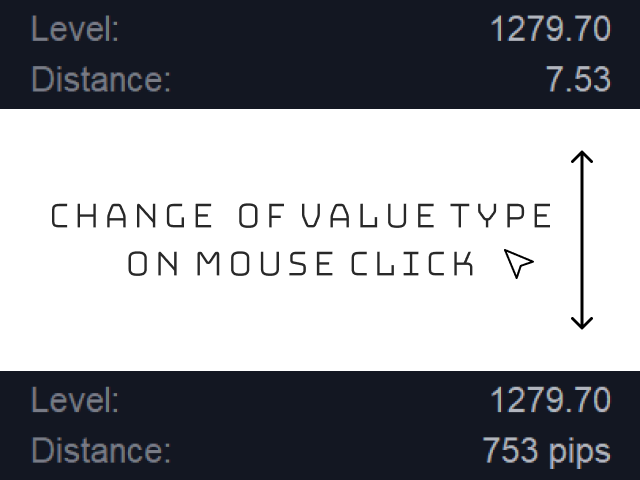
- Shows the nearest level and distance to it.
- Change the type of distance value on mouse click.
- Dark and light themes and 3 scales.
- Scaling is adaptive to the chart size.
About levels calculating
- Stop a huge price movement.
- Accumulation near the level.
- Touches and intersections.
- High and low of paranormal bars and gaps.
- False breaks.
- Historical levels and price extremums.
- Round prices.
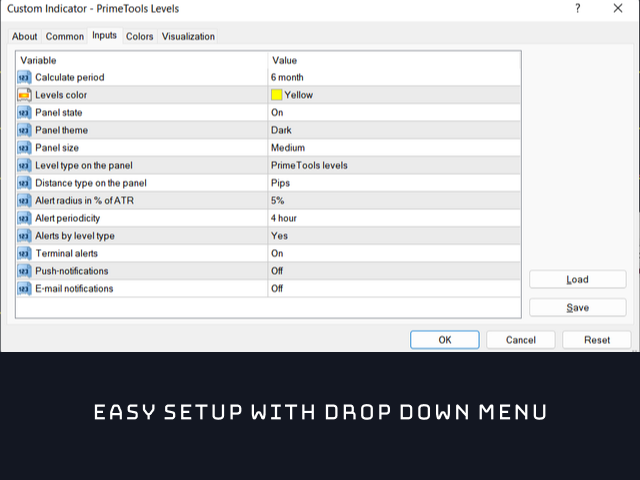
Input parameters
- Calculate period - chart period for calculating levels.
- Levels color - levels color.
- Panel state - enable or disable the panel.
- Panel theme - dark or light panel theme.
- Panel size - panel size.
- Level type on the panel - calculate values for all levels on the chart or only for indicator ones.
- Distance type on the panel - choose type of the distance in pips or absolute;
- Alert radius in % ATR - price alert trigger distance, expressed as a percentage of ATR;
- Alert periodicity - frequency of notifications;
- Level type for alerts - notifications for all levels or only for indicator ones;
- Terminal alerts - alerts to the terminal;
- Push-notifications - notifications in the mobile application;
- E-mail notifications - notifications by e-mail.