FabFlowInPrice
- Indicadores
- Fabiano Luiz Roberto
- Versão: 1.2
- Atualizado: 20 julho 2022
- Ativações: 5
Tape Reading, monitoramento de fluxo.
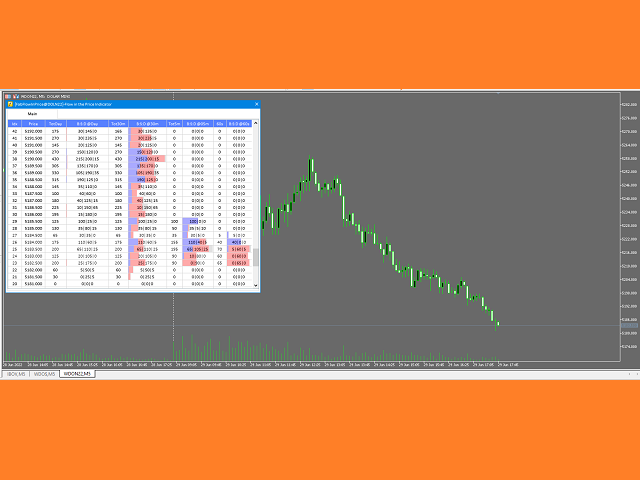
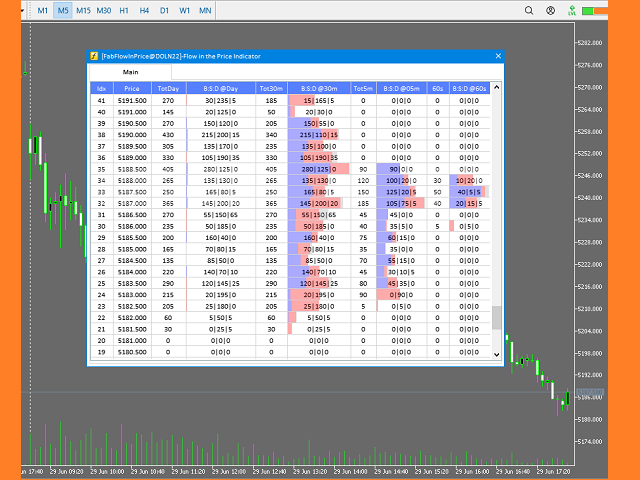
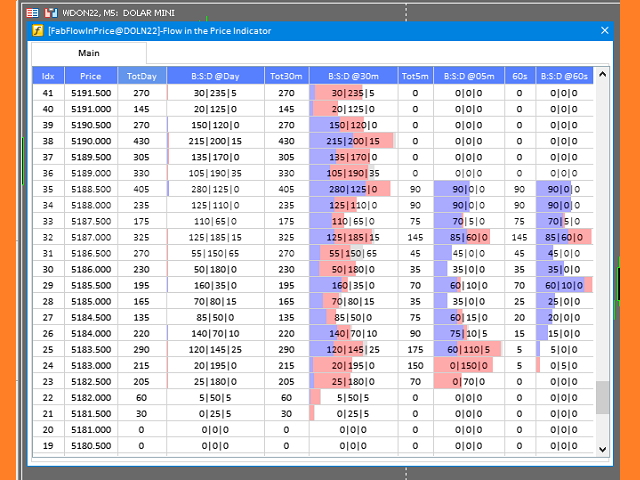
FabFlowInPrice é um poderoso indicador para quem gosta de Tape Reading (Times & Trades).
Ele apresenta os volumes negociados em cada nível de preço, considerando para cada nível as agressões de compra, de venda e dos diretos.
Excelente ferramenta para análise do fluxo de mercado. Pensou em fluxo então monitore quem está agredindo mais, compradores, vendedores ou trocas diretas.
O indicador apresenta as informações em 4 períodos distintos e fixos, em qualquer tempo gráfico. Sendo:
- @Day - Todos os negócios realizados no dia
- @30m - Os negócios realizados nos últimos 30 minutos
- @05m - Os negócios realizados nos últimos 05 minutos
- @60s - Os negócios realizados nos últimos 60 segundos (*)
DESTAQUES:
1) O Indicador pode trabalhar com referência cruzada. Como exemplo na BM&F você poderá 'tradear' no 'mini-dolar' e ter o indicador mostrando o fluxo do 'dólar' cheio.
2) O indicador está apto a QUALQUER tempo gráfico.
3) Caso deseje testar uma versão Demo poderá usar o 'Testador de Estratégias' no modo "Every Tick". Mesmo que sua corretora não disponibilize os dados de histórico reais para os testes, o Metatrader utiliza um algoritmo sintético que faz uma emulação de cada candle. Como sugestão de teste, defina um dia que houve negócio com o símbolo desejado e utilize o tempo gráfico de 5 minutos. Lembrando que o algoritmo foi desenhado para Tape Reading, então teste-o em dias diferentes e em tempos gráficos diferentes para entender seu funcionamento antes de adquiri-lo.
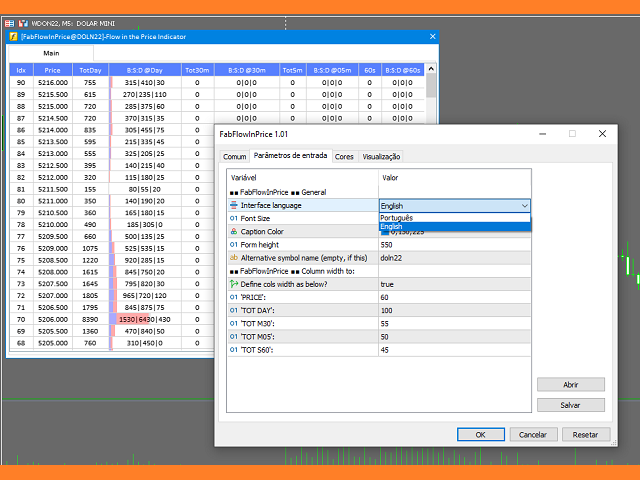
Parâmetros de Entrada
General
- Interface Language: Idioma (Inglês / Português).
- Font Size: Tamanho da fonte, possibilita otimizar conforme seu monitor e sua placa de vídeo.
- Caption Color: Cor da barra de título
- Form height: Altura da janela gráfica a ser criada
- Alternative symbol name: Nome do símbolo alternativo que deseja monitorar. Somente em caso de referência cruzada.
Column width to:
- Define cols width as below: Habilita alterar as larguras das colunas para melhorar o aspecto visual da exibição de forma a ir de acordo com os atributos do respectivo símbolo.
- PRICE / TOTDAY / TOT M30 / TOT M05 / TOT S60: largura das colunas, caso esteja em 'true' a habilitação acima.
IMPORTANTE
- O indicador utiliza a função CopyTicks e CopyTicksRange para acessar o Times & Trades, verifique com a sua corretora a disponibilidade destes dados.
- O Metatrader sincronizará as informações em até 45 segundos da partida, portanto tenha em mente a necessidade de aguardar este tempo na primeira vez que iniciar o indicador.
O meu não tá rodando tá congelando tudo