ImbaTrend Runner Indicator
- Indicadores
- Ekaterina Saltykova
- Versão: 3.20
- Atualizado: 22 setembro 2022
- Ativações: 5
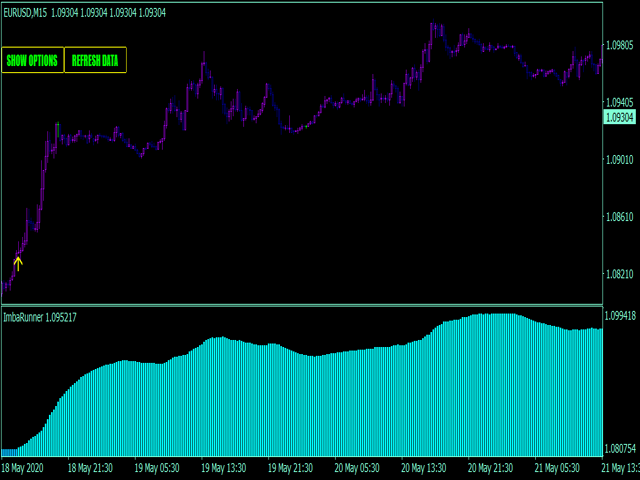
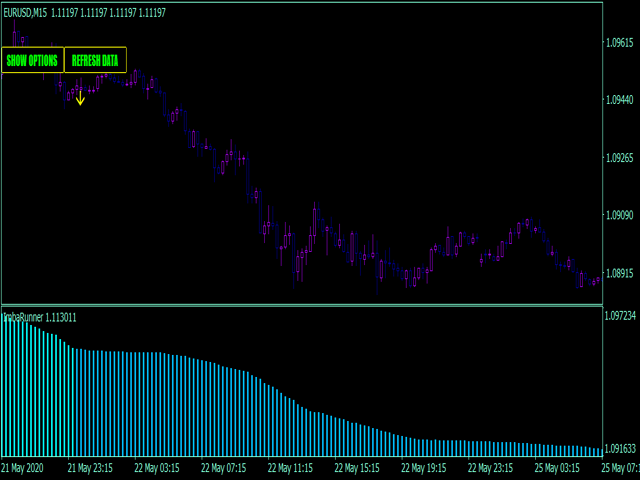
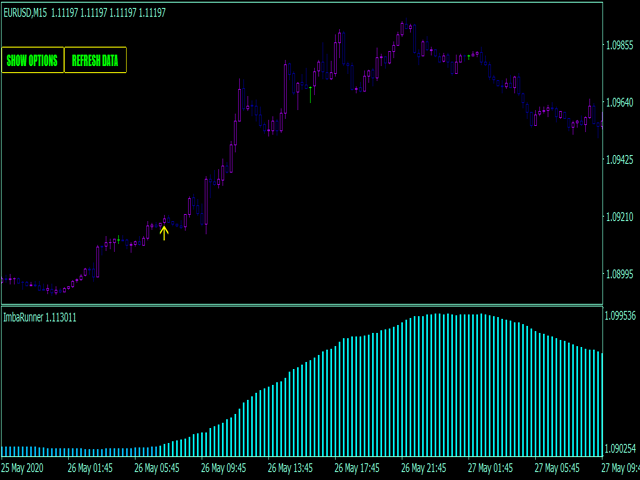
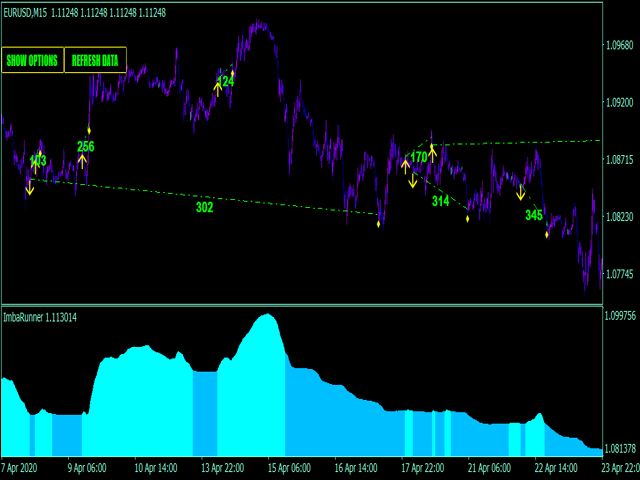
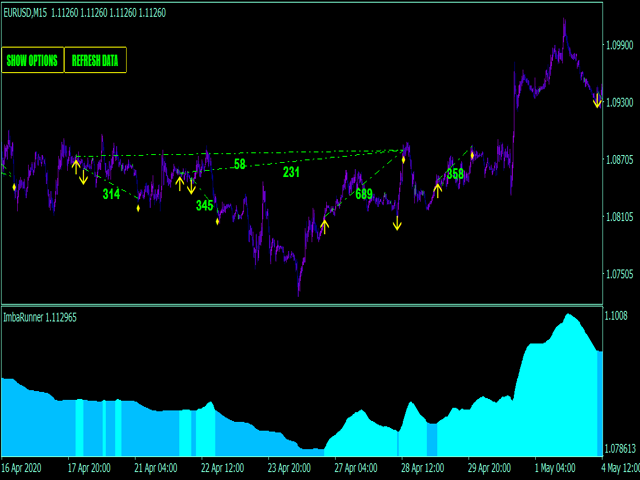
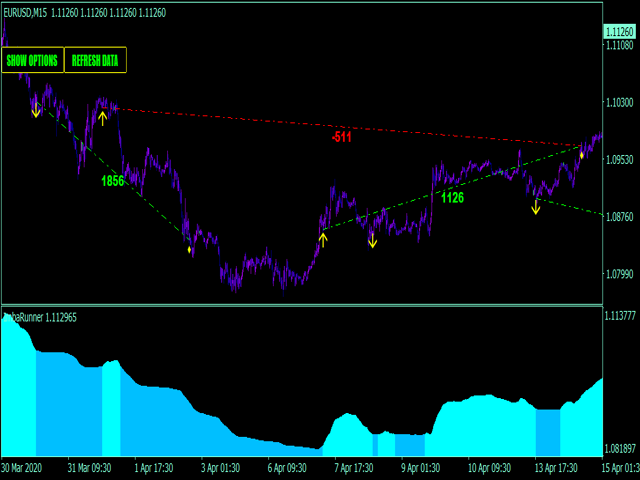
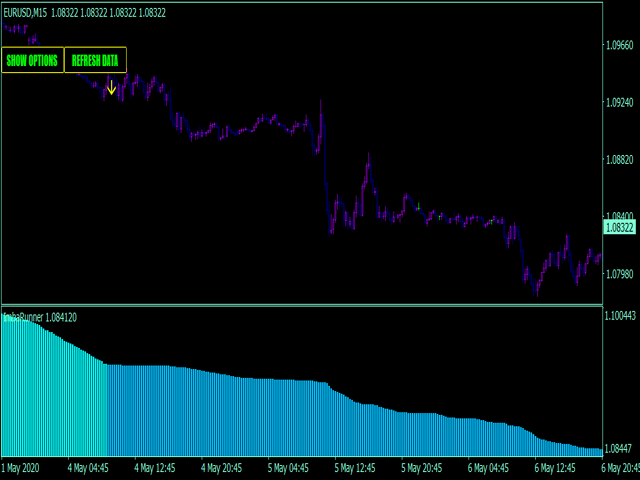
ImbaTrend Runner - is the trend following manual system for forex/crypto market. It defines medium-term trends and works with it in intraday mode. System shows enter points, profit and loss targets. As a rule profit targets are 2-3 X bigger than loss targets. Indicator is AutoAdaptive and it automatically updates it's settings during trading. Indicator is sensitive to market changes, regular updates helps to stay in relevant trend.
Main Indicator's Features
- Signals are not repaint, late or disappear;
- Every signal comes at the open of new bar(system uses only confirmed signals);
- Indicator has Alerts, Mail and Push notifications(allow to trade out of PC, from smartphone/mobile app);
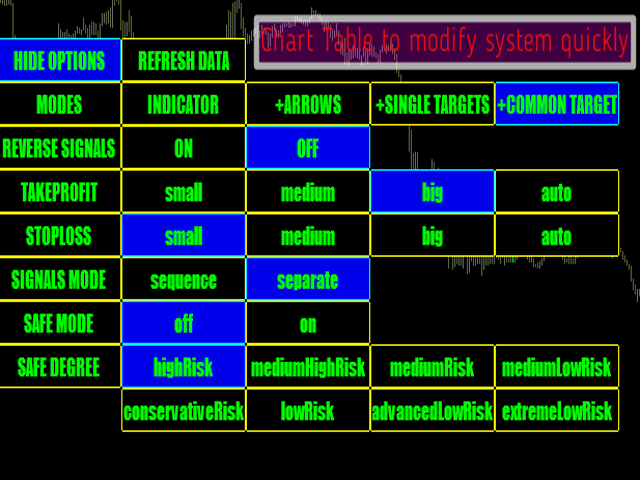
Recommendations for trading
- Any timeframes you want;
- It can trade on all forex pairs, stocks and crypto;