• Visão global
  • Comentários
  • Discussão

AIS Bessel Filter

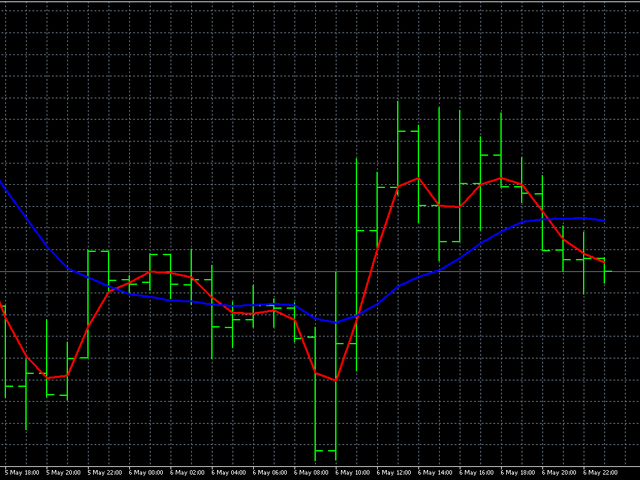
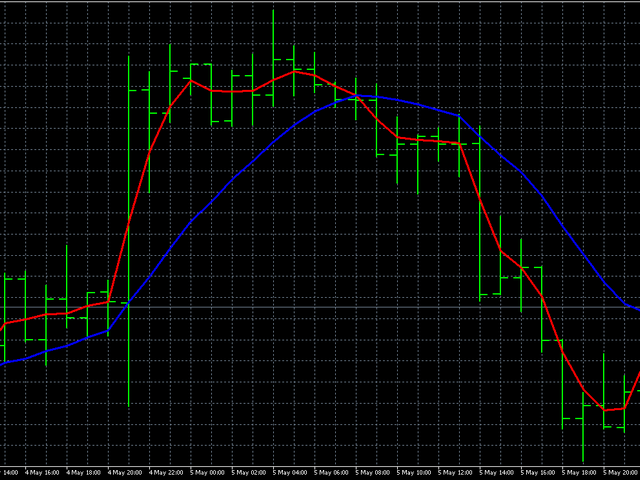
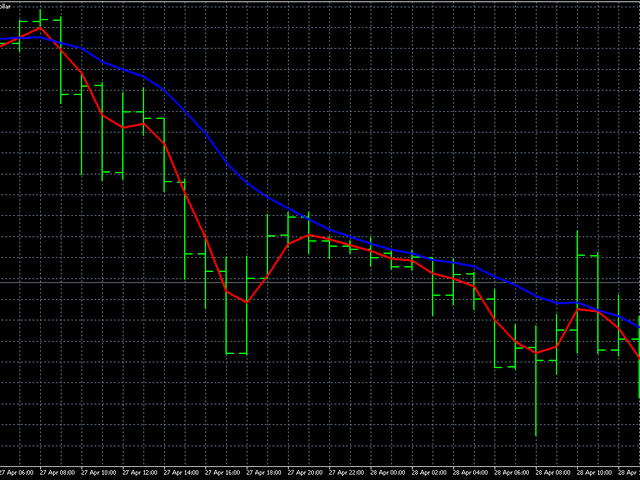
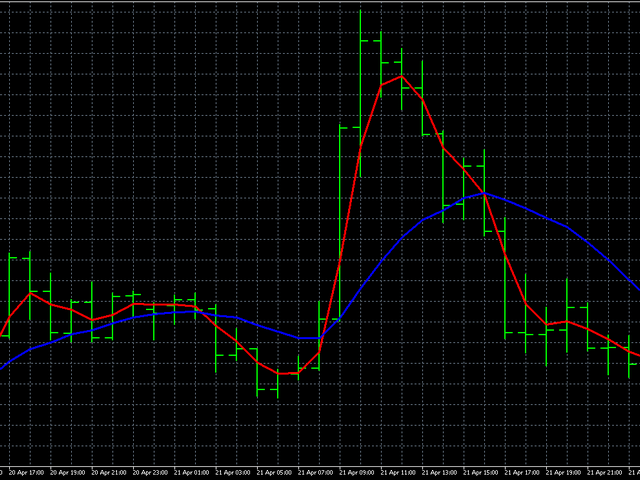
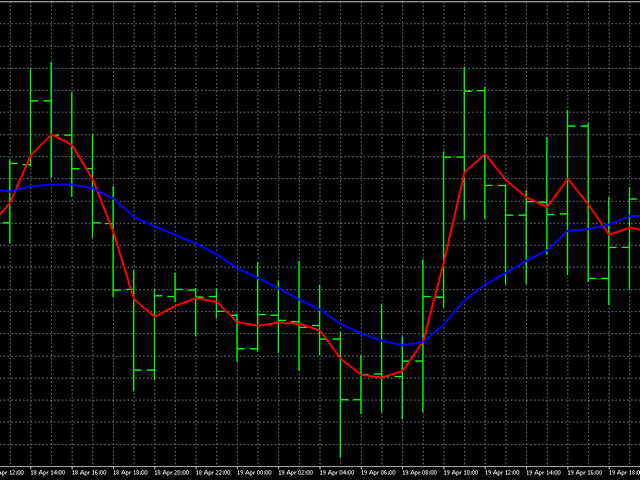
Este filtro é baseado em polinômios de Bessel. Sua principal vantagem é um pequeno atraso de tempo. Outra característica desse filtro é sua alta sensibilidade aos valores mais recentes da série temporal financeira. Por causa disso, o indicador destaca os movimentos de preços ativos, enquanto suaviza os desvios de ruído.
Além da variante clássica, os logaritmos dos coeficientes de Bessel foram adicionados ao indicador como função de ponderação. Nesse caso, o indicador acaba sendo mais suave, mas ao mesmo tempo pode atrasar quando o preço se move ativamente.
Ao calcular polinômios de Bessel, são usados ​​fatoriais. Por esse motivo, o período do indicador é limitado de baixo para cima. Ao usar um filtro Bessel normal, é melhor prestar atenção aos pequenos períodos do indicador. Já que com o aumento no período, o comportamento do indicador fica cada vez mais estável, e a diferença se torna cada vez menos perceptível.
As figuras mostram o comportamento de ambos os tipos de filtro.
Parâmetros do indicador:
  • TypeFilter - Seleção do tipo de filtro normal/logarítmico
  • iPeriod - período do indicador, valor válido 3 - 85.
Produtos recomendados
ROC acceleration-deceleration is the manual system for medium-term scalping. Indicator based on custom ROC system which defines bullish/bearish market and especially  acceleration-deceleration of tendention in the market's main direction. Buy arrow is plotted during bearish market when current trend decelerates and sell  arrow is plotted during bullish market when current trend decelerates. Main Indicator's Features Signals are not repaint,non-late or disappear(exept cases when system recalculat
This product shows you a different view of the market by examining the performance of volume and continuous patterns in the market, then by calculating the behavior of traders and market patterns, calculates the probability of the next movement of the market by calculations. Function. How to receive the signal: If the candlestick is currently a bullish candlestick, according to a market scan, if the next bullish candlestick is below 5%, you can open a free trade by hitting the wisdom areas.
This indicator was developed to facilitate the analysis of BBMA Oma Ally strategy  In the previous version, it's almost similar scanner indicator was built the indicator identifies the basic pattern of BBMA Oma Ally (reentry, MHV, rejection EMA50 and extreme) To get information on the chart, please download the BBMA Labels indicator via this link In BBMA Oma Ally advanced strategy, to validate reentry on a major timeframe, a "full setup" is required on a lower timeframe The full setup structu
FREE
PX Trend
Vitalii Zakharuk
PX Trend is a technical indicator that mathematically transforms the price of a currency pair in the form of signaling arrows on the chart, it is used to predict the direction of the market movement. This tool is basic for the interpretation of the parameters of the graphs in technical analysis. PX Trend refers to an arrow indicator Forex - a tool that gives unambiguous signals to buy or sell currencies using arrows. An arrow directed upwards recommends buying, downward - selling. The indicat
MT4 Sync Tools
Mohammad Reza Anari
Supercharge Your MetaTrader Analysis and Trading with Meta Sync Tools! Struggling to analyze price action across different timeframes? Meta Sync Tools eliminates the frustration of unsynced crosshairs and charts, allowing seamless multi-timeframe analysis. Missing key correlations between assets and constantly switching between charts? Meta Sync Tools empowers you to visualize relationships between instruments effortlessly.  Tired of wasting time on repetitive tasks? With 30+ Customizable Short
Implement
Vitalii Zakharuk
5 (1)
Implement analyzes market dynamics for pivot points. If you want to learn how to spot the correct reversals for consistently likely profitable trading, buy this indicator. Shows favorable moments of entering the market in stripes. Ready-made trading system. The principle of operation of the indicator is to automatically determine the current state of the market when placed on a chart, analyze historical data based on historical data and display instructions for further actions on the trader's
Market Profile
Artem Titarenko
5 (1)
The "Market Profile" indicator displays the profiles and volumes of periods – weekly, daily, session (8-hour), 4-hour, hour, summary. The VAH/VAL price area is automatically highlighted by a dotted line for each profile (except for the summary). The indicator includes chroma Delta, which colors the profile areas. The areas of prevailing Buys is colored in green, that of Sells - in red. The intensity histogram features blue/red respectively. In the filter mode, the indicator displays the volume a
Bank Expert
James D Blanks
Bank Expert Indicator Uses A Simple method of tracking price as it moves across the chart and signals when a potential long or short position is active and indicates this to the trader giving you the opportunity to take a position on the market. Or you can simply use this indicator to give yourself signals and determine if you want to take the trade or learn the strategy on your own. The Signals From this indicator are targeted at long-term positions and focus on top quality call outs. 
Market Pressure is a next-generation display. Its simple and intuitive graphics system allows you to receive directions very easy and fast. This indicator can give three different methods of signals: Scalping, Intraday and Multiday. The logic is based on the price action which combined on multiple time frame. It can give very high quality signals. An indispensable tool for those who want to understand the market pressure and the operating trend. The indicator is customizable for both colors for
This system never paints.   This system created by using Envolpes bands and reverse bar count.   This indicator is only working in M5 period.   This system is for long term and profitable.   Signals are shown as arrows. as an optional limit orders.   You can set a voice alarm or email notification.   You can fins our other products from link : https://www.mql5.com/en/users/drbastem/seller   Also, you can ask all your questins from email : haskayafx@gmail.com or mobile : +90 530 867 5076 or @Meh
1.Determine the trend size based on the chart cycle.   An uptrend near the highest price in a period of time.   A trend down near the lowest price in a period of time. 2.   short-term trends.   Oversold and long;   Overbought, short. 3. Unwind positions based on overbought and oversold and profit points. real-time signal: https://www.mql5.com/zh/signals/1538661?source=Site+Signals+My EA Settings: You need to load EA into the currency pair to trade (M15 time range). The best performing symbol : E
Excellent Tool Time Frame : Daily, Weekly, Monthly and Yearly High, Low, Range and Fibo value Sort Mode : Sort Based On Range, Sort Based On Fibo, Disabled Sort Direction : Largest to Smallest, Smallest to Largest Alert : Fibo and Range 28 Basiccurrency pairs with the possibility of changing to any other symbol At any time you have an overall overview of the monitored markets
KFX Trade Manager
Joe Christopher Ramirez
Introducing the "KFX Trade Manager" expert advisor for MetaTrader 4 (MT4), a comprehensive solution for advanced trade management and risk control. This powerful tool is designed to enhance your trading experience by automating various aspects of order handling, profit optimization, and alert notifications. With the "KFX Trade Manager," you can take your trading to the next level and streamline your operations for improved efficiency and better risk management. Key Features: Trade Management Set
"Giant" is a flexible system in relation to trading strategies. It consists of two high-quality indicators that are installed on five different timeframes of the same currency pair (see screenshot). It monitors the trend and gives signals to open. The system passed a large number of checks and showed high accuracy. Indicators are sold separately. The second word in the main name is the indicator itself. This issue sells the indicator  "Attention" .                                                
Pyro Trend
Oleksii Ferbei
Pyro Trend is a new product that allows you to identify the current market phase (uptrend, downtrend or flat). The indicator is applicable for any data and periods. The middle of the trend wave, as well as the edges, are places of special heat and market behavior; when writing the indicator, an attempt was made to implement precisely finding the middle. Pyro Trend is a trend indicator that uses an original calculation algorithm. This indicator paints arrows in different colors depending on th
BinaryMartini
Abdulkarim Karazon
um indicador para negociação binária baseado no cruzamento 3ma com macd, fornece sinais de compra e venda na barra aberta e não repinta ou retrocede o indicador não está focado na alta taxa de ganhos, pois é feito para negociação de martingale, o indicador se concentra na menor contagem de sinais de perda consecutiva. Estratégia : O depósito mínimo é 1.000 unidades, iniciamos a negociação com 1 unidade (o tamanho da negociação é 1 unidade para cada 1.000 capitais) dobramos o tamanho da negoc
Snake NW
Sergei Shishaev
5 (1)
Канальный индикатор "Snake" . Отлично показывает точки входа и выхода. Не перерисовывает! Хорошо подойдет для стратегий с сетками (усреднения), стратегий с пирамидами (стратегий добора), обычной торговли по тренду, торговли на коррекции. Для любых типов инструментов:   валюты, нефть, металлы, криптовалюты. Для любых таймфреймов:   от M1 до D1 . Для любых стилей торговли:   скальпинг, интрадэй, свинг, долгосрок . Используйте в сочетании с трендовым индикатором, чтобы исключить риски вх
The Momentum Standard/Hidden Divergence indicator will plot the momentum, and will also identify and plot standard (regular) divergences between the indicator and the price action, OR it can be set to identify and plot hidden (reverse) divergences between the indicator and the price action. The divergences themselves are implemented as lines (default green for bullish divergence and red for bearish divergence) drawn in the indicator pane. If activated via the Inputs dialog, alerts will be genera
Anemone
Sean Christian Hammond
Criado usando inteligência artificial, IA, para incorporação de padrões de comportamento visíveis de um organismo vivo na análise de tendências. A Teoria do Caos encontra a Média Móvel. O filtro que alimenta a Anêmona do Mar estende suas gavinhas em um mar de nutrientes para enriquecer-se. Não vou perder o seu tempo com descrições demasiado longas, o conceito é compreensível nestes termos. É uma média móvel rotativa de período personalizável que alterna entre Simples, Exponencial, Ponderada e Su
TREND HARMONY MT4 –  Multi Timeframe Trend and Phase and Pullback Level Visualizer indicator for Metatrader4 The TREND HARMONY indicator automates deep trend analysis and generates visualizations for you. Take control of your trades by eliminating uncertainty! Revolutionize your trading experience with precision and insight through the TREND HARMONY Multi Timeframe Trend Indicator – your ultimate MT4 trend visualization indicator. Are you tired of missing trading opportunities or consistently e
Note : The slow loading of the indicator issue has been addressed . This new version loads fast and does not slow the platform. Version 1.3 : We have updated the indicator to include an historical bar scanning option . So instead of scanning all bars in the history (which can make the indicator slow sometimes ) , you can select the maximum number of bars it can scan which can increase the performance and make the indicator faster. This indicator scans the 1-3 Trendline pattern . The indic
Trend Suffer
Philip Effiong Philip
Alerts you on new trends, with ENTRY and EXIT points. INSTRUCTIONS  Select asset of choice, activate the indicator on the chart and just follow the signals from the arrows. ITS FREE, GIVE ME A GOOD RATING! Platform : Metatrader4 Asset : All Currencies, Gold, BTCUSD, NASDAQ PS : F or newbie and pro traders. Used by more 3,000 traders around the world. Send  a mail for further help and information...........
RSI and EMA Pro Scanner
Neil Andrew Billington
***SALE NOW ON*** We've all been there, searching for that profitable trade wading through 25 pairs but missing out because we didn't see it in time.   This is why I say trade simple trade effective and why I designed this scanner to keep watch on the markets that are trending and where a pullback could be able to happen. Features: Automatically looks at up to 28 pairs at the same time to save you from having to. Easily adjustable EMA settings to your own critera (Fast, Mid and slow sett
Indicador Técnico para Detectar Padrões de Ação de Preço Fortes: Pin Bar, Inside Bar e Outside Bar Introdução: No âmbito da análise técnica, os padrões de ação de preço são indicadores vitais de possíveis movimentos de mercado. Desenvolvemos um indicador técnico sofisticado que agiliza a identificação de padrões sólidos de ação de preço em gráficos. Nosso indicador é especializado em detectar três padrões essenciais: Pin Bar, Inside Bar e Outside Bar. Principais Padrões Detectados: Pin Bar: O pa
This indicator is designed for M1 time-frame and shows: Sum of ticks when the price goes up (color Green -The major component of a candlestick = the body). Sum of points when the price goes up (color Green -The extension lines at the top of the candle). Sum of points when the price goes down (color Red -The major component of a candlestick = the body). Sum of points when the price goes down (color Red -The extension lines at the lower end of the candle). Keep in mind that Sum of Points will be g
Oscillator helps determine the direction of the market Shows the direction of the price movement and is painted in the appropriate color. Allows you to conduct trend and counter trend trading It works on all timeframes, on any currency pairs, metals and cryptocurrency Can be used when working with binary options Distinctive features Does not redraw; Simple and clear settings; It works on all timeframes and on all symbols; Suitable for trading currencies, metals, options and cryptocurrency (Bitco
FREE
Fibonacci CSM
Emir Revolledo
5 (1)
Fibonacci Currency Strength Meter (FCSM) Early Access Sale!! This new product is still in the process of adding new features and settings. For early bird buyers. The Price will be 50% Sale. In a few weeks, the product will be done. Go Grab your copy while it's still cheap. More details will be added soon. Things to be added. Alert Levels Mobile and Email Alert From it's name, Fibonacci Currency Strength Meter is a combination of Fibonacci levels and Currency Strength Meter. The plot of Fib
The Power calculates the strength of the long and short forces by the ratio of the price breakthrough to the average amplitude of the previous market. When the intensity is strong, the signal appears on the chart to estimate the direction of the next wave. There is no future function for the indicator. All signals will not move or disappear after they appear, and have a good real-world reference value. The indicator parameters allow the user to make individual adjustments. More EA and Indicators
Introducing the Donchian Channels indicator for MQL4, a powerful technical analysis tool designed to boost your trading success. This indicator consists of four lines that represent the upper and lower boundaries of price movement over a specified period. With the Donchian Channels indicator, you can easily identify potential breakouts and reversals in the market. The upper line shows the highest high of the specified period, while the lower line represents the lowest low. The space between thes
Fibo Reversals is an indicator which has carefully been put together to attempt to indicate a time period in which an ongoing trend is most probably exhausted and a new trend (actually a reversal trend) inadvertently begins. At this, it should be okay for the manual trader to be on the look out for good trading opportunities. Input Settings Father Fibo  – This Input Determines The Highest Price For The Chosen Input Period. Son Fibo  - This Input Determines The Lowest Price For The Chosen Input
Os compradores deste produto também adquirem
Gann Made Easy
Oleg Rodin
4.92 (62)
Gann Made Easy é um sistema de negociação Forex profissional e fácil de usar, baseado nos melhores princípios de negociação usando a teoria do sr. W. D. Gann. O indicador fornece sinais precisos de COMPRA e VENDA, incluindo níveis de Stop Loss e Take Profit. Você pode negociar mesmo em movimento usando notificações PUSH. Entre em contato comigo após a compra! Vou compartilhar minhas dicas de negociação com você e ótimos indicadores de bônus de graça! Provavelmente você já ouviu muitas vezes sobr
ACTUALMENTE COM 26% DE DESCONTO A melhor solução para qualquer novato ou comerciante especializado! Este Indicador é uma ferramenta comercial única, de alta qualidade e acessível, porque incorporámos uma série de características proprietárias e uma nova fórmula. Com apenas UM gráfico, pode ler a força da moeda para 28 pares de Forex! Imagine como a sua negociação irá melhorar porque é capaz de apontar o ponto exacto do gatilho de uma nova tendência ou oportunidade de escalada? Manual do u
Atomic Analyst
Issam Kassas
5 (3)
Primeiramente, vale ressaltar que este Indicador de Negociação não repinta, não redesenha e não apresenta atrasos, tornando-o ideal tanto para negociação manual quanto automatizada. Manual do utilizador: configurações, entradas e estratégia. O Analista Atômico é um Indicador de Ação de Preço PA que utiliza a força e o momentum do preço para encontrar uma vantagem melhor no mercado. Equipado com filtros avançados que ajudam a remover ruídos e sinais falsos, e aumentam o potencial de negociação.
Advanced Supply Demand
Bernhard Schweigert
4.92 (310)
Atualmente com 33% de desconto! A melhor solução para qualquer Trader Novato ou especialista! Este indicador é uma ferramenta de negociação exclusiva, de alta qualidade e acessível porque incorporamos uma série de recursos proprietários e uma nova fórmula. Com esta atualização, você poderá mostrar fusos horários duplos. Você não só será capaz de mostrar um TF mais alto, mas também mostrar ambos, o TF do gráfico, MAIS o TF mais alto: MOSTRANDO ZONAS ANINHADAS. Todos os traders de Oferta e Demanda
TPSpro RFI Levels
Roman Podpora
5 (13)
A key element in trading is zones or levels from which decisions to buy or sell a trading instrument are made. Despite attempts by major players to conceal their presence in the market, they inevitably leave traces. Our task was to learn how to identify these traces and interpret them correctly. Reversal First Impulse levels (RFI)   -  Version MT5                INSTRUCTIONS                 RUS                 ENG                                       R ecommended to use with an indicator   -  
TPSproTREND PrO
Roman Podpora
5 (15)
TPSpro TRENDPRO  - is a trend indicator that automatically analyzes the market and provides information about the trend and each of its changes, as well as giving signals for entering trades without redrawing! The indicator uses each candle, analyzing them separately. referring to different impulses - up or down impulse. Exact entry points into transactions for currencies, crypto, metals, stocks, indices!  -  Version MT5               DETAILED DESCRIPTION        /       TRADING SETUPS           
Dragon Multi Indicator MT4
Mansour Babasafary
5 (1)
74% discount for the next 10 buyers (original price $605): 1 left Get a 50% bonus by buying (or even renting) any of our products. After buying (or renting), send a message for more information. 3 Indicators in 1 indicator Strategy based on price action Made specifically for the best forex currency pairs Can be used in the best time frame of the market at a very reasonable price This indicator is basically 3 different indicatos . But we have combined these 3 indicators in 1 indicator so th
Break and Retest
Mohamed Hassan
4.6 (10)
‍You can visually backtest Break & Retest to see how it behaved in the past!     Manual guide:   Click here $65  for only 2  copies left! Next price is $120 .  This Indicator only places quality trades when the market is really in your favor with a clear break and retest. Patience is key with this price action strategy! Recommended timeframes: M1 for Scalpers.  M5 for Intraday traders. H1 & H4 for Day traders. Other timeframes are also excellent! After many months of hard
Claro, aqui está a tradução para o português: Apresentando o Indicador de Astronomia para MT4: Seu Companheiro Celestial Definitivo no Trading Você está pronto para elevar sua experiência de trading a alturas celestiais? Não procure mais do que o nosso revolucionário Indicador de Astronomia para MT4. Essa ferramenta inovadora transcende os indicadores de trading tradicionais, aproveitando o poder de algoritmos complexos para fornecer insights astronômicos incomparáveis e cálculos de precisão. Um
Descubra o segredo da negociação forex bem -sucedida com nosso indicador MT4 personalizado! Você já se perguntou como obter sucesso no mercado de Forex, obtendo lucros consistentemente e minimizando o risco? Aqui está a resposta que você está procurando! Permita -nos apresentar nosso indicador proprietário do MT4 que revolucionará sua abordagem à negociação. Versatilidade única Nosso indicador foi projetado especialmente para usuários que preferem as formações de vela Renko e Rangebar. En
Apresentando       Quantum Trend Sniper Indicator   , o inovador Indicador MQL5 que está transformando a maneira como você identifica e negocia as reversões de tendência! Desenvolvido por uma equipe de traders experientes com experiência comercial de mais de 13 anos,       Indicador de Atirador de Tendência Quântica       foi projetado para impulsionar sua jornada de negociação a novos patamares com sua forma inovadora de identificar reversões de tendência com precisão extremamente alta. ***C
Apresentamos o ON Trade Waves Patterns Harmonic Elliot Wolfe, um indicador avançado projetado para detectar diversos tipos de padrões no mercado, usando métodos manuais e automáticos. Aqui está como ele funciona: Padrões Harmônicos: Este indicador pode identificar padrões harmônicos que aparecem em seu gráfico. Esses padrões são essenciais para traders que praticam a teoria de negociação harmônica, conforme popularizada no livro de Scott Carney "Harmonic Trading vol 1 e 2". Seja desenhando-os m
Trend Screener
STE S.S.COMPANY
4.83 (88)
Indicador de tendência, solução única inovadora para negociação e filtragem de tendências com todos os recursos de tendências importantes construídos dentro de uma ferramenta! É um indicador multi-timeframe e multi-moedas 100% sem repintura que pode ser usado em todos os símbolos/instrumentos: forex, commodities, criptomoedas, índices e ações. O Trend Screener é um indicador eficiente que segue a tendência do indicador que fornece sinais de tendência de seta com pontos no gráfico. Os recursos qu
on free demo press zoom out button to see back.. cnt number is bar numbers.you can change up to 3000 related to chart bars numbers. minimum value is 500. there is g value set to 1.01. no need to change it. this indicator almost grail,no repaint and all pairs ,all timeframe indicator. there is red and blue histograms. if gold x sign comes on red histogram that is sell signal. if blue x sign comes on blue histogram that is buy signal. this indicator on thise version works all pairs.al timeframes
FX Power MT4 NG
Daniel Stein
5 (10)
Receba a sua atualização diária do mercado com detalhes e screenshots através do nosso Morning Briefing aqui no mql5 e no Telegram ! O FX Power MT4 NG é a próxima geração do nosso medidor de força de moeda muito popular de longa data, o FX Power. E o que é que este medidor de força da próxima geração oferece? Tudo o que adorou no FX Power original MAIS Análise de força GOLD/XAU Resultados de cálculo ainda mais precisos Períodos de análise configuráveis individualmente Limite de cálculo personal
ACTUALMENTE 31% DE DESCONTO!! A melhor solução para qualquer novato ou comerciante especializado! Este indicador é uma ferramenta comercial única, de alta qualidade e acessível, porque incorporámos uma série de características proprietárias e uma fórmula secreta. Com apenas UM gráfico, dá alertas para todos os 28 pares de moedas. Imagine como a sua negociação irá melhorar porque é capaz de identificar o ponto exacto de desencadeamento de uma nova tendência ou oportunidade de escalada! Con
Currency Strength Wizard é um indicador muito poderoso que fornece uma solução completa para uma negociação bem-sucedida. O indicador calcula o poder deste ou daquele par forex usando os dados de todas as moedas em vários intervalos de tempo. Esses dados são representados em uma forma de índice de moeda fácil de usar e linhas de energia de moeda que você pode usar para ver o poder desta ou daquela moeda. Tudo o que você precisa é anexar o indicador ao gráfico que deseja negociar e o indicador mo
Scalper Inside PRO
Alexey Minkov
4.75 (57)
An exclusive indicator that utilizes an innovative algorithm to swiftly and accurately determine the market trend. The indicator automatically calculates opening, closing, and profit levels, providing detailed trading statistics. With these features, you can choose the most appropriate trading instrument for the current market conditions. Additionally, you can easily integrate your own arrow indicators into Scalper Inside Pro to quickly evaluate their statistics and profitability. Scalper Inside
Scalper Vault
Oleg Rodin
5 (28)
Scalper Vault é um sistema profissional de escalpelamento que fornece tudo o que você precisa para um escalpelamento bem-sucedido. Este indicador é um sistema de negociação completo que pode ser usado por comerciantes de forex e opções binárias. O período de tempo recomendado é M5. O sistema fornece sinais de seta precisos na direção da tendência. Ele também fornece sinais superiores e inferiores e níveis de mercado Gann. Os indicadores fornecem todos os tipos de alertas, incluindo notificações
Shepherd Harmonic Pattern
Abdullah Alrai
4.68 (59)
Este indicador detectará padrões harmônicos desenhados no gráfico por métodos manuais e automáticos. Você pode ver o manual do usuário neste link: Adicione sua avaliação e entre em contato conosco para obtê-lo Existe uma versão gratuita para experimentar este produto no mt4. Você pode usá-lo para detectar padrões de Gartley e Nenstar: https://www.mql5.com/en/market/product/30181 Você pode comprar a versão completa do MT4 em: https://www.mql5.com/en/market/product/15212 Notas O indicador possui u
O sistema PRO Renko é um sistema de negociação altamente preciso especialmente concebido para a negociação de gráficos RENKO. Trata-se de um sistema universal que pode ser aplicado a vários instrumentos de negociação. O sistema neutraliza eficazmente o chamado ruído de mercado, dando-lhe acesso a sinais de inversão precisos. O indicador é muito fácil de usar e tem apenas um parâmetro responsável pela geração de sinal. Você pode facilmente adaptar a ferramenta a qualquer instrumento de negoc
Actualmente 20% OFF ! A melhor solução para qualquer novato ou comerciante especializado! Este software de painel de instrumentos está a funcionar em 28 pares de moedas. É baseado em 2 dos nossos principais indicadores (Advanced Currency Strength 28 e Advanced Currency Impulse). Dá uma grande visão geral de todo o mercado Forex. Mostra valores avançados de força da moeda, velocidade de movimento da moeda e sinais para 28 pares de divisas em todos os (9) períodos de tempo. Imagine como a sua
Symbols must be separated by commas (,) and entered into the parameters exactly as displayed by your broker to ensure they are recognized in the dashboard. These symbols will be used for analysis by the indicator. With one click open any pair any timeframe directly from dashboard The MA Speedometer Dashboard is a highly functional MetaTrader 4 (MT4) indicator designed to enhance trading strategies through dynamic market analysis. It offers robust features for identifying market trends, trading
TrendMaestro
Stefano Frisetti
5 (2)
note: this indicator is for METATRADER4, if you want the version for METATRADER5 this is the link:  https://www.mql5.com/it/market/product/108106 TRENDMAESTRO ver 2.4 TRENDMAESTRO recognizes a new TREND in the bud, he never makes mistakes. The certainty of identifying a new TREND is priceless. DESCRIPTION TRENDMAESTRO identifies a new TREND in the bud, this indicator examines the volatility, volumes and momentum to identify the moment in which there is an explosion of one or more of these data a
Up down v6T
Guner Koca
5 (1)
Thise indicator is up down v6  comes with tradingwiev pinescript. purchased people, after installed on terminal ,contact me on mql5  to get BONUS  TradingView pinescript. up-down indicator is no repaint and works all pairs and lower than weekly time frames charts. it is suitable also 1 m charts for all pairs. and hold long way to signal. dont gives too many signals. when red histogram cross trigger line that is up signal.and price probably will down when blue histogram cross trigger line that
Quantum Breakout Indicator PRO
Bogdan Ion Puscasu
4.96 (26)
Apresentando       Quantum Breakout PRO   , o inovador Indicador MQL5 que está transformando a maneira como você negocia Breakout Zones! Desenvolvido por uma equipe de traders experientes com experiência em negociação de mais de 13 anos,   o Quantum Breakout PRO   foi projetado para impulsionar sua jornada comercial a novos patamares com sua estratégia inovadora e dinâmica de zona de rompimento. O Quantum Breakout Indicator lhe dará setas de sinal em zonas de breakout com 5 zonas-alvo de luc
TrendDecoder Premium
Christophe, Pa Trouillas
5 (3)
Identifica os intervalos e os próximos movimentos prováveis   |  Obter os primeiros sinais e a força das tendências   |  Obter saídas claras antes da reversão   |  Detetar os níveis Fibo que o preço irá testar Indicador não repintável e não atrasado - ideal para trading manual e automatizado - adequado para todos os activos e todas as unidades de tempo Oferta por tiempo limitado >>   50% OFF Após a compra,   por favor contacte-me neste canal  para obter as definições recomendadas Versão   MT5 :
Volatility Trend System - um sistema de negociação que dá sinais para entradas. O sistema de volatilidade fornece sinais lineares e pontuais na direção da tendência, bem como sinais para sair dela, sem redesenho e atrasos. O indicador de tendência monitora a direção da tendência de médio prazo, mostra a direção e sua mudança. O indicador de sinal é baseado em mudanças na volatilidade e mostra entradas no mercado. O indicador está equipado com vários tipos de alertas. Pode ser aplicado a vários i
MetaTrend M4
Vahidreza Heidar Gholami
5 (1)
Meta Trend Indicator is an efficient way to forecast and detect the trend in any market. It reveals the trend, support and resistance levels, volatility and the maximum potential target, all in one indicator. To adapt to the price and to decrease consecutive trend failures, the internal trend detector algorithm studies the market and dynamically chooses the right values for the internal parameters. This indicator is a perfect trend filter for any strategy or expert advisor. Features Super Adapti
ICT, SMC, SMART MONEY CONCEPTS, SMART MONEY, Smart Money Concept, Support and Resistance, Trend Analysis, Price Action, Market Structure, Order Blocks, BOS/CHoCH,   Breaker Blocks ,  Momentum Shift,   Supply&Demand Zone/Order Blocks , Strong Imbalance, HH/LL/HL/LH,    Fair Value Gap, FVG,  Premium  &   Discount   Zones, Fibonacci Retracement, OTE, Buy Side Liquidity, Sell Side Liquidity, BSL/SSL Taken, Equal Highs & Lows, MTF Dashboard, Multiple Time Frame, BigBar, HTF OB, HTF Market Structure, 
Mais do autor
MinDeposit
Aleksej Poljakov
5 (1)
The script analyzes the history of quotes and gives recommendations on the minimum deposit. The calculations take into account the variability of prices and the standard deviation. Margin requirements for the instrument are also taken into account. The result of the script is the minimum recommended deposit for trading the given currency pair.
FREE
This script allows selecting the TakeProfit and StopLoss levels. It analyzes the history data, and then calculates the probability of reaching a given price level. How the script works Suppose you have a trading strategy and you want to select the TakeProfit and StopLoss levels. Run the script and set the parameter: Number of Bars - the average position holding time in bars. Once the script operation is complete, the AIS-PPL.csv file will be created in the Files folder in the terminal data cat
FREE
O script é baseado na simulação de transações comerciais usando um gerador de números aleatórios. Isso permite obter resultados completamente diferentes, mesmo com os mesmos parâmetros de entrada. Quando você executa o script, é aberta uma caixa de diálogo na qual você pode definir os valores desejados para variáveis ​​externas. No bloco,  TradingOptions  define os parâmetros básicos necessários para simular a negociação. StartBalance  - define o tamanho inicial da balança comercial. NumberTrad
FREE
MinDeposit MT5
Aleksej Poljakov
3 (1)
The script analyzes the history of quotes and gives recommendations on the minimum deposit. The calculations take into account the variability of prices and the standard deviation. Margin requirements for the instrument are also taken into account. The result of the script is the minimum recommended deposit for trading the given currency pair.
FREE
The script allows selecting the required 'Filter level' value of the AIS-MTF MT5 indicator. Run the script on the required chart and selected timeframe. Once its operation is complete, the HPS.csv file will be created in the Files folder. Open the file. You will see three columns. The 'Filter lvl' column represents the value of the 'Filter level' for the AIS-MTF indicator. Am. dev. - degree and direction of the indicator's deviation from the price level (sorted in ascending order). Negative valu
FREE
O script é baseado na simulação de transações comerciais usando um gerador de números aleatórios. Isso permite obter resultados completamente diferentes, mesmo com os mesmos parâmetros de entrada. Quando você executa o script, é aberta uma caixa de diálogo na qual você pode definir os valores desejados para variáveis ​​externas. No bloco, TradingOptions define os parâmetros básicos necessários para simular a negociação. StartBalance - define o tamanho inicial da balança comercial. NumberTrade -
FREE
Escolher os níveis de StopLoss e TakeProfit pode ter um impacto muito forte no desempenho geral da negociação. Além dos parâmetros óbvios de uma transação comercial - o tamanho de uma possível vitória ou perda provável - os níveis de StopLoss e TakeProfit também afetam a duração esperada da transação e a rentabilidade da negociação em geral. Se você já determinou a duração ideal da transação usando o script “ AIS-ODT ”, poderá começar a determinar os parâmetros associados aos níveis StopLoss e T
FREE
Este script é projetado para que o trader possa determinar a duração média das transações comerciais, na qual a proporção de possíveis lucros e perdas será ótima. Primeiro, vamos examinar a abordagem geral para determinar a duração ótima das transações comerciais. Nós introduzimos as seguintes variáveis: R  - o resultado da transação; T  - o tempo durante o qual a transação foi aberta; W  - o tempo entre o fechamento da transação anterior e a abertura da próxima. Cada comerciante se esforça para
FREE
Escolher os níveis de StopLoss e TakeProfit pode ter um impacto muito forte no desempenho geral da negociação. Além dos parâmetros óbvios de uma transação comercial - o tamanho de uma possível vitória ou perda provável - os níveis de StopLoss e TakeProfit também afetam a duração esperada da transação e a rentabilidade da negociação em geral. Se você já determinou a duração ideal da transação usando o script “ AIS-ODT ”, poderá começar a determinar os parâmetros associados aos níveis StopLoss e T
FREE
Este script é projetado para que o trader possa determinar a duração média das transações comerciais, na qual a proporção de possíveis lucros e perdas será ótima. Primeiro, vamos examinar a abordagem geral para determinar a duração ótima das transações comerciais. Nós introduzimos as seguintes variáveis: R - o resultado da transação; T - o tempo durante o qual a transação foi aberta; W - o tempo entre o fechamento da transação anterior e a abertura da próxima. Cada comerciante se esforça para ob
FREE
The script allows selecting the required 'Filter level' value of the AIS-MTF indicator. Run the script on the required chart and selected timeframe. Once its operation is complete, the HPS.csv file will be created in the Files folder. Open the file. You will see three columns. The 'Filter lvl' column represents the value of the 'Filter level' for the AIS-MTF indicator. Am. dev. - degree and direction of the indicator's deviation from the price level (sorted in ascending order). Negative values i
FREE
O indicador AIS Correct Averages permite definir o início de um movimento de tendência no mercado. Outra qualidade importante do indicador é um sinal claro do fim da tendência. O indicador não é redesenhado ou recalculado. Valores exibidos h_AE - limite superior do canal AE l_AE - limite inferior do canal AE h_EC - Valor previsto alto para a barra atual l_EC - Valor previsto baixo para a barra atual Sinais ao trabalhar com o indicador O sinal principal é a interseção dos canais AE e E
O indicador de média móvel ponderada AIS calcula uma média móvel ponderada e permite determinar o início de um movimento de mercado de tendência. Os coeficientes de peso são calculados levando em consideração as características específicas de cada barra. Isso permite que você filtre os movimentos aleatórios do mercado. O principal sinal que confirma o início de uma tendência é uma mudança na direção das linhas do indicador e o preço cruzando as linhas do indicador. WH (linha azul) é a méd
O indicador AIS Advanced Grade Feasibility foi projetado para prever os níveis que o preço pode atingir no futuro. Seu trabalho é analisar as últimas três barras e construir uma previsão com base nisso. O indicador pode ser usado em qualquer período de tempo e em qualquer par de moedas. Com a ajuda de configurações, você pode obter a qualidade desejada da previsão. Profundidade da previsão - define a profundidade de previsão desejada em barras. Este parâmetro é recomendado para ser selecionad
The indicator is designed to measure the price volatility. This allows determining the moments for opening or closing trade positions more accurately. High intensity of the market indicates the instability of its movement, but allows for better results. And, conversely, low intensity of the market indicates the stability of its movement. Parameters Bars to process - the number of bars to measure the price movements. A low value of this parameter allows determining the moments of rapid price mo
This indicator uses the Fibonacci p-numbers to smooth a price series. This allows combining the advantages of the simple and exponential moving averages. The smoothing coefficients depend on the level of the p-number, which is set in the indicator parameters. The higher the level, the greater the influence of the simple moving average and the less significant the exponential moving average. Parameters Fibonacci Numbers Order - order of the Fibonacci p-number, specified by trader. Valid values
The indicator is based on the analysis of interaction of two filters. The first filter is the popular Moving Average. It helps to identify linear price movements and to smooth minor price fluctuations. The second filter is the Sliding Median. It is a non-linear filter. It allows to filter out noise and single spikes in the price movement. A predictive filter implemented in this indicator is based on the difference between these filters. The indicator is trained during operation and is therefore
This indicator studies the price action as a combination of micro-trends. All micro-trends are analyzed and averaged. Price movement is filtered based on this averaging. IP_High and IP_Low (blue and red dashed lines) show the instantaneous price movement. They display the forecast only for the current price values, taking into account only the number of bars defined by the 'Filter level' parameter. SP_High and SP_Low (blue and red solid lines) smooth the price movements with respect to history.
Este indicador implementa um processo de suavização linear simples. Uma das desvantagens da suavização exponencial é o rápido decaimento do sinal. Isso torna impossível rastrear totalmente as tendências de longo prazo na faixa de preço. A suavização linear permite ajustar com mais precisão e precisão a filtragem de sinal. O indicador é configurado selecionando os parâmetros: LP - este parâmetro permite selecionar o período de suavização. Quanto maior o seu valor, mais tendências de longo
Este indicador é um filtro híbrido sequencial baseado em uma combinação de propriedades médias e médias móveis. Usar a mediana permite filtrar outliers anormais e impulsos aleatórios nos valores da série de preços. Ao mesmo tempo, o filtro mediano não atua na tendência do movimento dos preços, deixando-o inalterado. Como o filtro mediano não é linear, a média usando uma média móvel simples é usada para suavizar seus valores. Essa abordagem nos permite identificar com mais precisão não apenas
Este indicador é uma combinação de dois filtros Lanczos modificados. O primeiro filtro serve para extrapolar o preço. Com base em valores anteriores, ele prevê um possível movimento de preços dentro da barra atual. Isto é, mostra qual seria o preço se as tendências passadas permanecessem inalteradas. O segundo filtro para suavizar e calcular a média de preços dentro da janela, determinado pelo nível do filtro. Graças à seleção de pesos, este filtro responde mais ativamente ao componente periódic
Vejamos a natureza das mudanças de preço no mercado Forex, não prestando atenção às razões pelas quais essas mudanças ocorrem. Essa abordagem nos permitirá identificar os principais fatores que afetam o movimento dos preços. Por exemplo, vamos considerar os preços de abertura das barras no par de moedas EUR-USD e no período de tempo H1. Por esses preços, construímos o diagrama de Lameray (Figura 1). Neste diagrama, pode-se ver que o movimento dos preços ocorre basicamente de acordo com uma equaç
Este indicador é mais informativo. Seu trabalho é baseado na suposição de que o movimento de preços no mercado pode ser escrito como o barulho de uma cor que depende dos valores dos preços dos parâmetros de distribuição. Isso torna possível analisar a variação dos preços dos diferentes partidos, e considerando o movimento de preços como o som de uma determinada cor, você pode obter informações sobre a situação atual no mercado e fazer uma previsão sobre o comportamento dos preços. Na análise do
Apesar de algumas desvantagens do indicador “ AIS Color Noise Filter ”, a ideia de usá-lo para suavizar a série de preços e os preços previstos parece bastante atraente. Isso se deve a vários motivos: em primeiro lugar, tendo em conta vários componentes de ruído permite construir uma previsão sobre fatores independentes uns dos outros, o que pode melhorar a qualidade da previsão; em segundo lugar, as características de ruído da série de preços se comportam de maneira bastante estável ao longo d
Muitas vezes, no estudo das séries financeiras, aplica-se a suavização. Usando suavização, você pode remover componentes de alta freqüência - acredita-se que eles são causados ​​por fatores aleatórios e, portanto, irrelevantes. A suavização sempre inclui alguma forma de calcular a média dos dados, na qual alterações aleatórias na série temporal se absorvem mutuamente. Na maioria das vezes, para esse propósito, métodos de média móvel simples ou ponderados são usados, assim como a suavização expo
Para isolar componentes de longo prazo e não aleatórios, é necessário saber não apenas quanto o preço mudou, mas também como essas mudanças ocorreram. Em outras palavras, estamos interessados ​​não apenas nos valores dos níveis de preços, mas também na ordem em que esses níveis se substituem uns aos outros. Por meio dessa abordagem, é possível encontrar fatores estáveis ​​e de longo prazo que influenciam (ou podem influenciar) a mudança de preço em um determinado ponto no tempo. E o conheciment
Um dos métodos poderosos de análise é a modelagem de séries financeiras usando processos Levy. A principal vantagem desses processos é que eles podem ser usados ​​para modelar um grande número de fenômenos - do mais simples ao mais complexo. É suficiente dizer que a idéia do movimento dos preços fractais no mercado é apenas um caso especial dos processos de Levy. Por outro lado, com a seleção adequada de parâmetros, qualquer processo Levy pode ser representado como uma média móvel simples. A Fi
Muitas vezes, o comerciante é confrontado com a tarefa de determinar a medida em que o preço pode mudar no futuro próximo. Para este propósito, você pode usar o tipo de distribuição Johnson SB. A principal vantagem dessa distribuição é que ela pode ser usada mesmo com uma pequena quantidade de dados acumulados. A abordagem empírica usada na determinação dos parâmetros dessa distribuição permite determinar com precisão os níveis máximo e mínimo do canal de preço. Esses valores podem ser usados ​
Este indicador permite determinar a probabilidade de o preço atingir um ou outro nível. Seu algoritmo é bastante simples e baseia-se no uso de dados estatísticos nos níveis de preços de um par de moedas específico. Graças aos dados históricos coletados, é possível determinar até que ponto o preço será alterado durante a barra atual. Apesar de sua simplicidade, este indicador pode fornecer assistência inestimável na negociação. Assim, com sua ajuda, é possível determinar os níveis TakeProfit e S
Filtro:
Sem comentários
Responder ao comentário