Volume Candlestick Bars
- Indicadores
- Henrique Helmuth Kreutz Pfeifer
- Versão: 1.1
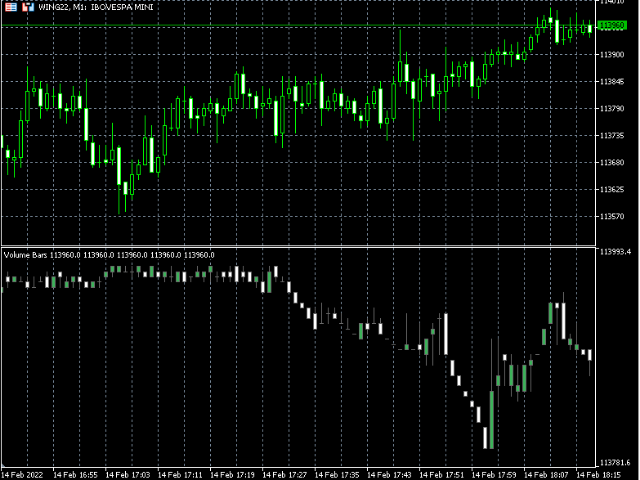
Indicador que forma barras (candlesticks) com uma amostragem diferente da fixa por tempo.
Utiliza dados em tempo real e pode ser usado como substituto do gráfico padrão.
Cada barra é formada quando uma certa quantidade de contratos é negociada, devolvendo ao usuário os valores OHLC do agrupamento.
Caso a corretora não forneça os dados de volume real por negociação, o indicador não funcionará. Pois é nesse parâmetro que a premissa é baseada.
Dessa forma, o preço de um ativo é melhor amostrado, a quantidade de barras (amostras) é proporcional ao volume de negociações e não à uma quantidade fixa de tempo.