• Visão global
  • Comentários
  • Discussão
  • O que há de novo

Your Trend Friend

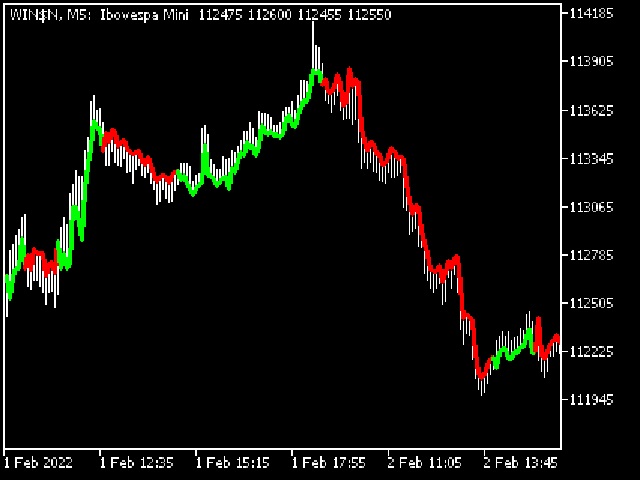
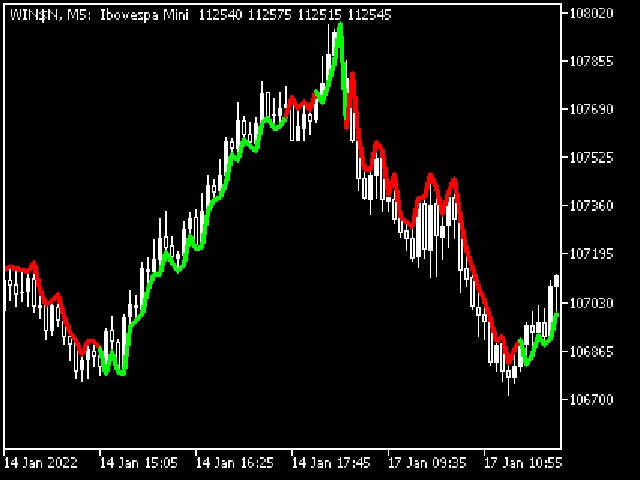
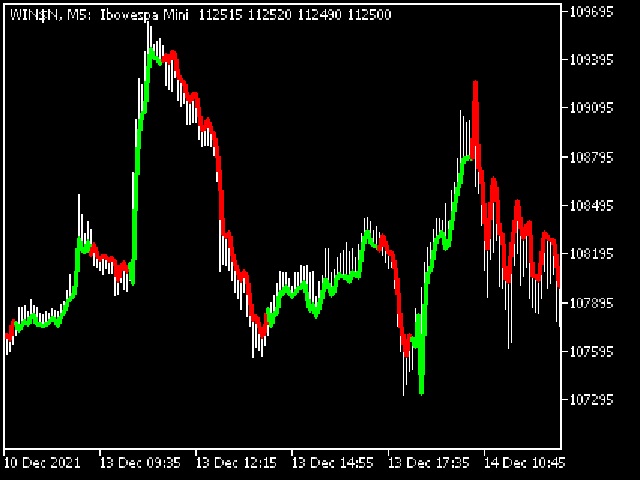
A tendência é sua amiga!


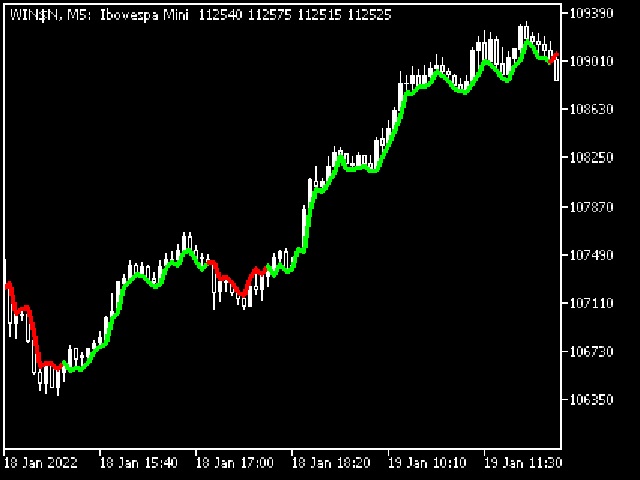
Veja a cor do indicador e faça suas operações nessa direção.

Ele não repinta. Ou seja, depois que cada candle se fecha, a cor dele é definitiva e não irá se alterar.

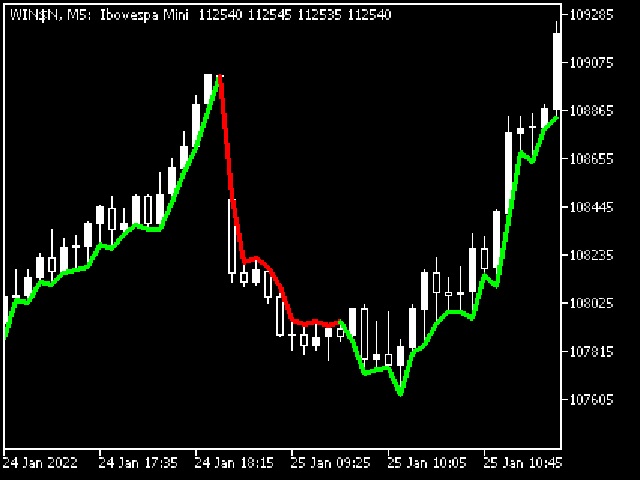
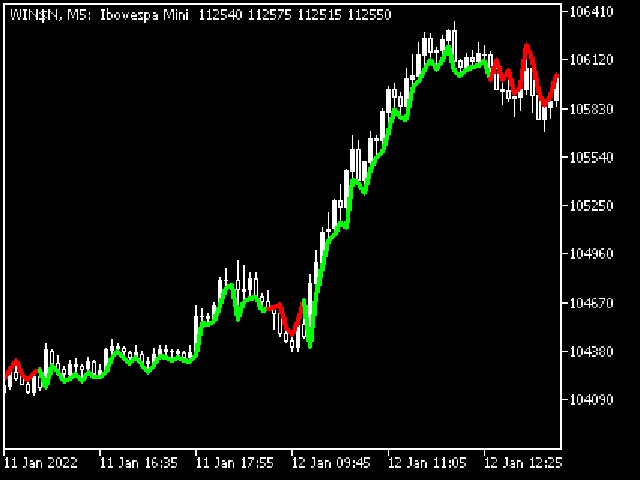
Você pode focar em movimentos mais curtos e rápidos ou tendências mais longas, basta testar o que melhor se encaixa no seu operacional de acordo com o ativo e tempo gráfico usado.

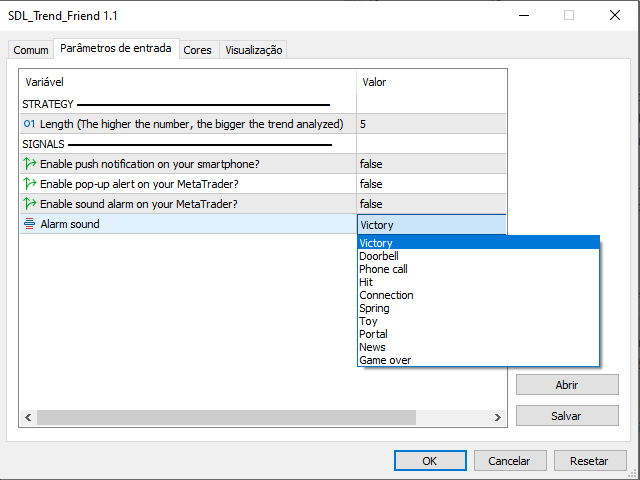
Altere o parâmetro de entrada "Length" e o indicador irá se adaptar automaticamente (quanto maior ele for, maior a tendência analisada)

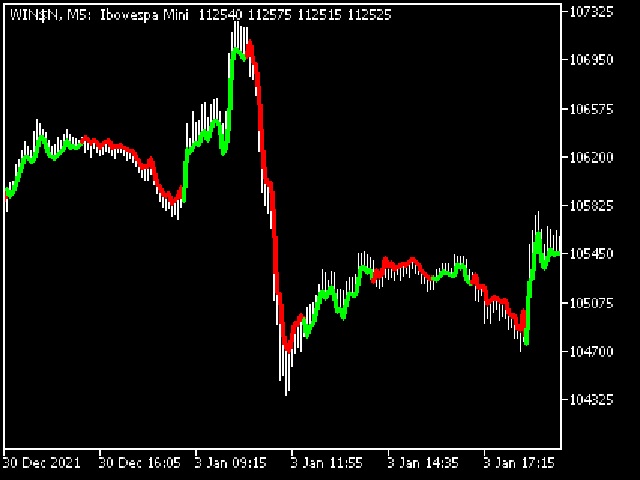
Você também pode alterar a cor, espessura e estilo da linha.

Faça o download e TESTE! Existem grandes movimentos aguardando para serem surfados por você  🏄 🏄 🏄


> NOVAS FUNCIONALIDADES:

Agora você pode ser notificado quando a tendência mudar de direção. Ótimo para quando não estiver de olho no gráfico!

- Habilitar notificação no celular

- Habilitar alerta pop-up no MetaTrader

- Habilitar alarme sonoro no MetaTrader


Produtos recomendados
Noize Absorption Index - is the manual trading system that measures the difference of pressure between bears forces and bulls forces. Green line - is a noize free index that showing curent situation. Zero value of index shows totally choppy/flat market.Values above zero level shows how powerfull bullish wave is and values below zero measures bearish forces.Up arrow appears on bearish market when it's ready to reverse, dn arrow appears on weak bullish market, as a result of reverse expectation.
199 USD
O nível Premium é um indicador único com mais de 80% de precisão nas previsões corretas! Este indicador foi testado pelos melhores Especialistas em Negociação por mais de dois meses! O indicador do autor você não encontrará em nenhum outro lugar! A partir das imagens você pode ver por si mesmo a precisão desta ferramenta! 1 é ótimo para negociar opções binárias com um tempo de expiração de 1 vela. 2 funciona em todos os pares de moedas, ações, commodities, criptomoedas Instruções:
1 100 USD
Uma das sequências numéricas é chamada de "Forest Fire Sequence". Foi reconhecida como uma das mais belas novas sequências. Sua principal característica é que essa sequência evita tendências lineares, mesmo as mais curtas. É esta propriedade que formou a base deste indicador. Ao analisar uma série temporal financeira, este indicador tenta rejeitar todas as opções de tendência possíveis. E somente se ele falhar, ele reconhece a presença de uma tendência e dá o sinal apropriado. Esta abordagem pe
30 USD
Was: $249    Now: $149   Market Profile defines a number of day types that can help the trader to determine market behaviour. A key feature is the Value Area, representing the range of price action where 70% of trading took place. Understanding the Value Area can give traders valuable insight into market direction and establish the higher odds trade. It is an excellent addition to any system you may be using. Blahtech Limited presents their Market Profile indicator for the MetaTrader community.
149 USD
Awesome Oscillator by Bill Williams with the ability to fine-tune and replace the averaging algorithms of the indicator, which significantly expands the possibilities of using this oscillator in algorithmic trading and brings it closer in its properties to such an indicator as the MACD. To reduce price noise, the final indicator is processed with an additional Smooth averaging. The indicator has the ability to give alerts, send mail messages and push signals when the direction of movement of th
40 USD
O indicador calcula e traça automaticamente os níveis de suporte e resistência de Fibonacci - uma das ferramentas mais eficazes para análise de mercado. O cálculo usa os dados de preço médio para o período e intervalo de tempo selecionados. O mínimo e o máximo para este período são considerados o início e o fim do movimento. Os níveis de Fibonacci permitem que você veja os pontos de referência potenciais, em torno dos quais o movimento do preço pode desacelerar ou reverter, ou seja, eles são usa
30 USD
Renko Gold
Ignacio Agustin Mene Franco
Renko Gold! clearly indicates the floors and ceilings where it goes from 4 lines, the line below that marks the floor in green confirming with the thinnest line clarifies the purchase entry, the same is for sale, the top line marks the ceiling and the thinnest red line marks the sale, This indicator works for all temporalities! For Forex and Synthetic Indices markets! It also works for crypto markets! Good profit! World Investor.
40 USD
HMA Trend Professional MT5
Pavel Zamoshnikov
4.4 (5)
Improved version of the free HMA Trend indicator (for MetaTrader 4) with statistical analysis. HMA Trend is a trend indicator based on the Hull Moving Average (HMA) with two periods. HMA with a slow period identifies the trend, while HMA with a fast period determines the short-term movements and signals in the trend direction. The main differences from the free version: Ability to predict the probability of a trend reversal using analysis of history data. Plotting statistical charts for analyz
30 USD
US30NinjaMT5
Satyaseelan Shankarananda Moodley
US30 Ninja is a 5 minute scalping indicator that will let know you when there is a trade set up (buy or sell). Once the indicator gives the trade direction, you can open a trade and use a 30 pip stop loss and a 30 pip to 50 pip take profit. Please trade at own own risk. This indicator has been created solely for the US30 market and may not yield positive results on any other pair. 
30 USD
Volality Index scalper indicator  Meant for Volality pairs such as Volality 10, 25, 50, 75 and 100 The indicator works on all timeframes from the 1 minute to the monthly timeframe the indicator is non repaint the indicator has 3 entry settings 1 color change on zero cross 2 color change on slope change 3 color change on signal line cross Orange line is your sell signal Blue line is your buy signal.
35 USD
This MT5 indicator has been designed to be used on any currency pair and any time frame . It has the scalper and swing trader in mind.  The indicator looks for short-term high-probability reversals in price and will indicate to you to go long (buy) or short (sell) if you see a green or red arrow next to the current candlestick respectively. The indicator provides the best trading opportunities to you during the active trading hours of London and New York, but it will continue to give signals al
199 USD
Perfect Sniper
Ignacio Agustin Mene Franco
Perfect Sniper! is a triple indicator with support resistance detection, downtrend channel, uptrend channel Bands included! where he hunts the rebounds in the red lines for sale, in the green lines mark purchase, in the lower bands that are the breaks gives another second entry either buy or sell, perfect to take advantage of the double entrance, It is used in any temporality, It is used to scalp and long on h1 or h4 to D1. It works for Forex markets, All pairs. It is used for the synthetic inde
100 USD
Trading Utility for Forex Currency Pairs Only not for Gold  Functions Auto Lot Calculation based on Risk Auto stoploss  Auto TakeProfit Breakeven Auto Close Half % Close in percentage with respect to the PIPs Pending Orders BuyLimit Sell Limit with distances BuyStop Sell Stop    with distances Trading Informations Risk in percentage For Multiple trades Combine Takeprofit and Combine Stoplosses
30 USD
PipFinite Trend PRO MT5
Karlo Wilson Vendiola
4.86 (657)
Breakthrough Solution For Trend Trading And Filtering With All Important Features Built Inside One Tool! Trend PRO's smart algorithm detects the trend, filters out market noise and gives entry signals with exit levels. The new features with enhanced rules for statistical calculation improved the overall performance of this indicator. Important Information Revealed Maximize the potential of Trend Pro, please visit www.mql5.com/en/blogs/post/713938 The Powerful Expert Advisor Version Automa
98 USD
Laguerre SuperTrend Clouds   adds an Adaptive Laguerre averaging algorithm and alerts to the widely popular SuperTrend indicator. As the name suggests,   Laguerre SuperTrend Clouds (LSC)   is a trending indicator which works best in trendy (not choppy) markets. The SuperTrend is an extremely popular indicator for intraday and daily trading, and can be used on any timeframe. Incorporating Laguerre's equation to this can facilitate more robust trend detection and smoother filters. The LSC uses the
30 USD
Double HMA MTF for MT5
Pavel Zamoshnikov
5 (2)
This is an advanced multi-timeframe version of the popular Hull Moving Average (HMA) Features Two lines of the Hull indicator of different timeframes on the same chart. The HMA line of the higher timeframe defines the trend, and the HMA line of the current timeframe defines the short-term price movements. A graphical panel with HMA indicator data from all timeframes at the same time . If the HMA switched its direction on any timeframe, the panel displays a question or exclamation mark with a tex
30 USD
Universal Trend
Maryna Shulzhenko
The Universal Trend indicator was created to detect trends in price movement and allows you to quickly determine not only the direction of the trend, but also understand the levels of interaction between buyers and sellers. The indicator works on all timeframes and currency pairs. The indicator gives fairly accurate signals and it is customary to use it both in trending and flat markets. It is advisable to use the indicator in combination with other tools for more reliable signals and making a
111 USD
An indicator of pattern #31 ("Long Island") from Encyclopedia of Chart Patterns by Thomas N. Bulkowski. The second gap is in the opposite direction. Parameters: Alerts - show alert when an arrow appears   Push - send a push notification when an arrow appears (requires configuration in the terminal) GapSize - minimum gap size in points ArrowType - a symbol from 1 to 17 ArrowVShift - vertical shift of arrows in points   ShowLevels - show levels ColUp - color of an upward line ColDn - color of a
30 USD
Este indicador inovador de medir a força das moedas da INFINITY é um assistente indispensável para cambistas e comerciantes que negociam em longo prazo. O sistema de análise de força / fraqueza das moedas é conhecido há muito tempo e é usado no mercado pelos principais traders do mundo. Qualquer negociação de arbitragem não está completa sem essa análise. Nosso indicador determina facilmente a força das moedas subjacentes em relação umas às outras. Ele exibe gráficos de linhas em todas ou no pa
30 USD
PZ Trend Trading MT5
PZ TRADING SLU
3.67 (3)
O Trend Trading é um indicador projetado para lucrar o máximo possível com as tendências que ocorrem no mercado, cronometrando retrocessos e rupturas. Ele encontra oportunidades de negociação analisando o que o preço está fazendo durante as tendências estabelecidas. [ Guia de instalação | Guia de atualização | Solução de problemas | FAQ | Todos os produtos ] Negocie mercados financeiros com confiança e eficiência Lucre com as tendências estabelecidas sem ser chicoteado Reconhecer retrocesso
249 USD
Trend Monitor MT5
Pavel Zamoshnikov
3.67 (3)
The indicator generates early signals basing on ADX reading data combined with elements of price patterns. Works on all symbols and timeframes. The indicator does not redraw its signals. You see the same things on history and in real time. For better visual perception signals are displayed as arrows (in order not to overload the chart). Features The best results are obtained when the indicator works on two timeframes. For example: M30 – the indicator shows the main trend; M5 – the indicator ge
30 USD
Indicadores MT5. Se dibujan automáticamente tres niveles de soporte de Fibonacci y niveles de resistencia. Ellos son: Nivel Mes: Orquídea Media Nivel semanal: Naranja Rojo Nivel de línea de día: Turquesa El color se puede ajustar por parámetros. Este indicador se utiliza principalmente para analizar futuros niveles de soporte y resistencia para un mejor análisis comercial. Si el nivel de soporte se mantiene de manera efectiva muchas veces, el mercado superará el punto máximo anterio
40 USD
Este indicador mostrará os valores de TP e SL (naquela moeda) que você já definiu para todos os pedidos nos gráficos (fechados na linha de transação/pedido) que o ajudarão muito a estimar seus lucros e perdas para cada pedido. E também mostra os valores de PIPs. o formato mostrado é "Valores de moeda de nossos valores de Lucro ou Perda / PIPs". O valor TP será mostrado na cor verde e o valor SL será mostrado na cor vermelha. Para qualquer dúvida ou mais informações, sinta-se à vontade para en
99 USD
Este indicador usa o indicador ZigZag da Metaquotes como base para traçar automaticamente a extensão de fibonacci e retração de fibonacci com base nas ondas de Elliot. Uma retração de Fibonacci será plotada em cada onda desenhada pelo ZigZag. Uma extensão de fibonacci será plotada somente após a 2ª onda. Ambos os fibonacci serão atualizados ao longo da mesma tendência de onda. Suportando até 9 ondas elliot consecutivas. Parâmetros: Depth( Profundidade): quanto o algoritmo ir
30 USD
Rainbow EA MT5
Jamal El Alama
Description : Rainbow EA MT5 is a simple Expert advisor based on   Rainbow MT5 indicator witch is based on Moving average with period 34. The indicator is incorporated in the EA, therefore, it is not required for the EA to operate, but if you wish, you can download it from   my product page . The Expert Advisor settings are as follows : Suitable for Timeframes up to H1 The parameters below can be set according to your trading rules. StopLoss ( Stop Loss in pips) TakeProfit ( Take Profit in pi
59 USD
Este é um indicador MTF dos níveis de suporte e resistência com base nos   extremos do indicador Advanced ZigZag Dynamic   e / ou   Extended Fractals   com etiquetas de preço (pode ser desativado). TFs mais altos podem ser selecionados para o modo MTF. Por padrão, os níveis são gerados com base nos pontos do indicador ZigZag. Os pontos indicadores fractais também podem ser usados em conjunto com o ZigZag ou em vez dele. Para simplificar o uso e economizar tempo de CPU, o cálculo é realizado uma
30 USD
Introducing the Power Trade Plus indicator designed by a small group of traders with a few years of experience trading the market profitably.  The Power Trade Plus is derived from the Power Trade indicator,  the indicator strive in powerful sniper entries and take profit levels, now with a unique and upgraded algorithm to withstand even the most volatile of markets.  
200 USD
This is a multi-symbol and multi-timeframe table-based indicator designed for a candlestick patterns detection with 46 patterns for META TRADER 5. Each formation has own image for easier recognition. Here you find most popular formations such as "Engulfing", "Hammer", "Three Line Strike", "Piercing" or Doji - like candles. Check my full list of patterns on my screenshots below. Also you can not only switch all bearish or bullish patterns from input, but also select formation for a specified symb
30 USD
The Riko Trend indicator is a revolutionary trend trading and filtering solution with all the important features of a trend tool built into one tool! The Riko Trend indicator is good for any trader, suitable for any trader for both forex and binary options. You don’t need to configure anything, everything is perfected by time and experience, it works great during a flat and in a trend. The Riko Trend indicator is a technical analysis tool for financial markets that reflects the current price
109 USD
O indicador cria cotações atuais, que podem ser comparadas com as históricas e, com base nisso, fazer uma previsão do movimento dos preços. O indicador possui um campo de texto para navegação rápida até a data desejada. Opções: Símbolo - seleção do símbolo que o indicador exibirá; SymbolPeriod - seleção do período do qual o indicador coletará dados; IndicatorColor - cor do indicador; HorisontalShift - deslocamento das cotações desenhadas pelo indicador pelo número especificado de
55 USD
Os compradores deste produto também adquirem
Este é um indicador para MT5 que fornece sinais precisos para entrar em uma negociação sem redesenhar. Ele pode ser aplicado a qualquer ativo financeiro: forex, criptomoedas, metais, ações, índices. Ele fornecerá estimativas bastante precisas e informará quando é melhor abrir e fechar um negócio. Assista o vídeo (6:22) com um exemplo de processamento de apenas um sinal que compensou o indicador! A maioria dos traders melhora seus resultados de negociação durante a primeira semana de negociação c
125 USD
Price action trading, Trend trading strategies, Trend following indicators, Trend detection, Range identification, Smart Trend Trading System Indicator, Comprehensive trading system, Multi-indicator approach, Trend following strategy, Range reversal strategy, Smart Trend Cloud, Smart Reversal Zones, Trend Breakout Catcher, Smart Trailing Stop, Multi-timeframe trend finder, Complete trading toolkit, Market trend analysis, Range-bound market signals, Confident trading decisions, Price movement in
100 USD
IVISTscalp5
Vadym Zhukovskyi
5 (1)
Apresentamos a você o indicador iVISTscalp5, que não é apenas único, mas também eficaz em operações de negociação. Este indicador é baseado em dados de tempo e é o resultado de muitos anos de experiência e análise aprofundada dos mercados financeiros. O indicador iVISTscalp5 é uma excelente ferramenta para negociação manual. Conveniência, simplicidade e visualização - toda a complexidade está escondida dentro dele. Simplificamos as configurações e o uso do indicador iVISTscalp5 ao máximo. O indi
500 USD
Blahtech Supply Demand MT5
Blahtech Limited
4.54 (13)
Was: $299    Now: $149   Supply Demand uses previous price action to identify potential imbalances between buyers and sellers. The key is to identify the better odds zones, not just the untouched ones. Blahtech Supply Demand indicator delivers functionality previously unavailable on any trading platform. This 4-in-1 indicator not only highlights the higher probability zones using a multi-criteria strength engine, but also combines it with multi-timeframe trend analysis, previously confirmed swi
149 USD
Support and Resistance, Trading System, Indicator, Candlestick Patterns, VWAP, Trend Catcher, Multi-Timeframe Trend, Support Levels, Resistance Levels, Trading Strategies, Complete Trading System, Technical Analysis, Forex Trading, Price Action, Market Trends, Trading Signals, Trend Identification, Swing Trading, Day Trading, Swing Trading Strategies, Technical Indicators, Trading Tools, Trend Confirmation, Entry and Exit Points, Trading Panel, Forex Signals, Trend Reversals, Trading Algorithms
100 USD
Advanced Supply Demand MT5
Bernhard Schweigert
4.36 (11)
Atualmente com 33% de desconto! A melhor solução para qualquer Trader Novato ou especialista! Este indicador é uma ferramenta de negociação exclusiva, de alta qualidade e acessível porque incorporamos uma série de recursos proprietários e uma nova fórmula. Com esta atualização, você poderá mostrar fusos horários duplos. Você não só será capaz de mostrar um TF mais alto, mas também mostrar ambos, o TF do gráfico, MAIS o TF mais alto: MOSTRANDO ZONAS ANINHADAS. Todos os traders de Oferta e Demanda
199 USD
Este é sem dúvida o indicador de reconhecimento automático de formação de preço harmônico mais completo que você pode encontrar para a MetaTrader Platform. Ele detecta 19 padrões diferentes, leva as projeções de Fibonacci tão a sério quanto você, exibe a Zona de Reversão Potencial (PRZ) e encontra níveis adequados de stop loss e take-profit. [ Guia de instalação | Guia de atualização | Solução de problemas | FAQ | Todos os produtos ] Detecta 19 formações harmônicas de preços diferentes Tr
299 USD
Cansado de traçar linhas de suporte e resistência? A Resistência de suporte é um indicador de período múltiplo que detecta e plota automaticamente linhas de suporte e resistência no gráfico com um toque muito interessante: conforme os níveis de preços são testados ao longo do tempo e sua importância aumenta, as linhas se tornam mais espessas e mais escuras. [ Guia de instalação | Guia de atualização | Solução de problemas | FAQ | Todos os produtos ] Melhore sua análise técnica da noite para o d
149 USD
XQ Indicator MT5
Marzena Maria Szmit
3.25 (4)
The signal conditions are a combination of three indicators, and XQ Forex Indicators only display  medium and long-term trends . The indicator's efficacy has been improved with the addition of a filter that blocks out false signals. The XQ Forex Indicator can be used on  FX pairs, CFDs, and Cryptocurrencies . There are two type of signals:  Buy or Sell and Big Long or Big Short It is possible to enable sending emails when a major trend-change signal is detected, as well as to display the alerts
179 USD
The Price Action Finder Multi indicator is a multi-currency and multi-timeframe indicator. It searches for patterns of the Price Action system on all standard time frames at once and on a large (up to 60) number of instruments (currencies, stocks, metals, etc.). The resulting patterns are placed by the indicator in a table at the bottom of the screen. Patterns: At the moment, the indicator contains the following patterns: Outside bar , Inside bar , Pin bar , Force bar , PPR , as well as the In
149 USD
Introduction to Fibonacci Volatility Indicator Volatility indicator can help you to detect any statistical advantage for your trading. Especially, if you are trading with Price Action and Price Patterns, then we recommend to use the Volatility indicator together with your strategy. Especically, Fibonacci Volatility indicator combines the market volatiltiy with Fibonacci Analysis to provide you more advanced volatiltiy indicator. Main Features Fibonacci Volatility in Z score Configuration Mode Fi
100 USD
TPA True Price Action indicator reveals the true price action of the market makers through 100% non-repainting signals strictly at the close of a candle! TPA shows entries and re-entries, every time the bulls are definitely stronger than the bears and vice versa. Not to confuse with red/green candles. The shift of power gets confirmed at the earliest stage and is ONE exit strategy of several. There are available now two free parts of the TPA User Guide for our customers. The first "The Basics"
168 USD
EFW Pattern Trader is a powerful pattern scanner for Forex and Stock trading. The pattern detection in EFW Pattern Trader uses the Fractal Wave Theory, which captures the endless up and down movement of the market. Therefore, EFW Pattern Trader can be considered as the robust price action indicator. Any patterns in EFW Pattern Trader can be backtested visually in your strategy tester. Visual backtesting with pattern will show you how pattern will likely behave in the live trading. Therefore, you
100 USD
RubdFx Perfect Reversal , The reversal indicator is used to determine areas of support and resistance by Drawing an arrow with a level of supply and demand ( ReversalZones ). - You will catch more swings by reducing the period, and less swings if you increase period - Mobile, computer and email alerts available . it is not pushed by price which means the arrow will stay in one place,suitable for scalping and long term trading  Also Compatible with all forex paris , BUY RULES;  open a buy positio
159 USD
The Volume by Price Indicator for MetaTrader 5 features Volume Profile and Market Profile TPO (Time Price Opportunity). Get valuable insights out of currencies, equities and commodities data. Gain an edge trading financial markets. Volume and TPO histogram bar, line and metric charts. TPO letter and block marker charts including split structures. Positioning and styling options to suit the user's needs and context. Volume Profile and Market Profile TPO Point of Control (VPOC and TPOC), Imbalanc
259 USD
Introduction to Fractal Pattern Scanner Fractal Indicator refers to the technical indicator that makes use of the fractal geometry found in the financial market. Fractal Pattern Scanner is the advanced Fractal Indicator that brings the latest trading technology after the extensive research and development work in the fractal geometry in the financial market. The most important feature in Fractal Pattern Scanner is the ability to measure the turning point probability as well as the trend probabil
185 USD
"The Squeeze indicator attempts to identify periods of consolidation in a market. In general the market is either in a period of quiet consolidation or vertical price discovery. By identifying these calm periods, we have a better opportunity of getting into trades with the potential for larger moves. Once a market enters into a "squeeze," we watch the overall market momentum to help forecast the market direction and await a release of market energy." The Modified TTM Squeeze Indicator is a modi
149 USD
Gartley Hunter MT5
Siarhei Vashchylka
5 (11)
Gartley Hunter - Indicator for finding harmonic patterns (Gartley patterns) and their projections. The indicator is equipped with an alert system. List of patterns At the moment, the indicator contains patterns:     Alternative bat     Bat     Butterfly     Crab     Cypher     Deep crab     Gartley Indicator control panel The pattern control panel is located in the lower left corner of the screen. See the picture below for a description of the panel. There are Russian and English version
149 USD
Este indicador é um indicador de análise automática de onda perfeito para negociação prática! A definição padronizada da banda não é mais uma onda de pessoas diferentes, e o desenho de interferências feitas pelo homem é eliminado, o que desempenha um papel fundamental na análise rigorosa da abordagem. =>Increase the choice of international style mode, (red fall green rise style)           Atualmente comprando desconto!   Conteúdo do índice: 1       Onda básica:   Primeiro, encontramos o
188 USD
Difícil de encontrar e com pouca frequência, as divergências são um dos cenários de negociação mais confiáveis. Este indicador localiza e verifica automaticamente divergências ocultas e regulares usando seu oscilador favorito. [ Guia de instalação | Guia de atualização | Solução de problemas | FAQ | Todos os produtos ] Fácil de trocar Encontra divergências regulares e ocultas Suporta muitos osciladores conhecidos Implementa sinais de negociação baseados em fugas Exibe níveis adequados de
249 USD
Introduction to X3 Chart Pattern Scanner X3 Cherart Pattern Scanner is the non-repainting and non-lagging indicator detecting X3 chart patterns including Harmonic pattern, Elliott Wave pattern, X3 patterns, and Japanese Candlestick patterns. Historical patterns match with signal patterns. Hence, you can readily develop the solid trading strategy in your chart. More importantly, this superb pattern scanner can detect the optimal pattern of its kind. In addition, you can switch on and off individu
250 USD
ACB Breakout Arrows MT5
KEENBASE SOFTWARE SOLUTIONS
5 (1)
The ACB Breakout Arrows indicator provides a crucial entry signal in the market by detecting a special breakout pattern. The indicator constantly scans the chart for a settling momentum in one direction and provide the accurate entry signal right before the major move. Get multi-symbol and multi-timeframe scanner from here - Scanner for ACB Breakout Arrows MT 5 Key features Stoploss   and Take Profit levels are provided by the indicator. Comes with a MTF Scanner dashboard which tracks the br
145 USD
Golden Spikes Detector
Batsirayi L Marango
5 (1)
Golden Spikes Detector This indicator is based on an advanced strategy primarily for trading spikes on Boom and Crash Indices. Complex algorithms were implanted to detect high probability entries only. It alerts on potential Buy and Sell entries. To trade spikes on the Deriv or Binary broker, only take Buy Boom and Sell Cash alerts. It was optimised for 5-minute timeframe. Features ·          Sends push notifications to mobile phone ·          Pop up and sound alerts on computer or laptop ·     
150 USD
KT Renko Patterns MT5
KEENBASE SOFTWARE SOLUTIONS
KT Renko Patterns scans the Renko chart brick by brick to find some famous chart patterns that are frequently used by traders across the various financial markets. Compared to the time-based charts, patterns based trading is easier and more evident on Renko charts due to their uncluttered appearance. KT Renko Patterns features multiple Renko patterns, and many of these patterns are extensively explained in the book titled Profitable Trading with Renko Charts by Prashant Shah. A 100% automate
145 USD
Bill Williams Advanced
Siarhei Vashchylka
5 (1)
Bill Williams Advanced is designed to analyze the chart according to Bill Williams' Profitunity system. The indicator analyzes the signals of the AO, AC indicators and places them in the panel in the upper left corner of the chart. In addition, using hot keys, the indicator instantly displays / hides the AO and AC indicators (for more details, see the video instructions). Description Each line of the indicator table represents the signals of the Profitunity system that are valid on the last fi
199 USD
VTrende Pro
Andrii Diachenko
VTrende Pro - MTF indicator for trend trading with a display panel for MT5 *** Videos can be translated into any language using subtitles (video language - Russian) Although the signals of the VTrende Pro indicator can be used as signals of a full-fledged trading system, it is recommended to use them in conjunction with the Bill Williams TS. VTrende Pro is an extended version of the VTrende indicator. Difference between Pro version and VTrende: - Time zones - Signal V - signal 1-2 waves
697 USD
Apresentamos o revolucionário indicador MT5, Traffic Signal - seu portal definitivo para o mundo do trading bem-sucedido! Projetado com precisão e expertise, o Traffic Signal opera com uma estratégia especial que aproveita o poder de indicadores técnicos avançados - RSI, Stochastics, CCI e Tendências - em todos os intervalos de tempo. Prepare-se para uma experiência de trading extraordinária, pois este indicador de última geração oferece os sinais mais precisos para entrada, permitindo que você
450 USD
Fear and Greed MT5
Diego Arribas Lopez
5 (1)
MT4 Version   Fear and Greed MT5 Indicator Uncertain at the time of making the decision to realize total or partial profits? Fear and Greed MT5 provides great help with a high level of reliability when making such decistions. TRY IT FOR FREE NOW! Fear and Greed MT5 is the first indicator that offers information on the Fear and Greed level in the market for MT5. It has been developed to facilitate the decision-making at the time of entring a trade and taking total or partial profits. It shows pos
129 USD
Stargogs Spike Catcher
Lorenzo Edward Beukes
5 (6)
Stargogs Spike Catcher V3.12 This Indicator is Developed To milk the BOOM and CRASH indices . Send me Message if you need any help with the indicator.  CHECK OUT THE STARGOGS SPIKE CATCHER EA/ROBOT V3: CLICK HERE ALSO CHECK OUT SECOND TO NONEFX SPIKE CATCHER:   CLICK HERE STARGOGS SPIKE CATCHER V3.12 WHATS NEW! Brand New Strategy. This is the Indicator you need for 2023. The Indicator Gives you an Entry at a time when conditions are met enter on every arrow and exit when it gives an X. New Tren
100 USD
Weis Wave with Alert MT5
Trade The Volume Waves Single Member P.C.
4.93 (14)
Get 30% Discount until 30/9/20203 on Lifetime package 420$ from 599$. Rental/Lifetime Package Options and Privileges  * For optimum results the yearly or lifetime package is suggested due to live training and Discord  channel trading with the  creator! Rent Monthly Six Months   Yearly/Lifetime Weis Wave with Speed with Alert+Speed Index x x x Manual  x x x Quick Set up Video x x x Blog x x x Lifetime Updates x x x Setup and Training Material x x Free Rectangle Break Alert Tool      x Discord
420 USD
Mais do autor
Trap Zone
Luigi Nunes Labigalini
4.5 (2)
Este indicador serve como alerta para regiões de clímax. Como funciona? Quando a média móvel aritmética de 20 períodos vai de encontro à média móvel aritmética de 200 períodos, forma-se uma região de conflito com duas grandes forças opostas brigando.  Isso faz com que o preço apresente repiques aleatórios até que se defina um lado vencedor, o que pode ser perigoso. Portanto, o indicador pinta a região entre as médias móveis para alertá-lo. Como usar? Pode ser usada para estratégias específi
FREE
Setup 91 Larry Williams
Luigi Nunes Labigalini
4.5 (2)
Sinais de compra e venda baseados no Setup 9.1 de Larry Williams, popularizada no Brasil pelo Palex, para reversões de tendência. Como funciona? O indicador ativa o sinal de compra ou venda quando acontece um fechamento de candle virando a média móvel exponencial (MME) de 9 períodos. Como usar? Uma maneira de usá-lo, proposta por Larry Williams, é entrar no trade com uma ordem stop um tick acima da máxima do candle com sinal de compra, colocando a ordem de stop loss um tick abaixo da mí
99 USD
Setup 92 Larry Williams
Luigi Nunes Labigalini
Sinais de compra e venda baseados no Setup 9.2 de Larry Williams, popularizado no Brasil pelo Palex, para continuação de tendência. Como funciona? O indicador ativa o sinal de compra quando um candle fecha abaixo da mínima anterior se a média móvel exponencial (MME) de 9 períodos estiver subindo. O indicador ativa o sinal de venda quando um candle fecha acima da máxima anterior se a MME9 estiver caindo. Como usar? Uma maneira de usá-lo, proposta por Larry Williams, é entrar no trade com
99 USD
Setup 93 Larry Williams
Luigi Nunes Labigalini
Sinais de compra e venda baseados no Setup 9.3 de Larry Williams, popularizado no Brasil pelo Palex, para continuação de tendência. Como funciona? O indicador ativa o sinal de compra quando dois candles fecham abaixo do fechamento referência e a média móvel exponencial (MME) de 9 períodos está subindo. O indicador ativa o sinal de venda quando dois candles fecham acima do fechamento referência e a MME9 está caindo. Como usar? Uma maneira de usá-lo, proposta por Larry Williams, é entrar no
99 USD
Setup 94 Larry Williams
Luigi Nunes Labigalini
Sinais de compra e venda baseados no Setup 9.4 de Larry Williams, popularizado no Brasil pelo Palex, para falhas de reversão e continuação de tendência. Como funciona? Para uma tendência de alta, o indicador sinaliza a compra quando temos um candle virando a MME9 para baixo e fechando abaixo dela, seguido de um candle virando ela para cima e fechando acima dela, com uma mínima mais alta que a mínima do candle anterior.  Para uma tendência de baixa, o indicador sinaliza a venda quando temos um
99 USD
Setups 9 Larry Williams
Luigi Nunes Labigalini
Sinais de compra e venda baseados nas estratégias 9.1, 9.2, 9.3 e 9.4 de Larry Williams, popularizadas no Brasil pelo Palex, para reversões e continuações de tendência. Para entender a lógica de sinalização e operação de cada setup, por favor acesse: Setup 9.1:  https://www.mql5.com/pt/market/product/50986 Setup 9.2:  https://www.mql5.com/pt/market/product/52268 Setup 9.3:  https://www.mql5.com/pt/market/product/52269 Setup 9.4:  https://www.mql5.com/pt/market/product/52273 Avisos:  - Este
199 USD
Setup PC
Luigi Nunes Labigalini
Sinais de compra e venda baseados no Setup Ponto Contínuo (PC), popularizado no Brasil por Stormer e Palex, para continuação de tendência. Como funciona? O indicador ativa o sinal de compra quando temos preços acima da Média Móvel Aritmética de 21 períodos (MM21) ascendente seguidos por uma correção e toque nela. O indicador ativa o sinal de venda quando temos preços abaixo da MM21 descendente seguidos por uma correção e toque nela. Como usar? Uma maneira de usá-lo, proposta por Storm
99 USD
Joe DiNapoli
Luigi Nunes Labigalini
Sinais de compra e venda baseados no Setup Joe DiNapoli com a média móvel exponencial de 3 períodos deslocada em 3 períodos, para reversões de tendência. Quem é ele? Joe DiNapoli é um trader profissional e autor de livros, envolvido no mercado financeiro a mais de 38 anos. Ele é um Conselheiro de Commodities Trading registrado (C.T.A.) por mais de 15 anos e ensinou suas técnicas em grandes capitais financeiras da Europa, Ásia, África do Sul, Oriente Médio, Russia e Estados Unidos. Como o in
19.90 USD
HiLo Points
Luigi Nunes Labigalini
Esse indicador é baseado nas médias móveis das máximas e mínimas, para identificação de tendências e/ou condução de stop loss. Como o indicador funciona? O indicador plota os pontos de tendência de alta até que haja um fechamento abaixo da média móvel das mínimas. Quando isso acontece, inicia-se uma tendência de baixa e os pontos são plotados até que haja um fechamento acima da média móvel das máximas. Quando isso acontece, outra tendência de alta se inicia. E assim vai. Como usar o indicad
99 USD
Setup da Onda
Luigi Nunes Labigalini
Sinais de compra e venda baseados na estratégia do Setup da Onda, popularizada no Brasil pelo Palex, para entradas em correções pós-reversão. Como o indicador funciona? O indicador ativa o sinal de compra ou venda quando suas respectivas condições são atendidas.  Para uma tendência de alta, precisamos de uma reversão para alta na MME9 seguida por preços acima da MM21 ascendente realizando uma correção e toque nela.  Para uma tendência de baixa, precisamos de uma reversão para baixa na MME9 se
10 USD
Setup DT Trap
Luigi Nunes Labigalini
Sinais de compra e venda baseados no Setup Armadilha Day Trade (DT TRAP), popularizado no Brasil por Alexandre Wolwacz (STORMER), para falhas de rompimento. Como o indicador funciona? O indicador ativa o sinal de compra ou venda quando suas respectivas condições são atendidas.  Para uma compra, é preciso que o candle faça uma mínima menor que a mínima do dia anterior. Neste momento, será plotado o sinal com a cor secundária. Para uma venda, é preciso que o candle faça uma máxima maior que a m
99 USD
Setup PFR
Luigi Nunes Labigalini
Sinais de compra e venda baseados no Setup Preço de Fechamento de Reversão (PFR), criado por Stormer para operações em continuação de tendência. Como funciona? O indicador ativa o sinal de compra quando temos uma mínima menor que as duas mínimas anteriores e o fechamento maior que o fechamento anterior. O indicador ativa o sinal de venda quando temos uma máxima maior que as duas máximas anteriores e o fechamento menor que o fechamento anterior. Como usar? Uma maneira de usá-lo, propos
99 USD
Setup Double 7s
Luigi Nunes Labigalini
Sinais de entrada e saída da Estratégia Duplo 7 de Larry Connors em seu livro "Estratégias Operacionais de Curto Prazo Que Funcionam". Larry alega que esta estratégia previu a direção do mercado mais de 80% do tempo desde 1995. Lucrando sem se expor ao mercado em mais de 25% do tempo. Ótima para swing trade em gráfico diário do SPY, Nasdaq, FXI da China, EWZ do Brasil (IBOV dolarizado) e a maioria dos ETFs e índices do mundo. Como o indicador funciona? O indicador plota o sinal de compra qu
99 USD
Filtro:
Sem comentários
Responder ao comentário
Versão 1.1 2022.02.12
New features:
- Push notification on your smartphone
- Pop-up alert on your MetaTrader
- Sound alarm on your MetaTrader