Tushar Chande Aroon
- Indicadores
- Flavio Javier Jarabeck
- Versão: 1.0
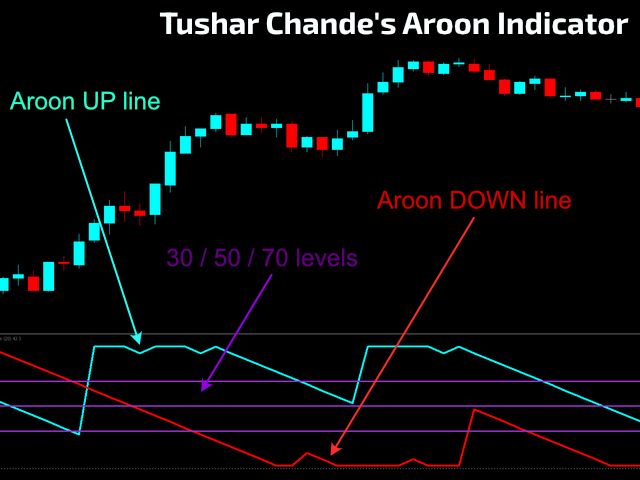
The name Aroon means “Dawn's Early Light” in Sanskrit. His creator Tushar Chande chose this name because the indicator is designed to catch the beginning of a new trend. At first sight it seems a little confusing all those jagged lines but after you understand the basics of it, you will find this indicator pretty cool and use it in a variety of ways, i.e.: Trigger, Trend Filtering System, and so on.
The Aroon indicator was created in 1995 so it is a "modern" indicator compared to the Jurassic ones like RSI and all Overbought and Oversold indicators from the '60s and '70s...
This indicator contains 2 lines: Aroon UP and Aroon DOWN, which fluctuates between the range of 0 (weak trend) and 100 (strong trend). The Aroon UP line represents the Bullish movements of prices and the Aroon DOWN the Bearish movements of prices. The logic behind this indicator is that an asset will have the Closing Prices making new highs during an Uptrend, and will make new lows during a Downtrend.
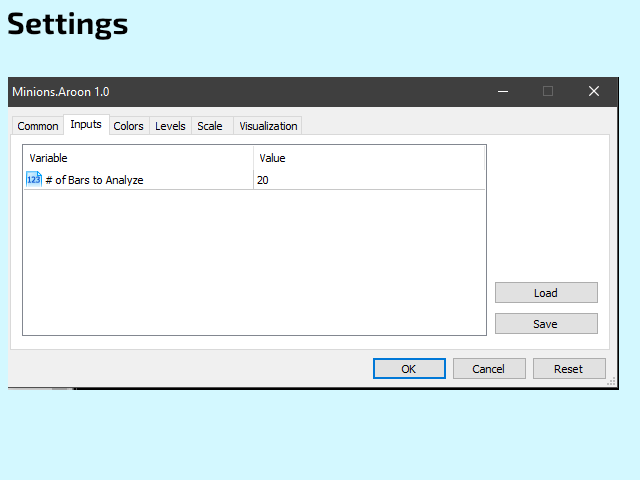
The only parameter you need to use is the lookback period (bars) for the analysis. There is no optimal parameter here since there is an almost unlimited amout of assets and timeframes around the world. And, it all depends on your strategy and what do you need to "see" from the market you are trading...
We at Minion Labs recreated this indicator for MT5 to be used as a Trend Filtering System. But you can use it in any way you want. Experimenting is the key to success...
Enjoy!
HOW TO "READ" THIS INDICATOR
- Lines Crossovers may be used as a signal of a probable change in trend.
- A Line above the 70 level indicates a probable strong trend.
- When both lines are below the 70/50 level could indicate a ranging/sideways market.
PARAMETERS
- # of past bars to analyze their Highs and Lows.
Buffers for your Expert Advisor:
- #0: Arron UP line.
- #1: Arron DOWN line.
As always, if you like this indicator, all I am asking is a little Review (not a Comment, but a REVIEW!)...
This will mean A LOT to me... And this way I can continue to give away Cool Stuff for Free...
With No Strings Attached! Ever!
Live Long and Prosper!
;)


Perfect! This indicator sheds light to profitable trading. Thanks!