VSA on the Fly MT5
- Indicadores
- Andrei Novichkov
- Versão: 1.0
- Ativações: 5
The "VSA on the FLY" indicator is designed to quickly display various Volume Profile / Market Profile parameters.. The indicator takes the initial data for operation from the M1 timeframe. The indicator is installed on any timeframe and starts displaying data starting from the selected left border. This can be the beginning of a day, a week, a trading session, any hour, etc.
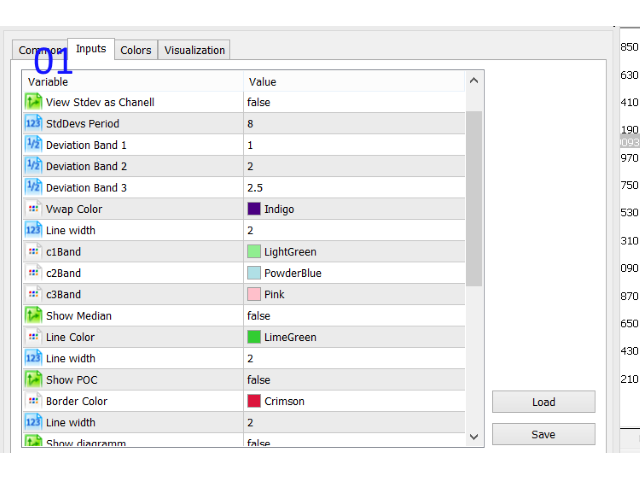
The following input parameters are available:
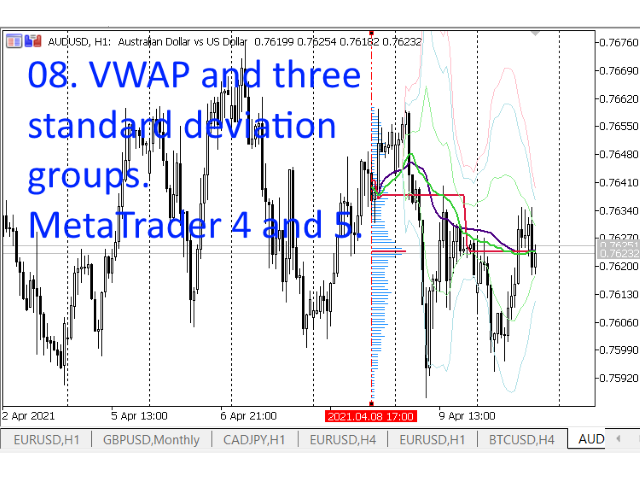
- Show VWAP. Show VWAP line. The default is true.
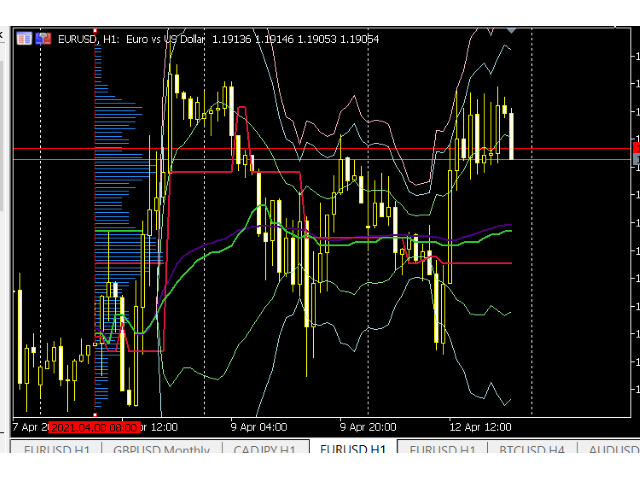
- Show StdDev Bands. Display three groups of standard deviation for VWAP. The default is false.
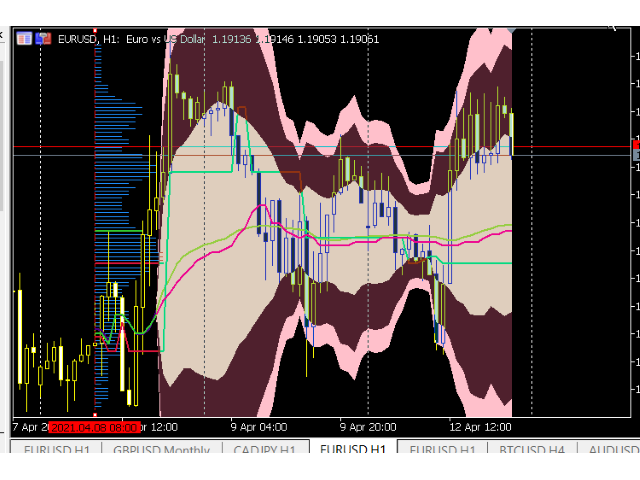
- View Stdev as Channell. Display standard deviation groups with filled areas. Attention! This option is available only in MetaTrader 5. By default false.
- StdDevs Period. Average period for standard deviation calculations. The default is 8.
- Deviation Band 1, 2, 3. Standard deviation group factors. The default is 1, 2, 2.5.
- VWAP Color. Indicator line color. The default is indigo .
- VWAP Line width. Indicator line width. The default is 2.
- Deviation Band 1, 2, 3 Color. Colors of three groups of standard deviation.
- Show MEDIAN. Display MEDIAN value. The default is false.
- MEDIAN Line Color. Indicator line color. The default is light green.
- MEDIAN Line width. Indicator line width. The default is 2.
- Show POC. Display POC. The default is false.
- POC Liner Color. Indicator line color. The default is red.
- POC Line width. Indicator line width. The default is 2.
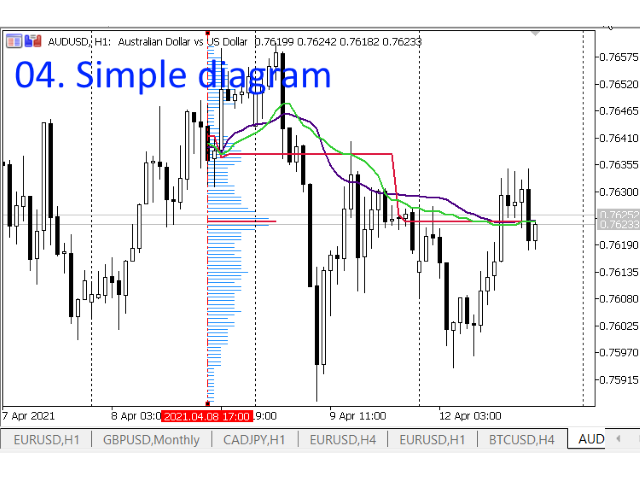
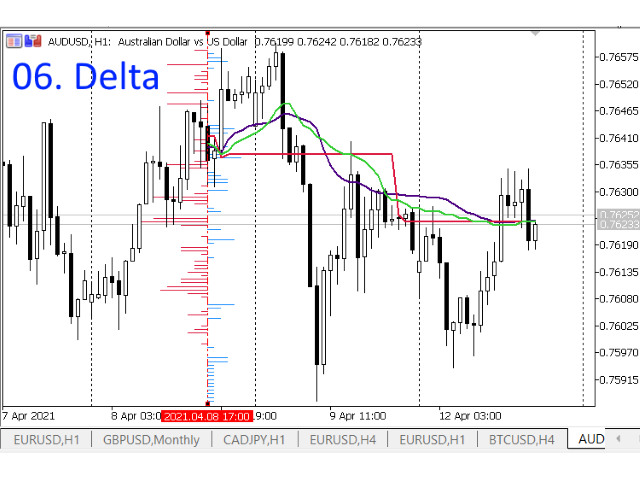
- Show Diagramm.Display a horizontal volume diagram. The default is false.
- Volume Type. Source type. Available:
- TICK. Tick volumes are used. This is the default.
- REAL. Real volumes are used.
- View Type. Diagram display type. Available:
- NORMAL. Regular horizontal diagram. This is the default.
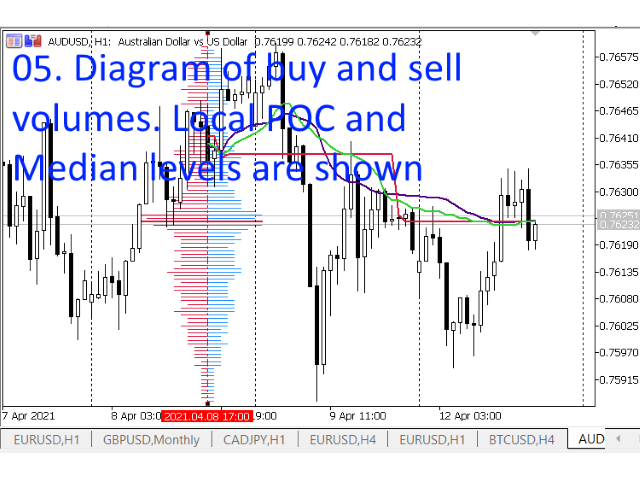
- BUYSELL. Diagram with a breakdown into "volumes of buyers" and "volumes of sellers".
- DELTA. Delta is the difference between the "volumes of buyers and sellers".
- Horizontal size. The horizontal size of the diagram. The maximum diagram line length is this number of candles, starting from the initial position. The default is 10.
- Simple diagram's color. The color of a regular diagram. light blue by default.
- "Buy" color. The color of the "buyer's volumes" lines. light blue by default.
- "Sell" color. The color of the lines of "seller volumes". The default is red.
- Simple diagram's width. Line thickness of the diagram. The default is 1.
- Show local levels. On diagrams (except for delta), lines will be highlighted corresponding to the current POC and MEDIAN values. The default is true.
- Vert. Line Color, Vert. Line style, Vert. Line width. Color, style and thickness of the vertical line of the left border of the display range.
- Vert. Line select. Whether the vertical line of the left border of the display range is created selected. The default is false.
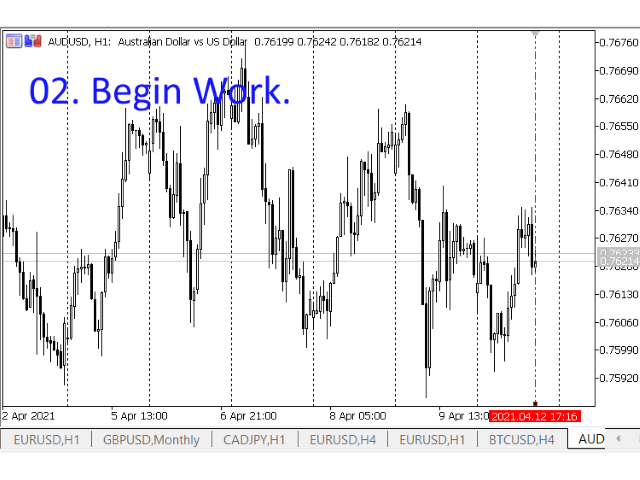
Beginning of work.
After installing the indicator on the chart and setting the parameters, the user receives a screen with a vertical line on the last bar.
The user selects a vertical line and moves it to the desired position. From this moment on, the vertical line becomes the left border of the indicator, its starting point. All indicator data is displayed from this border. The right border does not exist - it moves along with the chart.
By default, only VWAP is displayed at start-up.
This indicator should be used with caution on the M1 timeframe. The indicator uses this timeframe as a source of initial data.