• Visão global
  • Comentários (1)
  • Discussão (1)
  • O que há de novo

VAP Volume at price

1

Trades sabem da importância em se observar as variações de volume e como isso pode ser determinante para entender como o mercado irá se movimentar. Informações quanto ao volume negociado, a frequência dos negócios concretizados e a correlação entre compradores e vendedores num determinado momento do mercado expandem nossa visão de volume e podem melhorar significativamente a assertividade de nossas análises. 

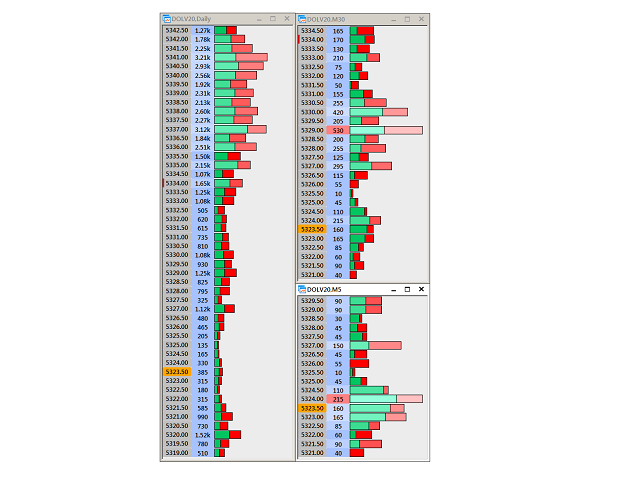
O Volume at Price (or VAP) é um indicador de acumulação que mostra o volume total de negócios para cada nível de preço e a correlação entre compradores/vendedores, na forma de uma barra horizontal. Essa característica aumenta o detalhamento das informações sobre volume, possibilitando a observação de pontos de suporte ou resistência, em níveis de preço com grande acumulação de negócios.

Características:

  • coluna para preços e negócios;
  • barras horizontais são alinhadas à cada nível de preço e representam o volume total acumulado naquele nível, dentro da janela de tempo do indicador;
  • cada barra tem tamanho proporcional ao volume negociado em seu nível de preço;
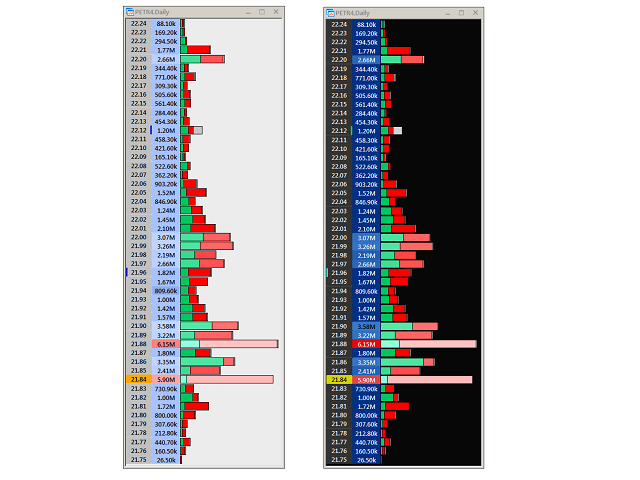
  • através de um sistema de cores, as barras horizontais distinguem a acumulação da agressão dos compradores e vendedores (barras verde para compradores; vermelha para vendedores e cinza claro para os negócios diretos)

Importante: O indicador VAP somente funciona se a corretora disponibilizar todos os dados dos ticks do ativo. Desde que estes dados estejam disponíveis, o indicador funcionará tanto no mercado de ações quanto no de contratos futuros. Você deve verificar em seu terminal (Times and Sales) se sua corretora disponibiliza estes dados para o ativo que deseja negociar. Importante observar tmabém que o indicador deve ser instalado sobre um gráfico limpo, sem qualquer outro indicador ou EA.

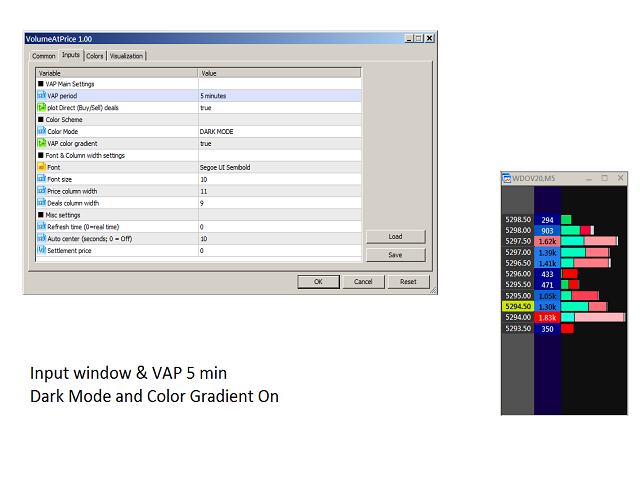
Parâmetros de Entrada:


Parâmetros Descrição
VAP Period  Ajusta a janela de tempo na qual o indicador irá trabalhar
 Os valores são: Diário (Daily), 60 min, 30 min, 15 min, 10 min, 5 min e 1 min
Plot Direct Deals   True ou False.  
 TRUE = negócios Diretos serão plotados e estes volumes considerados nos cálculos do VAP
 Negócios Diretos são aqueles negócios fechados dentro da própria corretora e são lançados no Times and Sales como negócios do tipo N/A ou BUY/SELL
Color Mode  Valores: Dark Mode ou Light Mode
 Dark Mode é baseado em fundo preto enquanto Light Mode é baseado na cor padrão do Metatrader
VAP Color Gradient  Valores: True or False. 
 TRUE = o indicador irá plotar as barras usando um sistema de gradiente de cores, sendo que as maiores acumulações são mostradas com cores mais claras.
 A mesma regra se aplica à coluna de negócios (maiores volumes = cores mais claras), além de usar tons de vermelho para destacar os maiores volumes.
 Font  Fonte
 Font size  Tamanho da Fonte
 Price label size  Largura da coluna Preço (em caractéres) *
 Deals label size  Largura da coluna Negócios ( em caractéres ) *
 Refresh time (0=real time)  Intervalo de tempo (segundos) para a atualização do indicador (para poupar recursos do sistema, caso necessário).
 Valor igual a 0 (zero) indica a atualização em tempo real (default setting).
 Auto center  Tempo (segundos) para centralizar automaticamente o VAP pelo último preço
 Settlement Price  Valor do Ajuste
 Se atribuído, o indicador irá plotar uma marca neste nível de preço, auxiliando a identificação deste ponto de negociação. **

(*) - largura das colunas são baseadas na Fonte e são calculadas automaticamente; pode-se ajustar estes tamanhos nestes campos

(**) - o indicador também plota marcas para os valores do VWAP e do preço da Abertura da sessão


Keyboard Shortcut & mouse:

Ação de Teclas / Mouse Descrição
 C  Centraliza indicador (último preço)
 R  Redefine os cálculos do VAP para o período selecionado
 Z  Zera o indicador e inicia os cálculos a partir do próximo tick
 Quando ativado, o VAP não redefine os cálculos e continua acumulando dados até um comando Reset (tecla R) ser executado. 
 Mouse Scroll  Rola a tela para cima ou para baixo
 Ctrl+Mouse Scroll rola a tela em intervalos maiores (4 linhas). 
 Quando Mouse Scroll é acionado, auto-center é desativado. Use a tecla de atalho C para reativar o auto-center
 Mouse Click & Drag Arrasta o indicador para cima/baixo.
Auto-center não é desativado


Produtos recomendados
Was: $249    Now: $149   Market Profile defines a number of day types that can help the trader to determine market behaviour. A key feature is the Value Area, representing the range of price action where 70% of trading took place. Understanding the Value Area can give traders valuable insight into market direction and establish the higher odds trade. It is an excellent addition to any system you may be using. Blahtech Limited presents their Market Profile indicator for the MetaTrader community.
149 USD
Waves PRO
Flavio Javier Jarabeck
For those who appreciate Richard Wyckoff approach for reading the markets, we at Minions Labs designed a tool derived - yes, derived, we put our own vision and sauce into this indicator - which we called Waves PRO . This indicator provides a ZigZag controlled by the market volatility (ATR) to build its legs, AND on each ZigZag leg, we present the vital data statistics about it. Simple and objective. This indicator is also derived from the great book called " The Secret Science of Price and Volum
35 USD
Supply and Demand Indicator + FREE Currency Strength Meter ADD-ON Looking for a powerful tool that can help you identify the most reactive zones in the forex market? Our supply and demand indicator for MetaTrader 4 and 5 is exactly what you need. With its advanced algorithms and real-time analysis, this indicator helps traders of all experience levels make informed trading decisions. The supply and demand indicator is a cutting-edge tool that helps traders identify areas where buyers and sellers
30 USD
A singularidade deste indicador reside no algoritmo de contabilidade de volume: a acumulação ocorre diretamente para o período selecionado sem referência ao início do dia. As últimas barras podem ser excluídas do cálculo, então os dados atuais terão menos influência sobre os níveis significativos (volumes) formados anteriormente. Para um cálculo mais preciso, os dados do gráfico M1 são usados por padrão. A etapa de distribuição dos volumes de preços é regulamentada. Por padrão, a borda direita d
35 USD
To download MT4 version please click here . This is the exact conversion from TradingView: "WaveTrend [LazyBear]" By "zeusuk3". One of the coolest indicators out there to detect overbought and oversold zones. It can be used as a part of more complicated strategy and for confirming a potential trade setup. There are buffers to use in EAs also. The indicator is loaded light and non-repaint. - You can message in private chat for further changes you need. Thanks for downloading 
40 USD
FabFlowInPrice
Fabiano Luiz Roberto
Tape Reading, monitoramento de fluxo. FabFlowInPrice é um poderoso indicador para quem gosta de Tape Reading (Times & Trades). Ele apresenta os volumes negociados em cada nível de preço, considerando para cada nível as agressões de compra, de venda e dos diretos. Excelente ferramenta para análise do fluxo de mercado. Pensou em fluxo então monitore quem está agredindo mais, compradores, vendedores ou trocas diretas. O indicador apresenta as informações em 4 períodos distintos e fixos, em qualq
150 USD
Este indicador permite-lhe desfrutar os dois produtos mais populares para analisar volumes de ofertas e das negociações no mercado a um preço favorável: Actual Depth of Market Chart Actual Tick Footprint Volume Chart Este produto combina o poder de ambos os indicadores e é fornecido como um único arquivo. Venda Anti-crise. Hoje com menor preço. Anda logo! A funcionalidade do COMBO Actual Depth of Market e Tick Volume Chart é totalmente idêntica aos indicadores originais. Você vai aproveitar o p
40 USD
No Demand No Supply MT5
Trade The Volume Waves Single Member P.C.
No Demand No Supply   This indicator identifies   No Demand –No Supply candles  to your chart and plots volume bars colored according to the signal. It can be applied to all timeframes or to a specific one only. It can also be used as regular volume indicator  with exceptional future of WEIGHTED VOLUME. Furthermore is has an alert notification, sound and email when a signals occurs. The indicator does not repaint but the alert will come on two candles back due to the definition of No Demand No S
80 USD
To get access to MT4 version please click here . - This is the exact conversion from TradingView: "Hull Suite" By "Insilico". - The indicator detects trend direction based on Hull algorithm. - Multiple inputs are available to optimize via strategy tester. - You have access to buffers to use in EAs. - This is a light-load processing and non-repaint indicator. - You can message in private chat for further changes you need.
40 USD
Wapv Price and volume
Eduardo Da Costa Custodio Santos
O Indicador WAPV Price and Volume para MT5 faz parte do conjunto de ferramentas do (Wyckoff Academy Wave Market) e ( Wyckoff Academy Price and Volume). O Indicador WAPV Price and Volume para MT5 foi criado para facilitar a visualização da movimentação do volume  no gráfico de forma intuitiva. Com ele você pode observar os momentos de pico de volume e momentos em que o mercado não tem interesse profissional Identificar momentos que o Mercado esta se movimentando por inércia e não por movim
40 USD
Pipfinite creates unique, high quality and affordable trading tools. Our tools may or may not work for you, so we strongly suggest to try the Demo Version for MT4 first. Please test the indicator prior to purchasing to determine if it works for you. We want your good reviews, so hurry up and test it for free...we hope you will find it useful. Combo Channel Flow with Strength Meter Strategy: Increase probability by confirming signals with strength Watch Video: (Click Here) Features Detects ch
88 USD
Você utiliza o volume na sua leitura do mercado? Certamente muitos traders usam, e não se imaginam operando sem ele. O indicador Color Histogram Volume Set permite que o usuário escolha o valor que ele considera interessante para monitorar. Ao ultrapassar este você terá a confirmação visual e se quiser terá também o alerta sonoro que é dado pelo indicador. Claro que existem outras maneiras de tentar encontrar um volume elevado, como avaliar se o v olume está acima da média, se é o maior vo
30 USD
Provided Trend is a complex signal formation indicator. As a result of the work of internal algorithms, you can see only three types of signals on your chart. The first is a buy signal, the second is a sell signal, and the third is a market exit signal. Options: CalcFlatSlow - The first parameter that controls the main function of splitting the price chart into waves. CalcFlatFast - The second parameter that controls the main function of splitting the price chart into waves. CalcFlatAvg - Par
100 USD
The Volume by Price Indicator for MetaTrader 5 features Volume Profile and Market Profile TPO (Time Price Opportunity). Get valuable insights out of currencies, equities and commodities data. Gain an edge trading financial markets. Volume and TPO histogram bar, line and metric charts. TPO letter and block marker charts including split structures. Positioning and styling options to suit the user's needs and context. Volume Profile and Market Profile TPO Point of Control (VPOC and TPOC), Imbalanc
259 USD
Blahtech Supply Demand MT5
Blahtech Limited
4.54 (13)
Was: $299    Now: $149   Supply Demand uses previous price action to identify potential imbalances between buyers and sellers. The key is to identify the better odds zones, not just the untouched ones. Blahtech Supply Demand indicator delivers functionality previously unavailable on any trading platform. This 4-in-1 indicator not only highlights the higher probability zones using a multi-criteria strength engine, but also combines it with multi-timeframe trend analysis, previously confirmed swi
149 USD
KT Double Top Bottom MT5
KEENBASE SOFTWARE SOLUTIONS
1 (1)
The double top bottom pattern is arguably one of the technical analysis's most popular chart patterns. These patterns are used to capitalize on recurring patterns and identify trend reversal patterns, thereby creating well-placed entry and exit levels. The KT Double Top Bottom is based on these patterns and fine-tunes the trade signal development process for traders. Features It's based on one of the most reliable trading patterns and brings some fine-tuning and automation to the process. A
30 USD
B Xtrender
Yashar Seyyedin
5 (1)
To download MT4 version please click here . This is the exact conversion from TradingView: "B-Xtrender" By "QuantTherapy". - It is an oscillator based on RSI and multiple layers of moving averages. -   It is a two in one indicator to calculate overbought and oversold zones for different RSI settings. -  This indicator lets you read the buffers for all data on the window. - This is a non-repaint and light processing load indicator. - You can message in private chat for further changes you need.
40 USD
To get access to MT4 version please click here . This is the exact conversion from TradingView: "[SHK] Schaff Trend Cycle (STC)" by "shayankm". This is a light-load processing indicator. This is a non-repaint indicator. Buffers are available for processing in EAs. All input fields are available. You can message in private chat for further changes you need. Thanks for downloading
40 USD
Market profile was developed by Peter Steidlmayer in the second half of last century. This is a very effective tool if you understand the nature and usage. It's not like common tools like EMA, RSI, MACD or Bollinger Bands. It operates independently of price, not based on price but its core is volume. The volume is normal, as the instrument is sung everywhere. But the special thing here is that the Market Profile represents the volume at each price level. 1. Price Histogram The Price Histogram
50 USD
here is a link to back test results https://youtu.be/9BYDwS9aaqM https://youtu.be/iLxh43HV91Y However, the difficult task here for traders is to understand and select the indicator or tool that can help them with their trading plan and benefit their trading style. Traders want a tool that requires minimal effort and provides as much support as it can. There are multiple reasons for which traders need an indicator. One such reason is to determine the buy-sell signals in the market. Th
500 USD
Market Marker MT5
Evgeny Shevtsov
3.8 (5)
The indicator displays peak levels of activity formed by the maximum volume, tracks the correlation of the candles on all timeframes (from the highest to the lowest one). Each volume level is a kind of key trading activity. The most important cluster is inside a month, week, day, hour, etc. Indicator operation features A volume level receives Demand status if the nearest volume level located to the left and above has been broken upwards. A volume level receives Supply status if the nearest vol
35 USD
Gioteen Volatility Index (GVI) - your ultimate solution to overcoming market unpredictability and maximizing trading opportunities. This revolutionary indicator helps you in lowering your losing trades due to choppy market movements. The GVI is designed to measure market volatility, providing you with valuable insights to identify the most favorable trading prospects. Its intuitive interface consists of a dynamic red line representing the volatility index, accompanied by blue line that indicate
100 USD
A huge number of traders use the VolumeProfile/MarketProfile analysis method. And I think there is no need to explain such concepts as POC and VAH/VAL. However, the standard VolumeProfile representation has a drawback - we only see the current picture of the market. We see the "convexity" of the volume distribution within the period. But we don't see the main thing - the "migration" of the POC level during the price movement. Our indicator is unique. It is dynamic. The first feature is that the
40 USD
Simple ATR modern
Pavel Bereznichenko
Indicator  Simple ATR  Modern It is used in technical analysis to measure market volatility and show it as a level that is more understandable to the eye and not as an oscillator. ATR Daily - Blue The possibilities of using the ATR in trade can be found in the internet. It can also be used in conjunction with another author's indicator  Volatility Vision The Average True Range indicator measures market volatility. Volatility can be low while the market is growing (and vice versa). It is
30 USD
VolumeProfile MT5
Robert Hess
3.57 (7)
Description: The Volume Profile displays detailed informations of historical trading activities at certain price levels (Market Profile). Locate the areas with the best prices in the market and get an advantage over other market participants. Support: The indicator is constantly being developed and improved. Please do not hesitate to contact me via the MQL5 Platform. I am very grateful about any Bug report, so that i can constantly improve the indicator. I appreciate any public review for this
140 USD
M & W Pattern Pro is an advanced scanner for M and W patters , it uses extra filters to ensure scanned patterns are profitable. The indicator can be used with all symbols and time frames. The indicator is a non repaint indicator with accurate statistics calculations. To use , simply scan the most profitable pair using the statistics dashboard accuracy , then enter trades on signal arrow and exit at the TP and SL levels. STATISTICS : Accuracy 1 : This is the percentage of the times price hit
89 USD
Before installing the HeatMap indicator make sure you are using a broker that gives you access to the Depth of market (DOM) !! This indicator creates a heatmap on your chart allowing you to see the buy or sell limit orders easily and in real time. You have the possibility to change the setting and the colors of the HeatMap in order to adapt to all markets and all charts. Here is an example of a setting you can use with the NASDAQ100 on the AMPGlobal broker :  https://www.youtube.com/watch?v=x0
80 USD
The best time to trade Using this Indicator is when the time reach exactly hour,half,45 minutes,15 minutes and sometimes 5 minutes.. This indicators is helpful to those who trade boom and crash indecies.How to read this indicator first you'll see Blue allow and Red allow all these allows used to indicate or to detect the spike which will happen so the allow happens soon before the spike happen.This indicator works properly only in boom and crash trading thing which you have to consider when
30 USD
FRB Trader - Nossa missão é proporcionar o melhor suporte para os clientes através do conteúdo e ferramentas para que eles consigam os resultados esperados FRB Suporte e Resistência - Indicador coloca linhas no gráfico para mostrar as regiões de Suporte e Resistência.  - Você pode escolher o tempo gráfico que deseja fazer o cálculo, como também as cores das linhas. - Algoritmo calcula os pontos onde são considerados pontos fortes do ativo e são de extrema importância para tomada de decisões.
50 USD
Weiss Wave com muitas funcionalidade e extremamente leve. O mesmo pode ser usado tanto no mercado brasileiro quanto no mercado exterior! Voce poderá:    - Analisar o volume do mercado pelos swings realizados!    - Definir a fonte dos dados apresentados no grafico, seu tamanho e cor! Ou simplesmente oculta essa informação!    - Definir se quer mostrar ou não os swings no grafico e quantos swings! Alem de definir a cor da linha de tendencia, espessura e estilo da linha de tendencia!    - Defini
70 USD
Os compradores deste produto também adquirem
IVISTscalp5
Vadym Zhukovskyi
5 (1)
Apresentamos a você o indicador iVISTscalp5, que não é apenas único, mas também eficaz em operações de negociação. Este indicador é baseado em dados de tempo e é o resultado de muitos anos de experiência e análise aprofundada dos mercados financeiros. O indicador iVISTscalp5 é uma excelente ferramenta para negociação manual. Conveniência, simplicidade e visualização - toda a complexidade está escondida dentro dele. Simplificamos as configurações e o uso do indicador iVISTscalp5 ao máximo. O indi
500 USD
Advanced Supply Demand MT5
Bernhard Schweigert
4.36 (11)
Atualmente com 33% de desconto! A melhor solução para qualquer Trader Novato ou especialista! Este indicador é uma ferramenta de negociação exclusiva, de alta qualidade e acessível porque incorporamos uma série de recursos proprietários e uma nova fórmula. Com esta atualização, você poderá mostrar fusos horários duplos. Você não só será capaz de mostrar um TF mais alto, mas também mostrar ambos, o TF do gráfico, MAIS o TF mais alto: MOSTRANDO ZONAS ANINHADAS. Todos os traders de Oferta e Demanda
199 USD
Este é sem dúvida o indicador de reconhecimento automático de formação de preço harmônico mais completo que você pode encontrar para a MetaTrader Platform. Ele detecta 19 padrões diferentes, leva as projeções de Fibonacci tão a sério quanto você, exibe a Zona de Reversão Potencial (PRZ) e encontra níveis adequados de stop loss e take-profit. [ Guia de instalação | Guia de atualização | Solução de problemas | FAQ | Todos os produtos ] Detecta 19 formações harmônicas de preços diferentes Tr
299 USD
Introduction to Fractal Pattern Scanner Fractal Indicator refers to the technical indicator that makes use of the fractal geometry found in the financial market. Fractal Pattern Scanner is the advanced Fractal Indicator that brings the latest trading technology after the extensive research and development work in the fractal geometry in the financial market. The most important feature in Fractal Pattern Scanner is the ability to measure the turning point probability as well as the trend probabil
185 USD
Este indicador é um indicador de análise automática de onda perfeito para negociação prática! A definição padronizada da banda não é mais uma onda de pessoas diferentes, e o desenho de interferências feitas pelo homem é eliminado, o que desempenha um papel fundamental na análise rigorosa da abordagem. =>Increase the choice of international style mode, (red fall green rise style)           Atualmente comprando desconto!   Conteúdo do índice: 1       Onda básica:   Primeiro, encontramos o
188 USD
Difícil de encontrar e com pouca frequência, as divergências são um dos cenários de negociação mais confiáveis. Este indicador localiza e verifica automaticamente divergências ocultas e regulares usando seu oscilador favorito. [ Guia de instalação | Guia de atualização | Solução de problemas | FAQ | Todos os produtos ] Fácil de trocar Encontra divergências regulares e ocultas Suporta muitos osciladores conhecidos Implementa sinais de negociação baseados em fugas Exibe níveis adequados de
249 USD
Introduction to X3 Chart Pattern Scanner X3 Cherart Pattern Scanner is the non-repainting and non-lagging indicator detecting X3 chart patterns including Harmonic pattern, Elliott Wave pattern, X3 patterns, and Japanese Candlestick patterns. Historical patterns match with signal patterns. Hence, you can readily develop the solid trading strategy in your chart. More importantly, this superb pattern scanner can detect the optimal pattern of its kind. In addition, you can switch on and off individu
250 USD
Bill Williams Advanced
Siarhei Vashchylka
5 (1)
Bill Williams Advanced is designed to analyze the chart according to Bill Williams' Profitunity system. The indicator analyzes the signals of the AO, AC indicators and places them in the panel in the upper left corner of the chart. In addition, using hot keys, the indicator instantly displays / hides the AO and AC indicators (for more details, see the video instructions). Description Each line of the indicator table represents the signals of the Profitunity system that are valid on the last fi
199 USD
VTrende Pro
Andrii Diachenko
VTrende Pro - MTF indicator for trend trading with a display panel for MT5 *** Videos can be translated into any language using subtitles (video language - Russian) Although the signals of the VTrende Pro indicator can be used as signals of a full-fledged trading system, it is recommended to use them in conjunction with the Bill Williams TS. VTrende Pro is an extended version of the VTrende indicator. Difference between Pro version and VTrende: - Time zones - Signal V - signal 1-2 waves
697 USD
Apresentamos o revolucionário indicador MT5, Traffic Signal - seu portal definitivo para o mundo do trading bem-sucedido! Projetado com precisão e expertise, o Traffic Signal opera com uma estratégia especial que aproveita o poder de indicadores técnicos avançados - RSI, Stochastics, CCI e Tendências - em todos os intervalos de tempo. Prepare-se para uma experiência de trading extraordinária, pois este indicador de última geração oferece os sinais mais precisos para entrada, permitindo que você
450 USD
Weis Wave with Alert MT5
Trade The Volume Waves Single Member P.C.
4.93 (14)
Get 30% Discount until 30/9/20203 on Lifetime package 420$ from 599$. Rental/Lifetime Package Options and Privileges  * For optimum results the yearly or lifetime package is suggested due to live training and Discord  channel trading with the  creator! Rent Monthly Six Months   Yearly/Lifetime Weis Wave with Speed with Alert+Speed Index x x x Manual  x x x Quick Set up Video x x x Blog x x x Lifetime Updates x x x Setup and Training Material x x Free Rectangle Break Alert Tool      x Discord
420 USD
Introduction Excessive Momentum Indicator is the momentum indicator to measure the excessive momentum directly from raw price series. Hence, this is an extended price action and pattern trading. Excessive Momentum Indicator was originally developed by Young Ho Seo. This indicator demonstrates the concept of Equilibrium Fractal Wave and Practical Application at the same time. Excessive Momentum detects the market anomaly. Excessive momentum will give us a lot of clue about potential reversal and
200 USD
Elliott Wave Trend was designed for the scientific wave counting. This tool focuses to get rid of the vagueness of the classic Elliott Wave Counting using the guideline from the template and pattern approach. In doing so, firstly Elliott Wave Trend offers the template for your wave counting. Secondly, it offers Wave Structural Score to assist to identify accurate wave formation. It offers both impulse wave Structural Score and corrective wave Structure Score. Structural Score is the rating to sh
200 USD
PZ Trend Trading MT5
PZ TRADING SLU
3.67 (3)
O Trend Trading é um indicador projetado para lucrar o máximo possível com as tendências que ocorrem no mercado, cronometrando retrocessos e rupturas. Ele encontra oportunidades de negociação analisando o que o preço está fazendo durante as tendências estabelecidas. [ Guia de instalação | Guia de atualização | Solução de problemas | FAQ | Todos os produtos ] Negocie mercados financeiros com confiança e eficiência Lucre com as tendências estabelecidas sem ser chicoteado Reconhecer retrocesso
249 USD
"Piranha" - an autonomous trading system that determines overbought and oversold levels on the chart. Red and blue zones represent overbought and oversold levels respectively. Entry points are marked with arrows: a downward arrow in the red zone for "sell" and an upward arrow in the blue zone for "buy". The Take profit level is indicated by the green moving average. Key features: Adjusting the Take profit level as the green moving average changes position. Averaging ability when a new market e
300 USD
PZ Swing Trading MT5
PZ TRADING SLU
5 (4)
Swing Trading é o primeiro indicador projetado para detectar oscilações na direção da tendência e possíveis oscilações de reversão. Ele usa a abordagem de negociação de linha de base, amplamente descrita na literatura de negociação. O indicador estuda vários vetores de preço e tempo para rastrear a direção da tendência agregada e detecta situações nas quais o mercado está sobrevendido ou sobrecomprado em excesso e pronto para corrigir. [ Guia de instalação | Guia de atualização | Solução de prob
249 USD
Description Very precise patterns to detect: entry signals as well as breakout, support and resistance reversal patterns. It points out zones in which, with a high probability, institutional orders with the potential to change the price’s direction and keep moving towards it, have been placed. Support:   We create great tools for the entire trading community. Most of them are free. If you believe in what we do  Support Us Here.   KEY LINKS:   Indicator Manual  -  All Products  How is this ind
280 USD
O Canal de Regressão LT é um sofisticado indicador técnico que incorpora princípios da análise de Fibonacci, análise de envelopes e extrapolação de Fourier. O indicador de envelopes é essencial para avaliar a volatilidade do mercado, enquanto a aplicação da análise de Fibonacci aprimora a precisão na identificação de níveis de sobrecompra e sobrevenda. Além disso, o componente de extrapolação de Fourier desempenha um papel crucial na previsão dos movimentos futuros do mercado, levando em cons
200 USD
PZ Day Trading MT5
PZ TRADING SLU
2.6 (5)
Este indicador detecta reversões de preços em zigue-zague, usando apenas análise de ação de preços e um canal donchiano. Ele foi projetado especificamente para negociações de curto prazo, sem repintar ou retroceder. É uma ferramenta fantástica para traders astutos, com o objetivo de aumentar o tempo de suas operações. [ Guia de instalação | Guia de atualização | Solução de problemas | FAQ | Todos os produtos ] Surpreendentemente fácil de negociar Fornece valor em cada período de tempo Imple
249 USD
The indicator is recommended to be used on D1. This version, unlike the version for MT4, does not have an additional filter. Peculiarities Suitable for all tools Many strategies; Important levels, recommendations; Flexibility in settings for different instruments and intervals. Signals B,S - predict the direction of movement of the candle at the beginning or at the close of the candle. Recommended TF from H4 and above. BuyStopLvl, SellStopLvl - levels that can be used to set Limit, Stop order
200 USD
Matreshka
Dimitr Trifonov
5 (1)
Matreshka self-testing and self-optimizing indicator: 1. Is an interpretation of the Elliott Wave Analysis Theory. 2. Based on the principle of the indicator type ZigZag, and the waves are based on the principle of interpretation of the theory of DeMark. 3. Filters waves in length and height. 4. Draws up to six levels of ZigZag at the same time, tracking waves of different orders. 5. Marks Pulsed and Recoil Waves. 6. Draws arrows to open positions 7. Draws three channels. 8. Notes support and re
245 USD
INTRODUCING WORLD'S FIRST MT5 "AUTO SCALE" Naveen Geometric Square with Circle To Analyze Markets Geometric Relationship. Naveen's Geometric Square  has some of the most impressive features you will ever find in Gann & Geometric Analysis world. The Naveen's Geometric Square  is a Powerful method of squaring TIME AND PRICE .It is a free-hand drawing tool giving you control of the size of the box. The internal diagonals, grid-lines and angles can be Enabled/ Disabled. All square diagonals lik
1 299 USD
Robos
Namu Makwembo
5 (2)
Big promotion on the Robos, Get yours now Robos Indicator The   ROBOS   indicator is a multi timeframe oscillator that targets the   overbought   and   oversold  regions of a price chart, a signal is indicated by the two lines crossing, compatible with all tradable instruments Latest Release The latest release is the version 4.0 #What's new in version 4.0 ? Features Extreme oversold and overbought levels ROBOS version  4.0  comes with cool new feature , the ability to target on
255 USD
WAPV Full MT5
Eduardo Da Costa Custodio Santos
## Se você não conseguir utilizar a versão demo , por favor entrar em contato por mensagem. ## Opere de forma Profissional utilizando o WAPV Full e consiga rastrear aonde esta o dinheiro dos Grandes Players Funciona em qualquer Mercado que tenha Preço e Volume , FUTUROS, FOREX, CRIPTOS, AÇÕES, CFDS... Imagine você ter em suas mão uma ferramenta que sozinha faz a leitura dos grandes Players do Mercado, mostrando as melhores regiões de negociação com base da análise de Preço e Volume. O WAP
199 USD
Offer 249 down from 350 for the next 1 copies. then back to 350 $ Are you tired of using outdated indicators that leave you guessing where to set your profit targets? Look no further than the AK CAP Opening Range Breakout Indicator. This powerful tool is backed by a US patent and has already helped countless traders pass funded challenges like FTMO. We use it daily on our prop traders and internal funds, and now it's available to you as well. The calculation behind the indicator is incredibly
249 USD
Please send me Direct message on MQL5 CHAT after purchasing the Indicator for Training and Installation Support There are some additional files that is important to use with the Indicator . So be sure to contact me after purchasing the Indicator So that I can add you for training and support . If you find any difficulty with installation then send me Direct message here So that I can connect with you via Anydesk or Teamview for the product installation. " Smart Order Block Indicator " to find
249 USD
Multi-currency, multi-timeframe, harmonic pattern indicator AB = CD. Supports sending push notifications about signals to a mobile device, messages on e-mail, as well as messages using alerts on all available currency pairs and timeframes. This indicator was based on the indicator Harmonic ABCD Universal. Version for MetaTrader 5:  https://www.mql5.com/en/market/product/44972 . See also: Harmonic ABCD Universal for MetaTrader 4 . Using modern software development methods has made the indicator a
230 USD
[ MT4 Version ] Order Block Indicator MT5 Order Block Indicator MT5 is currently the most accurate and customizable indicator in the market. It has been developed to facilitate the analysis of operations based on Order Blocks and Supply and Demand Zones. These zones are possible reversal points of a movement. Order Blocks indicate a possible accumulation of orders in one area. The price usually gets to reach and react strongly to those areas. The most relevant levels for this reaction are the c
224 USD
Incinerat8
Paulos Ngwenya
This algorithm uses real time data to generate signals with an accuracy rate of 80%. It shows entries and where you should place both the stoploss and the take profit for each trade. It determines trend! It can even help you to become a signal provider! And it can generate up to 8 signals a day! You get access to a free forex trading community  Operates on any broker compatible to synthetic indices and forex   if you need any assistance whatsapp +2774 35 35 744 or telegram link @pipsempire01
400 USD
Volume Confluence
Mussadiq Abdul Rahim
Atenção! Antes de utilizar nosso produto, é importante ler atentamente o aviso legal em inglês. Nosso produto é projetado para fornecer informações sobre possíveis tendências do mercado e movimentos de preços. No entanto, não podemos garantir a obtenção de lucros ou resultados específicos na negociação. A negociação nos mercados financeiros envolve riscos, e não nos responsabilizamos por possíveis perdas. Todas as informações adicionais podem ser encontradas no aviso legal em inglês.
1 000 USD
Filtro:
808
72
808 2020.11.02 12:19 
 

0 don't waste your money you can't contact the dev, indicator doesn't work at all

Savio Araujo
291
Resposta do desenvolvedor Savio Araujo 2022.03.14 02:15
Sorry for the late reply. My account had been blocked. The Volume at Price indicator only works if the broker provides all tick information for the symbol. As long as the broker provides this information, the indicator works both in exchange or futures market.
Responder ao comentário
Versão 1.10 2022.05.15
Atualizado para a Build 3280 do Metatrader