• Visão global
  • Comentários
  • Discussão

Pattern Finder 2

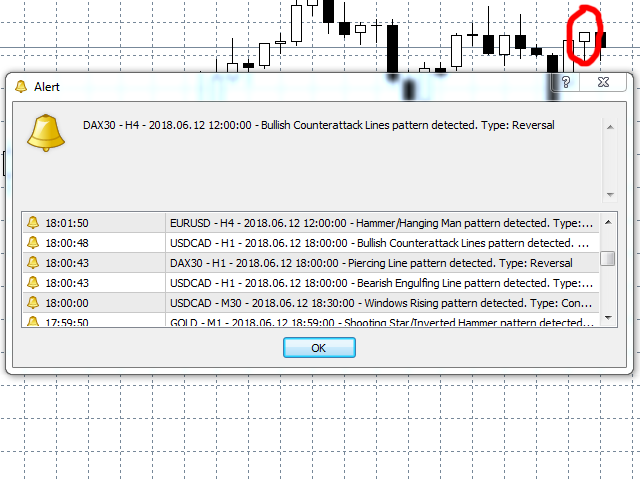
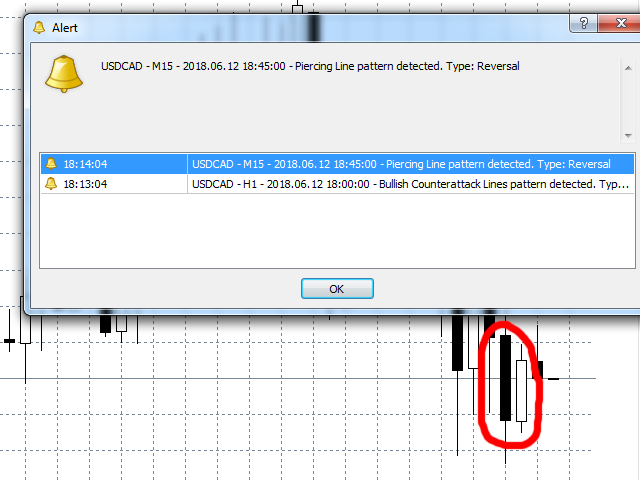
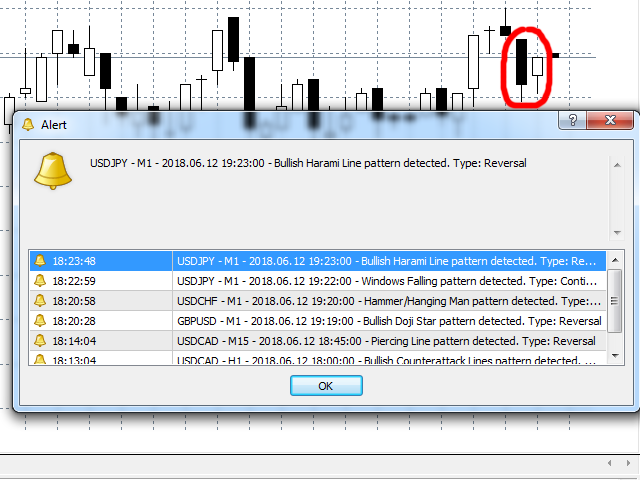
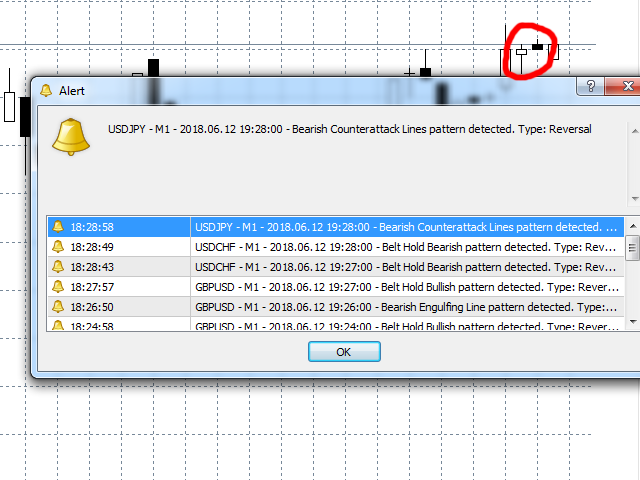
Pattern Finder 2 is a MULTICURRENCY indicator that scans the entire market seeking for up to 62 candlestick patterns in 15 different pairs/currencies all in one chart. It will help you to make the right decision in the right moment.

You can filter the scanning following the trend by a function based on exponential moving average.

You can setup parameters by an interface that appears by clicking the arrow that appear on the upperleft part of the window after you place the indicator.

Parameters are divided in panels:

Options:

Trend filter ON/OFF: verify the actual trend of your currencies and notify a pattern only if it is found in the right trend; for example Evening Star is a pattern that usually indicates an inversion of the trend from bullish to bearish so it will be notified only if the actual trend is bullish.

Trend period: trend is calculated on exponential moving average, this option is an integer type that will set the number of periods for calculation of the ema.

Trend n. bars: is an integer that indicates the count of the consecutive number of bars that has the same trend before an alert is sent. Sensivity: It's an integer number between [-5,5] that define the minumum and maximum lenght of candles characteristic for a pattern to be recognized. For patterns where is important the lenght of the body it define the minimum or maximum body dimension, for pattern where is important the the lenght of the shadows it define the minimum or maximum lenght of the shadows; higher is the number more sensitive is the pattern tracing (smaller body or shadows). Pattern with candles out of the range of sensivity will not be recognized.

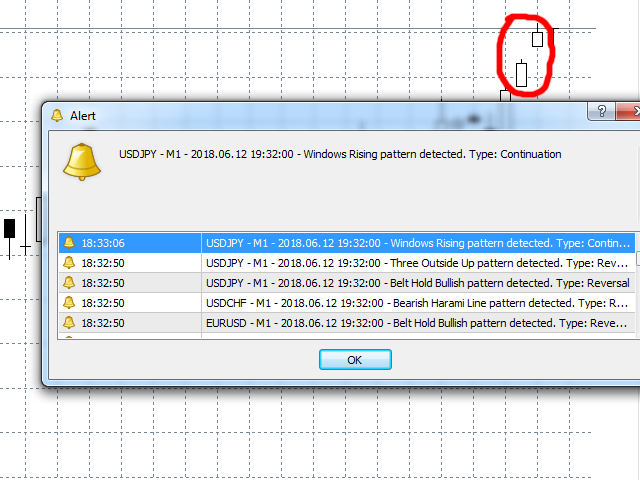
Alert Pop Up: enables or disable screen alters.

Send email: enable or disable email alerts.

Push on mobile: enable or disable push notification on mobile.

Patterns: You'll find a list with inversion patterns and a list of continuation pattern; by clicking on the pattern name a window will appear with a graphic explanation of the pattern,the conditions necessary for the pattern to be found, the frequency and the efficiency of the pattern (based on my experience), and a button to turn it on/off. You can also enable or disable all the inversion or continuation pattern by the check near the name.

Currencies: here you can select up to 15 different currencies that are in your market. Click on one of the positions then from the list on the right click on the currenchy you want to assign. The indicator will scan the specified currencies.

Save: You can save the current settings for the next time you'll start pattern finder again.

Load: You can load previous saved settings.

Remember to click the apply button when you modify something otherwise changes will not be applied.

Here is a list of patterns implemented:

Inversion patterns: Dark Cloud Cover Piercing Line Evening Star Morning Star Bullish Belt Hold Line Bearish Belt Hold Line Hammer/Hanging Man Bullish Doji Star Bearish Doji Star Bullish Counter Attack Lines Bearish Counter Attack Lines Bullish Engulfing Line Bearish Engulfing Line Bullish Harami Line Bearish Harami Line Homing Pigeon Discending Hawk Identical Three Crows Three White Soldiers Shooting Star/Inverted Hammer Bullish Stick Sandwich Bearish Stick Sandwich Three Inside Up Three Inside Down Three Outside Up Three Outside Down Above The Stomach Below The Stomach Bullish Three Doji Stars Bearish Three Doji Stars Three Stars North Three Stars South Ladder Top Ladder Bottom Bullish Breakaway Bearish Breakaway

Continuation patterns: Doji Gapping Up Doji Gapping Down Upside Gap Three Methods Downside Gap Three Methods Bullish Separating Lines Bearish Separating Lines Windows Rising Windows Falling Thrusting Line During Uptrend Thrusting Line During Downtrend Upside Tasuki Gap Downside Tasuki Gap Bullish Side By Side White Lines Bearish Side By Side White Lines Uptrend Windows Downtrend Windows Bullish Three Line Strike Bearish Three Line Strike Rising Three Methods Falling Three Methods Upside In Neck Method Downside In Neck Method Bullish Mat Hold Bearish Mat Hold High Price Gapping Play Low Price Gapping Play

We recommend to save configuration (by using the save button) for later use.


Produtos recomendados
////////////////////////////////////////////////////// // ////////////////////////////////////////////////////// //// /////////////////////////////////////// Go My Way é um indicador ultrapreciso da direção da tendência ou do movimento dos preços. Este indicador é calculado com base em uma dúzia de outros indicadores e tem um mecanismo muito complexo. ////////////////////////////////////////////////////// // ////////////////////////////////////////////////////// //// /////////////////////
Fibrillar
Vitalii Zakharuk
It is very easy to use the Fibrillar indicator, since the simplest is to look at the chart and act according to the indications of the colored arrows. The algorithm takes into account the measurement of prices, and this method also focuses on measuring each of the price drops (H / C, H / O, LC, LO) - which gives more detailed information, but also more averaged. When calculating this indicator, logarithmic gains are first calculated at the closing price, which allows you to filter out the tre
Este é um indicador de tendência. O indicador reflete milhares de mudanças nos preços de mercado usando uma linha real vermelha e verde. A mudança na cor da linha real indica que o mercado mudou e é altamente provável que haja uma reversão! A linha verde indica que o preço de mercado está em um período de alta. A linha vermelha indica que o preço de mercado está em um período de baixa.
CandelTimer MT5
Kambiz Shahriarynasab
300 downloads without review ? !!!! If continued. I will not share any product for free. :( Small and very simple timer next to the current price to show the end time of the current candle Very useful and important for scalpers and those who work on price action.   We assure you that we welcome any suggestions to improve this indicator and make the necessary changes to improve this indicator. You can contact us via Instagram, Telegram, WhatsApp, email or here. We are ready to answer you.
Most time the market is in a small oscillation amplitude. The Trade Area indicator helps users to recognize that time. There are 5 lines in this indicator: Area_high, Area_middle, Area_Low, SL_high and SL_low. Recommendations: When price is between Area_high and Area_Low, it's time to trade. Buy at Area_Low level and sell at Area_high level. The SL_high and SL_low lines are the levels for Stop Loss. Change the Deviations parameter to adjust SL_high and SL_low.
Pips on Candles shows the number of pips involved in each candle on the chart. It is possible to set 3 different ranges for counting on each single candle via the RangeType parameter: With "HighLow" you count the pips present between the minimum and the maximum. The number is shown under each candlestick on the chart. With "OpenClose" you count the pips present between the opening and closing price of the candle. The number is shown under each candlestick on the chart. With "HighDistAndLowDist"
Gold Targets   são o melhor indicador de tendência. O algoritmo exclusivo do indicador analisa o movimento do preço do ativo, levando em consideração fatores de análise técnica e matemática, determina os pontos de entrada mais rentáveis, emite um sinal em forma de seta e o nível de preço (ENTRADA DE COMPRA / Entrada de VENDA) para abra um pedido. O indicador também exibe imediatamente o nível de preço para Stop Loss e cinco níveis de preços para Take Profit. ATENÇÃO:   O indicador é muito fác
Engulfing Candlestick Bulkowski The engulfing candlestick is a well-known candle pattern composed of two candles. This indicator for showing engulfing candlestick that describe by Thomas Bulkowski. If you need for MetaTrader 4 version, please visit here: https://www.mql5.com/en/market/product/34193 Feature Highlights Show bullish engulfing and bearish engulfing. Customizable "Up Symbol". Customizable "Down Symbol". Customizable symbol distance from candlestick. Customizable "Down Color". Cus
Hello This Indicator will draw Green (Up) and Red (Down) small arrows from Multi TimeFrames based in ( MACD ) to help you to take decision to buy or sell or waiting If there 4 green arrows in same vertical line that's mean (Up) and If there 4 Red arrows in same vertical line that's mean (Down)  and the options contain (Alert , Mobile and Mail Notifications). Please watch our video for more details https://youtu.be/MVzDbFYPw1M and these is EA for it https://www.mql5.com/en/market/product/59092 G
Индикатор для отображения свеч размером меньше одной минуты, вплоть до размера в одну секунду, для детализированного просмотра графика . Имеется ряд необходимых настроек для удобной визуализации. Настройка размера хранения истории ценовых данных транслируемых инструментов. Размер видимых свеч. Настройка отображения неподвижности на курсах графика. Возможность отображения на различных торговых инструментах.  Удачной всем торговли.
MT4 Version Available Here:  https://www.mql5.com/en/market/product/43528 Telegram Channel & Group :  https://t.me/bluedigitsfx V.I.P Group Access:   Send Payment Proof of any of our Paid Products to our Inbox Recommended Broker:   https://eb4.app/BDFXOsprey * The Most Sought After Pip Counter for Metatrader ! Features Will show Currency Symbol in BLUE for Buy positions. Will show Currency Symbol in RED for Sell positions. Will Show pips in BLUE Color for Positive Pips Will Show pips in
FREE
This indicator will draw a label above or below each candle based on   Rob Smith's   The Strat   as they develop over time on your chart. As price evolves, a candle can switch between three states. When the candle first opens, if it sits completely within the previous candles high and low, then it will start as a Type 1. As time moves on, if it breaks either the high or low of the previous candle, it will be come a type 2, and should the price action be volatile and directionless, it may then
Este indicador plota nos candles a divergência encontrada no indicador selecionado e também pode enviar uma notificação por email e/ou para o celular. Funciona em todos os TIMEFRAMES. Conheça Nossos Produtos   Ele identifica as divergência nos indicadores: Índice de Força Relativa (RSI); Convergência e Divergência de Média Móvel (MACD); Saldo de Volume (OBV) e; Oscilador Estocástico(STOCHASTIC). Há possibilidade de escolher a amplitude de verificação da divergência e o indicador há ser
** All Symbols x All Timeframes scan just by pressing scanner button ** *** Contact me after the purchase to send you instructions and add you in "ABCD scanner group" for sharing or seeing experiences with other users. Introduction This indicator scans AB=CD retracement patterns in all charts. The ABCD is the basic foundation for all harmonic patterns and highly repetitive with a high success rate . The ABCD Scanner indicator is a scanner reversal ABCD pattern that helps you identify when the pr
The Antique Trend Indicator is a revolutionary trend trading and filtering solution with all the important features of a trend tool built into one tool! The Antique Trend indicator is good for any trader, suitable for any trader both for Forex and binary options. There is no need to configure anything, everything has been perfected by time and experience, it works great during flats and trends. The Antique Trend indicator is a tool for technical analysis of financial markets, reflecting curre
FRB Agressão de Venda  -  Indicador mostra o Saldo da   Agressão Vendedora   do TIMEFRAMES escolhido pelo usuário através de um histograma numa nova janela. - Este indicador só pode ser usado se a corretora informa os dados sobre os Volumes. As corretoras do mercado forex não informam esses dados. - B3 (Bovespa) informa os dados e com isso é possível usar nas corretoras brasileiras. Configurações Cor - Definir a cor que será mostrada no histograma. Usar Dados Históricos - Define se o indic
O Painel de Alerta de ADR mostra rapidamente onde o preço está sendo negociado atualmente em relação ao seu intervalo médio diário normal. Você receberá alertas instantâneos via pop-up, e-mail ou push quando o preço exceder o intervalo médio e os níveis acima de sua escolha, para que você possa pular para retrocessos e reversões rapidamente. O traço foi projetado para ser colocado em um gráfico em branco e apenas ficar no fundo e alertá-lo quando os níveis forem atingidos, para que você não pre
Candle Trend Bars
Muhammed Emin Ugur
Unlock the power of trend analysis with the Candle Trend Bars Indicator – your go-to tool for identifying and understanding market trends like never before. This innovative indicator transforms traditional candlestick charts into a dynamic and visually intuitive representation of market trends. Key Features: Trend Clarity: Gain a clear and concise view of market trends with color-coded bars that instantly convey the direction of price movements. User-Friendly Design: The indicator is designed wi
FREE
Range profile
Mikhail Nazarenko
Индикатор автоматически рассчитывает уровень и  реальный объем   Point of control, а так же отображает профиль рынка для массива свечей, в границах прямоугольника. Если ваша стратегия основана на взятии прибыли на отскоке от ценовых накоплений, индикатор Range profile станет главным инструментом в торговле скальпингом. Рассчет Point of control осуществляется на основе рассчета суммарного объема для каждого тика или по минутным свечам, в зависимости от настроек и таймфрейма торговли. При отсутств
Easy BySell is a market indicator for opening and closing positions. It becomes easy to track market entries with the alerts. It indicates the trend reversal points when a price reaches extreme values and the most favorable time to enter the market. My other products  with its advanced technology   ( artificial neural networks )  :   https://www.mql5.com/en/users/incepline/seller The algorithm is based on ATR and Stochastic Oscillator indicators. You can modify these two parameters as you
Try   My Signal   =   https://www.mql5.com/en/signals/2093706?source=Site+Signals+My If you don't have time to analysis the chart then check out my above trading   SIGNAL . This indicator is used to identify key levels where the trend in price has a greater probability of halting and possibly changing direction. Interpretation of the degree of significance of a level depends on a trader's time frame. It is great to see how the prices respect each level of this support and resistance. This Ind
Best SAR MT5
Ashkan Hazegh Nikrou
5 (1)
Descrição :  estamos felizes em apresentar nosso novo indicador gratuito baseado em um dos indicadores profissionais e populares no mercado forex (PSAR) este indicador é uma nova modificação no indicador SAR parabólico original, no indicador pro SAR você pode ver o cruzamento entre os pontos e o gráfico de preços, este crossover não é sinal, mas fala sobre o potencial de fim de movimento, você pode começar a comprar pelo novo ponto azul e colocar o stop loss um atr antes do primeiro ponto azu
FREE
Was: $249  Now: $99   Market Profile defines a number of day types that can help the trader to determine market behaviour. A key feature is the Value Area, representing the range of price action where 70% of trading took place. Understanding the Value Area can give traders valuable insight into market direction and establish the higher odds trade. It is an excellent addition to any system you may be using. Inspired by Jim Dalton’s book “Mind Over Markets”, this indicator is designed to suit the
MTF Stoch
Zhi Quan Xiao
This is a multi frame stochastic indicator, you can attach any time frame of stoch indicator on one chart. It is very useful if you like to check multi time frame stoch data. If you are interested in EA,click below links to take a look: https://www.mql5.com/en/market/product/80170 https://www.mql5.com/en/market/product/81136 How to use: > Atach the first time frame you want on to the currency pair's chart > Atach the second time frame you want on to the currency pair's   chart > Atach the thir
FREE
The Rocket Trend indicator is trending. The indicator draws two-color points connected by lines along the chart. This is a trend indicator, it is an algorithmic indicator. It is easy to work and understand when a blue circle appears, you need to buy, when a red one appears, sell. The indicator is used for scalping and pipsing, and has proven itself well. Rocket Trend is available for analyzing the direction of the trend for a specific period of time. Ideal for novice traders learning the laws o
The Riko Trend indicator is a revolutionary trend trading and filtering solution with all the important features of a trend tool built into one tool! The Riko Trend indicator is good for any trader, suitable for any trader for both forex and binary options. You don’t need to configure anything, everything is perfected by time and experience, it works great during a flat and in a trend. The Riko Trend indicator is a technical analysis tool for financial markets that reflects the current price
It's a self-learning indicator. You need to set a starting time and download the relevant historical data for it to learn. Learn as few rules as possible and give the maximum freedom to the indicators. Therefore, the principle of choosing the best outcome during the learning period does not guarantee that every transaction is profitable. In general, the longer the study, the more reliable the results. In the strategy tester, you need to set the time parameter before the test starts so that the i
Exclusive Limited Time Offer! Grab this useful indicator for a lifetime at just $49. Note: It is requested that purchases must be refrained from if the buyer is from India, Bangladesh, or Pakistan, as developer support for these regions is unavailable due to legal restrictions. Volatility indicator dashboard designed to revolutionize how traders perceive and navigate market volatility. Track volatile for multiple currency pairs one at time for multiple timeframes. Works best with Forex Market,
- This is the exact conversion from TradingView: "Support/Resistance" By "BarsStallone". - This indicator lets you read the buffers for R/S values. - This is a non-repaint and light processing load indicator. - This is not a multi time frame indicator If you want the multi time frame version you should create a personal order and I deliver two files that you need them both to have the multi time frame indicator running on your system. - The MT4 version of the indicator is not light load from pr
**   All Symbols   x   All Timeframes   scan just by pressing scanner button ** *** Contact me after the purchase to send you instructions and add you in "Head & Shoulders Scanner group" for sharing or seeing experiences with other users. Introduction: Head and Shoulders   Pattern  is a very repetitive common type of price reversal patterns.   The pattern appears on all time frames and can be used by all types of traders and investors.   The  Head and Shoulders  Scanner indicator  Scans All char
Os compradores deste produto também adquirem
Atomic Analyst MT5
Issam Kassas
3.64 (11)
Primeiramente, vale ressaltar que este Indicador de Negociação não repinta, não redesenha e não apresenta atrasos, tornando-o ideal tanto para negociação manual quanto automatizada. O Analista Atômico é um Indicador de Ação de Preço PA que utiliza a força e o momentum do preço para encontrar uma vantagem melhor no mercado. Equipado com filtros avançados que ajudam a remover ruídos e sinais falsos, e aumentam o potencial de negociação. Utilizando múltiplas camadas de indicadores complexos, o A
Primeiramente, vale ressaltar que este Sistema de Trading é um Indicador Não Repintado, Não Redesenho e Não Atrasado, o que o torna ideal tanto para o trading manual quanto para o automatizado. O "Sistema de Trading Inteligente MT5" é uma solução completa de trading projetada para traders novos e experientes. Ele combina mais de 10 indicadores premium e apresenta mais de 7 estratégias de trading robustas, tornando-o uma escolha versátil para diversas condições de mercado. Estratégia de Seguime
Quantum Trend Sniper
Bogdan Ion Puscasu
5 (37)
Apresentando       Quantum Trend Sniper Indicator   , o inovador Indicador MQL5 que está transformando a maneira como você identifica e negocia as reversões de tendência! Desenvolvido por uma equipe de traders experientes com experiência comercial de mais de 13 anos,       Indicador de Atirador de Tendência Quântica       foi projetado para impulsionar sua jornada de negociação a novos patamares com sua forma inovadora de identificar reversões de tendência com precisão extremamente alta. ***C
Trend Screener Pro MT5
STE S.S.COMPANY
4.89 (61)
Desbloqueie o poder da negociação de tendências com o indicador Trend Screener: sua solução definitiva de negociação de tendências, alimentada por lógica difusa e sistema de múltiplas moedas! Eleve sua negociação de tendências com o Trend Screener, o revolucionário indicador de tendências alimentado por lógica difusa. É um poderoso indicador de acompanhamento de tendências que combina mais de 13 ferramentas e recursos premium e 3 estratégias de negociação, tornando-o uma escolha versátil para to
Gold Stuff mt5
Vasiliy Strukov
4.89 (166)
Gold Stuff mt5-um indicador de tendência projetado especificamente para o ouro, também pode ser usado em qualquer instrumento financeiro. O indicador não é redesenhado ou atrasado. O timeframe recomendado é H1. Importante! Entre em contato comigo imediatamente após a compra para obter instruções e bônus! PARÂMETRO Draw Arrow-incl.desligado. desenhar setas no gráfico. Alertas-ligado.desligado.alertas sonoros. E-mail notification-incl.desligado. notificações por e-mail. Puch-notification-at
FX Volume MT5
Daniel Stein
4.94 (17)
Receba a sua atualização diária do mercado com detalhes e screenshots através do nosso Morning Briefing aqui no mql5 e no Telegram ! O Volume FX é o PRIMEIRO e ÚNICO indicador de volume que fornece uma visão REAL do sentimento do mercado do ponto de vista de um corretor. Ele fornece uma visão incrível de como os participantes do mercado institucional, como corretores, estão posicionados no mercado Forex, muito mais rápido do que os relatórios COT. Ver essas informações diretamente no seu gráfi
FX Power MT5 NG
Daniel Stein
5 (4)
Receba a sua atualização diária do mercado com detalhes e screenshots através do nosso Morning Briefing aqui no mql5 e no Telegram ! O FX Power MT5 NG é a próxima geração do nosso medidor de força de moeda muito popular de longa data, o FX Power. E o que é que este medidor de força da próxima geração oferece? Tudo o que adorou no FX Power original MAIS Análise de força GOLD/XAU Resultados de cálculo ainda mais precisos Períodos de análise configuráveis individualmente Limite de cálculo personal
Antes de tudo, vale ressaltar que esta Ferramenta de Negociação é um Indicador Não Repintante, Não Redesenhante e Não Atrasado, o que a torna ideal para negociação profissional. O Indicador de Conceitos de Ação de Preço Inteligente é uma ferramenta muito poderosa tanto para traders novos quanto experientes. Ele combina mais de 20 indicadores úteis em um único, combinando ideias avançadas de negociação como Análise do Trader do Círculo Interno e Estratégias de Negociação de Conceitos de Dinhei
Advanced Supply Demand MT5
Bernhard Schweigert
4.53 (15)
Atualmente com 33% de desconto! A melhor solução para qualquer Trader Novato ou especialista! Este indicador é uma ferramenta de negociação exclusiva, de alta qualidade e acessível porque incorporamos uma série de recursos proprietários e uma nova fórmula. Com esta atualização, você poderá mostrar fusos horários duplos. Você não só será capaz de mostrar um TF mais alto, mas também mostrar ambos, o TF do gráfico, MAIS o TF mais alto: MOSTRANDO ZONAS ANINHADAS. Todos os traders de Oferta e Demanda
RelicusRoad Pro MT5
Relicus LLC
4.81 (21)
Agora US $ 147 (aumentando para US $ 499 após algumas atualizações) - Contas ilimitadas (PCs ou Macs) Manual do usuário do RelicusRoad + vídeos de treinamento + acesso ao grupo de discórdia privado + status VIP UMA NOVA FORMA DE OLHAR PARA O MERCADO O RelicusRoad é o indicador de negociação mais poderoso do mundo para forex, futuros, criptomoedas, ações e índices, oferecendo aos traders todas as informações e ferramentas necessárias para se manterem rentáveis. Fornecemos análises técnica
XQ Indicator MetaTrader 5
Marzena Maria Szmit
5 (1)
Step into the realm of Forex trading with confidence and precision using XQ, a cutting-edge Forex indicator designed to elevate your trading game to unprecedented heights. Whether you're a seasoned trader or just stepping into the world of currency exchange, XQ Forex Indicator empowers you with the insights and signals needed to make informed trading decisions. The signal conditions are a combination of three indicators, and XQ Forex Indicator only display  medium and long-term trends . The ind
The Volume by Price Indicator for MetaTrader 5 features Volume Profile and Market Profile TPO (Time Price Opportunity). Get valuable insights out of currencies, equities and commodities data. Gain an edge trading financial markets. Volume and TPO histogram bar and line charts. Volume Footprint charts. TPO letter and block marker charts including split structures. Versatile segmentation and compositing methods. Static, dynamic and flexible ranges with relative and/or absolute visualizations. Lay
Apresentando       Quantum Breakout PRO   , o inovador Indicador MQL5 que está transformando a maneira como você negocia Breakout Zones! Desenvolvido por uma equipe de traders experientes com experiência comercial de mais de 13 anos,       Quantum Breakout PRO       foi projetado para impulsionar sua jornada comercial a novos patamares com sua estratégia de zona de fuga inovadora e dinâmica. O Quantum Breakout Indicator lhe dará setas de sinal em zonas de breakout com 5 zonas-alvo de lucro e
Este é um indicador para MT5 que fornece sinais precisos para entrar em uma negociação sem redesenhar. Ele pode ser aplicado a qualquer ativo financeiro: forex, criptomoedas, metais, ações, índices. Ele fornecerá estimativas bastante precisas e informará quando é melhor abrir e fechar um negócio. Assista o vídeo (6:22) com um exemplo de processamento de apenas um sinal que compensou o indicador! A maioria dos traders melhora seus resultados de negociação durante a primeira semana de negociação c
ICT, SMC, SMART MONEY CONCEPTS, SMART MONEY, Smart Money Concept, Support and Resistance, Trend Analysis, Price Action, Market Structure, Order Blocks, BOS/CHoCH,   Breaker Blocks ,  Momentum Shift,   Supply&Demand Zone/Order Blocks , Strong Imbalance,   HH/LL/HL/LH,    Fair Value Gap, FVG,  Premium  &   Discount   Zones, Fibonacci Retracement, OTE, Buy Side Liquidity, Sell Side Liquidity, BSL/SSL Taken, Equal Highs & Lows, MTF Dashboard, Multiple Time Frame, BigBar, HTF OB, HTF Market Structure
AW Trend Predictor MT5
AW Trading Software Limited
4.76 (54)
A combinação de níveis de tendência e quebra em um sistema. Um algoritmo de indicador avançado filtra o ruído do mercado, determina a tendência, os pontos de entrada e os possíveis níveis de saída. Os sinais indicadores são registrados em um módulo estatístico, que permite selecionar as ferramentas mais adequadas, mostrando a eficácia do histórico do sinal. O indicador calcula as marcas Take Profit e Stop Loss. Manual e instruções ->   AQUI   / versão MT4 ->   AQUI Como negociar com o indicador
Auto Order Block with break of structure based on ICT and Smart Money Concepts Futures Break of Structure ( BoS )             Order block ( OB )            Higher time frame Order block / Point of Interest ( POI )    shown on current chart           Fair value Gap ( FVG ) / Imbalance   ,  MTF      ( Multi Time Frame )    Volume Imbalance     ,  MTF          vIMB Gap’s Equal High / Low’s     ,  MTF             EQH / EQL Liquidity               Current Day High / Low           HOD /
Blahtech Supply Demand MT5
Blahtech Limited
4.57 (14)
Was: $299  Now: $99   Supply Demand uses previous price action to identify potential imbalances between buyers and sellers. The key is to identify the better odds zones, not just the untouched ones. Blahtech Supply Demand indicator delivers functionality previously unavailable on any trading platform. This 4-in-1 indicator not only highlights the higher probability zones using a multi-criteria strength engine, but also combines it with multi-timeframe trend analysis, previously confirmed swings
O Indicador de Quadrados de Gann é uma poderosa ferramenta de análise de mercado baseada no artigo "Fórmula Matemática para Previsões de Mercado" escrito por W.D. Gann, que se baseia em conceitos matemáticos para análise. Ele incorpora elementos das técnicas de Gann relacionadas com os quadrados de 144, 90 e 52, bem como o quadrado de 9. Além disso, inclui o método do  sobre como combinar o quadrado de 9 com canais e padrões de estrela. Manual do Usuário e Modo de Uso: Antes de usar este indicad
TrendMaestro5
Stefano Frisetti
note: this indicator is for METATRADER4, if you want the version for METATRADER5 this is the link:  https://www.mql5.com/it/market/product/108106 TRENDMAESTRO recognizes a new TREND in the bud, he never makes mistakes. The certainty of identifying a new TREND is priceless. DESCRIPTION TRENDMAESTRO identifies a new TREND in the bud, this indicator examines the volatility, volumes and momentum to identify the moment in which there is an explosion of one or more of these data and therefore the mome
Torne-se um Negociador Breaker e lucre com as mudanças na estrutura do mercado à medida que o preço reverte. O indicador de quebra de bloco de pedidos identifica quando uma tendência ou movimento de preço está chegando à exaustão e pronto para reverter. Ele o alerta sobre mudanças na estrutura do mercado, que normalmente ocorrem quando uma reversão ou uma grande retração está prestes a ocorrer. O indicador usa um cálculo proprietário que identifica rupturas e momento do preço. Toda vez que
Trend Line Map Pro MT5
STE S.S.COMPANY
4.67 (9)
O indicador Trend Line Map é um complemento do Trend Screener Indicator. Ele funciona como um scanner para todos os sinais gerados pelo Trend screener (Trend Line Signals). É um Trend Line Scanner baseado no Trend Screener Indicator. Se você não tiver o Trend Screener Pro Indicator, o Trend Line Map Pro não funcionará. It's a Trend Line Scanner based on Trend Screener Indicator. If you don't have Trend Screener Pro Indicator,     the Trend Line Map Pro will not work . Acessando nosso Blog
TrendLine PRO MT5
Evgenii Aksenov
4.78 (49)
The Trend Line PRO indicator is an independent trading strategy. It shows the trend change, the entry point to the transaction, as well as automatically calculates three levels of Take Profit and Stop Loss protection Trend Line PRO is perfect for all Meta Trader symbols: currencies, metals, cryptocurrencies, stocks and indices Advantages of Trend Line PRO Never redraws its signals The possibility of using it as an independent strategy It has three automatic levels Take Profit and Stop Loss lev
Owl Smart Levels MT5
Sergey Ermolov
4.47 (36)
Versão MT4  |  FAQ O Indicador Owl Smart Levels é um sistema de negociação completo dentro de um indicador que inclui ferramentas populares de análise de mercado, como fractais avançados de Bill Williams , Valable ZigZag que constrói a estrutura de onda correta do mercado e níveis de Fibonacci que marcam os níveis exatos de entrada no mercado e lugares para obter lucros. Descrição detalhada da estratégia Instruções para trabalhar com o indicador Consultor de negociação Owl Helper Chat privado d
TPSpro TRENDPRO  - is a trend indicator that automatically analyzes the market and provides information about the trend and each of its changes, as well as giving signals for entering trades without redrawing! The indicator uses each candle, analyzing them separately. referring to different impulses - up or down impulse. Exact entry points into transactions for currencies, crypto, metals, stocks, indices!  -  Version MT4                  DETAILED DESCRIPTION        /       TRADING SETUPS       
Gartley Hunter Multi
Siarhei Vashchylka
5 (5)
Gartley Hunter Multi - An indicator for searching for harmonic patterns simultaneously on dozens of trading instruments and on all classic timeframes: (m1, m5, m15, m30, H1, H4, D1, Wk, Mn). Manual (Be sure to read before purchasing) | Version for MT4 Advantages 1. Patterns: Gartley, Butterfly, Shark, Crab. Bat, Alternate Bat, Deep Crab, Cypher 2. Simultaneous search for patterns on dozens of trading instruments and on all classic timeframes 3. Search for patterns of all possible sizes. Fr
Black Dragon indicator mt5
Ramil Minniakhmetov
4.82 (56)
O indicador de detecção de tendências complementará qualquer estratégia e também pode ser usado como uma ferramenta independente. Vantagens Fácil de usar, não sobrecarrega o gráfico com informações desnecessárias; Pode ser usado como filtro para qualquer estratégia; Possui níveis integrados de suporte e resistência dinâmicos, que podem ser usados ​​tanto para fins de lucro quanto para definir stop-loss; O indicador não muda de cor após o fechamento do castiçal;  Trabalha no mercado de ações
Golden Spikes Detector
Batsirayi L Marango
5 (1)
Golden Spikes Detector Este indicador é baseado em uma estratégia avançada principalmente para picos de negociação nos índices Boom e Crash. Algoritmos complexos foram implementados para detectar apenas entradas de alta probabilidade. Ele alerta sobre possíveis entradas de compra e venda. Para negociar picos na corretora Deriv ou Binária, receba apenas os alertas Buy Boom e Sell Cash. Ele foi otimizado para ser carregado em um período de 5 minutos, embora a análise de vários períodos de tempo se
Matrix Arrow Indicator MT5
Juvenille Emperor Limited
5 (14)
O   Matrix Arrow Indicator MT5   é uma tendência única 10 em 1 seguindo um indicador multi-timeframe   100% sem repintura   que pode ser usado em todos os símbolos/instrumentos:   forex ,   commodities ,   criptomoedas ,   índices ,   ações .  O  Matrix Arrow Indicator MT5  determinará a tendência atual em seus estágios iniciais, reunindo informações e dados de até 10 indicadores padrão, que são: Índice de movimento direcional médio (ADX) Índice de canal de commodities (CCI) Velas clássicas de
Smart Peak Bottom
Xiaoyu Huang
5 (2)
Este é um indicador claro para julgar topos e fundos e funciona bem para o mercado oscilante. Preço promocional 49$ → 59$ características bom em julgar topos e fundos Sem redesenho, sem deriva Cálculo rápido, sem atraso Modo de lembrete avançado Vários parâmetros e cores podem ser ajustados parâmetro "========== Principal ========" HighLowPeriod1 = 9 HighLowPeriod2 = 60 HighLowPeriod3 = 34 HighLowEMAPeriod = 4 MASignalPeriod = 5 "========== Notificar ========" UseAlertNotify = verdadeiro;
Mais do autor
Support Resistance View draws horizontal lines in the current chart that define in real time the values of Supports/Resistances for the timeframe tha you choose. Inputs: Lines color: color of the lines. Timeframe: timeframe for calculations. Support and Resistance are values at which the currency usually inverts the trend or have a breakthrought, so you can use this values to define a strategy for trading.
Trend View
Emanuele Cartelli
4 (1)
Trend View is a simple indicator that shows in a text the trend of the current currency in the timeframe you choose. Inputs are: Color: color of the text. Timeframe: timeframe for calculations. Trend can be: UP: bullish trend. DOWN: bearish trend. ---: trend not defined. You can use this indicator to show the main trend of a bigger timeframe helping you to choose your trades. Note: text is draggable.  
FREE
Pattern Finder Demo
Emanuele Cartelli
1 (1)
Pattern Finder Demo is the free version of Pattern Finder , a MULTICURRENCY indicator that scans the entire market seeking for candlestick patterns in 15 different pairs/currencies all in one chart! This demo has all the functionality of the version on payment except the number of patterns at disposal that are lowered to 4 only (from 62). You can also filter the scanning by following the trend by a function based on exponential moving average. Indicator parameters Alerts ON/OFF: Alert on scree
FREE
Pattern Finder
Emanuele Cartelli
Pattern Finder is a MULTICURRENCY indicator that scans the entire market seeking for up to 62 candlestick patterns in 15 different pairs/currencies all in one chart! You can also filter the scanning by following the trend by a function based on exponential moving average. Indicator parameters Alerts ON/OFF: Alert on screen ON/OFF : enables or disable screen alters. Notification by email ON/OFF : enable or disable email alerts. Push notification ON/OFF : enable or disable push notification on m
Trend Lines View draws trend lines in the current chart in the timeframe you choose, taking account of the last two maximum and minimum. Inputs are: Timeframe: timeframe for calculation. Period of calculation Max/Min: Integer that indicates the number of bars to define a minimum or a maximum; 1 means minimum/maximum have to be the lower/higher value of 1 bar previous and 1 bar after, 2 means a  the minimum/maximum have to be the lower/higher value of 2 bar previous and 2 bar after, etc. Color hi
Stochastic Break Point is based on the stochastic oscillator and moving average to find the points in which the currency will probably go in a defined direction. Inputs: Alarm ON/OFF: turn on or off alarm on screen. The indicator draws an arrow pointing the direction to follow based on when the stochastic line cross the signal line and in which direction it does it, filtered by the moving average direction. Stochastic Break Point can help you to choose the moment to do your trades in a specific
Support Resistance Pattern is based on supports and resistance to find the points in which the currency will probably go in a defined direction. Inputs: Alarm ON/OFF: turn on or off alarm on screen. The indicator draws an arrow pointing the direction to follow based on when a specific pattern of bars is found near a support or a resistance. Support Resistance Pattern can help you to choose the moment to do your trades in a specific direction, strengthening your trading strategy.
Support Resistance Inversion is based on supports and resistance to find the points in which the currency will probably go in a defined direction. Inputs: Alarm ON/OFF: turn on or off alarm on screen. The indicator draws an arrow pointing the direction to follow based on when the price cross or bounce on a support or a resistance. Support Resistance Inversion can help you to choose the moment to do your trades in a specific direction, strengthening your trading strategy.
Retracement Trend is based on a priceaction logic and volume of the lasts bars. Inputs: Alarm ON/OFF: turn on or off alarm on screen. The indicator draws an arrow pointing the direction to follow based on when a specific pattern of bar's volume is found and the price has a specific direction. Retracement Trend can help you to choose the moment to do your trades in a specific direction, strengthening your trading strategy.
MA Break Point
Emanuele Cartelli
MA Break Point is based on moving average and a priceaction logic to find the points in which the currency will probably go in a defined direction. Inputs: Alarm ON/OFF: turn on or off alarm on screen. The indicator draws an arrow pointing the direction to follow based on when the currency cross a moving average and verify the trend with another ma. MA Break Point can help you to choose the moment to do your trades in a specific direction, strengthening your trading strategy.
Chart Reverse Point is based on moving average, volumes, and a priceaction logic to find the points in which the currency will probably go in a defined direction. Inputs: Alarm ON/OFF: turn on or off alarm on screen. The indicator draws an arrow pointing the direction to follow based on when a specific pattern of bars is found near the moving average and the volumes are higher than a minumun defined by the indicator. Chart Reverse Point can help you to choose the moment to do your trades in a sp
Filtro:
Sem comentários
Responder ao comentário