• Visão global
  • Comentários (2)
  • Discussão (19)
  • O que há de novo

Trading Chaos Chart

5

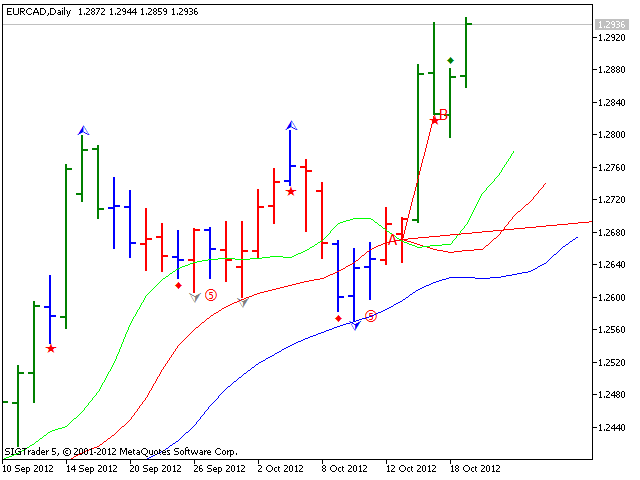
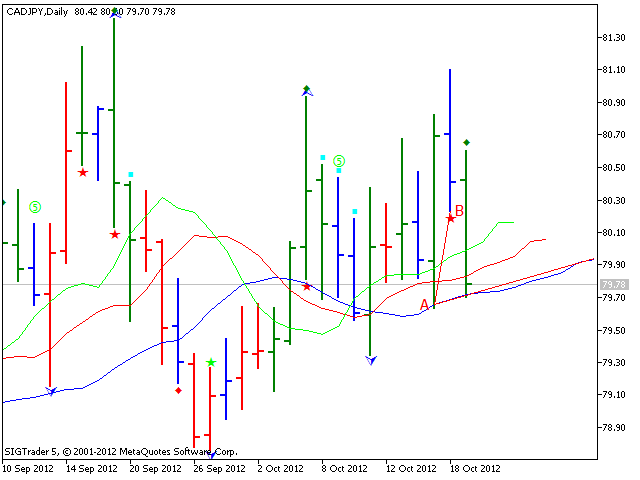
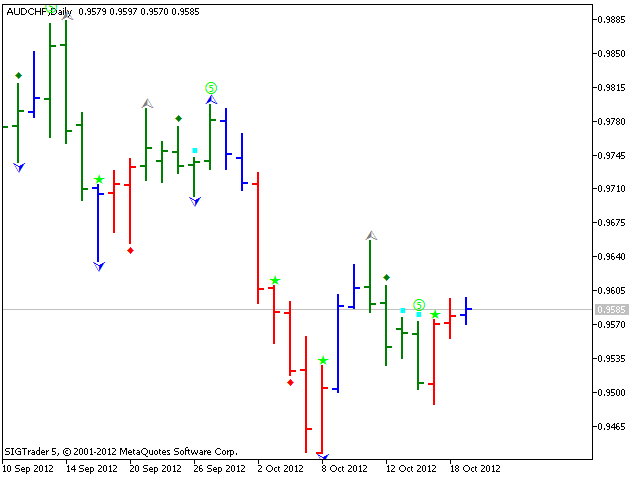
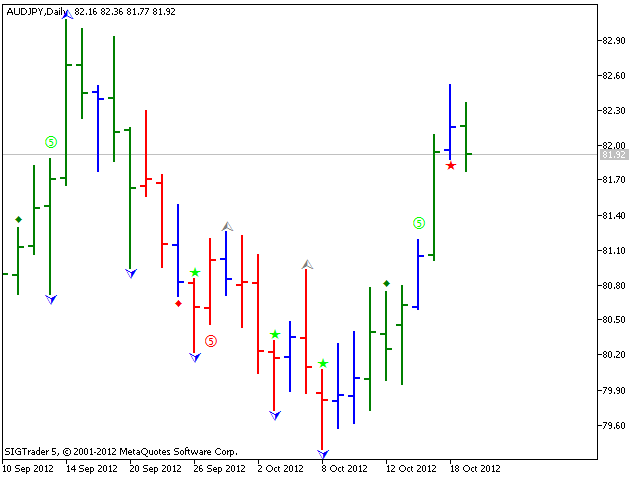
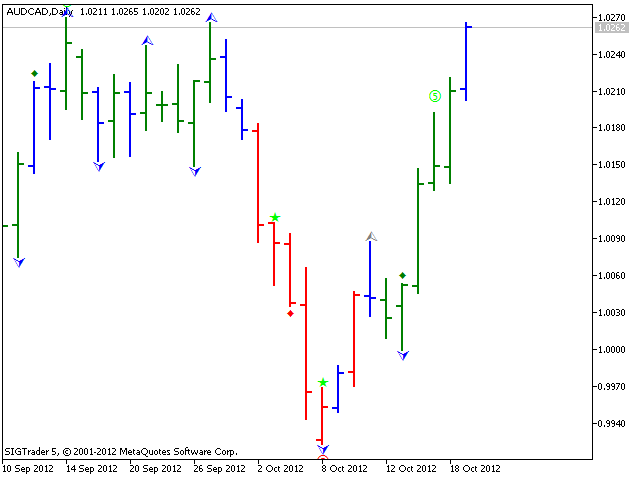
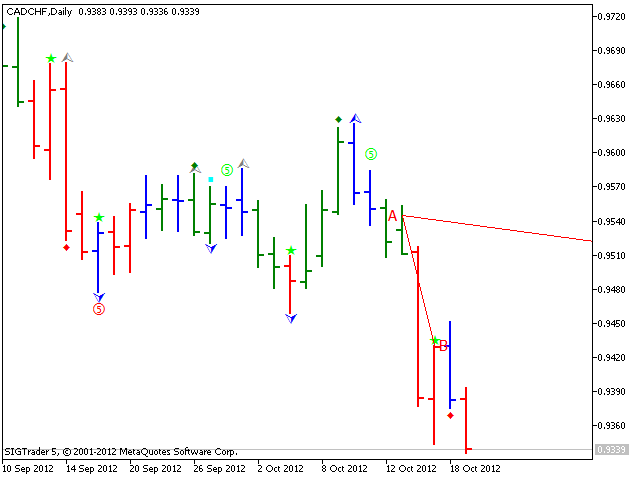
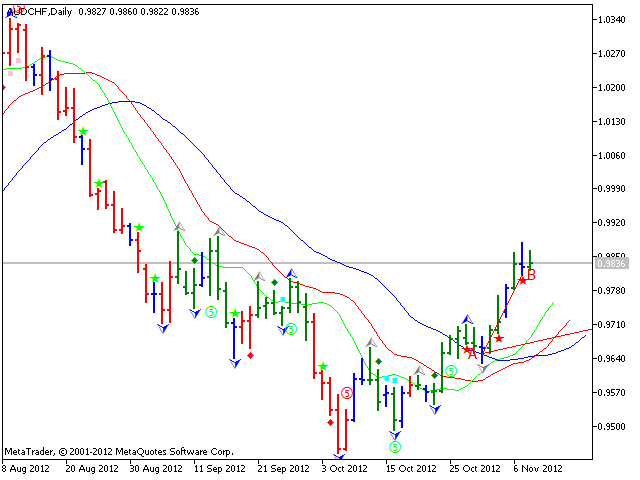
O principal objetivo do indicador é detectar e marcar no gráfico os seguintes sinais de negociação descritos em "Trading Chaos (2-nd edition)":

  1. Divergência nas barras de alta e baixa com angulação (incluindo o squat).
  2. Barras nas zonas em vermelho e verde de acordo com a cor do histograma Awesome Oscillator.
  3. Barras Squat no gráfico são independente da cor do histograma Awesome Oscillator.
  4. Níveis de fractais "importantes" em relação à "linha dos Dentes" do indicador Alligator.
  5. Desenha raios de angulação da linha de balanço para uma barra de reversão com angulação.
  6. Sinais do Second Wise Man (segundo homem sábio) com um símbolo Azul Claro Especial.
  7. Os sinais da "quinta barra consequente na zona" do indicador Awesome Oscillator.

O indicador inclui as funções básicas do indicador New Trading Dimensions Chart, conforme o seguinte:

  • Detecta e indica no gráfico os sinais gerados quando a linha do histograma cruza o nível zero, bem como os sinais em símbolos Azul Claro Especial formados pela intersecção da mesma.
  • Colore barras para três zonas (vermelho, verde, cinza), detectando as barras Squat.
  • Alterna para as funções do New Trading Dimensions Chart, definindo como TRUE (verdadeiro) os valores para o parâmetro de entrada Use new trading dimensions colors.

O indicador é desenvolvido para MetaTrader 5 de acordo com a estratégia descrita por B. Williams.

Legenda:

  • Barra azul - barra squat.
  • Estrela vermelha ou verde sobre uma barra - a barra apresenta sinais de barra divergente de "reversão" (BDB).
  • Lozango vermelho ou verde - o sinal do "Second Wise Man" (segundo homem sábio).
  • Quadrado vermelho ou verde - "Second Wise Man", sendo um forte sinal no símbolo "Azul Claro Especial".
  • Barra vermelha em qualquer direção - a barra está na zona do momento negativo.
  • Barra verde em qualquer direção - a barra está na zona do momento positivo.

O indicador inclui um bloco de sinal que informa ao trader sobre novos sinais de forma prática.

Este indicador é parte de uma integral negociação complexa . Ele forma um padrão de acordo com a estratégia descrita em "Trading Chaos 2". Recomenda-se usar o indicador, juntamente com os seguintes softwares:

Comentários 2
argo17
25
argo17 2020.11.11 12:27 
 

Классный продукт, на 5 баллов

Produtos recomendados
Noize Absorption Index - is the manual trading system that measures the difference of pressure between bears forces and bulls forces. Green line - is a noize free index that showing curent situation. Zero value of index shows totally choppy/flat market.Values above zero level shows how powerfull bullish wave is and values below zero measures bearish forces.Up arrow appears on bearish market when it's ready to reverse, dn arrow appears on weak bullish market, as a result of reverse expectation.
199 USD
Modified Rainbow
Rafael Alejandro Rey Alves
Modified Rainbow   The Modified Rainbow indicator is intended to work in different scenarios. The indicator uses a combination of technical indicators to detect buy or sell opportunities (different Moving Averages and other technical indicators). The indicator works with any currency pair, stocks, cryptocurrencies and synthetic indices. The indicator can be used for both traditional trading and binary options. The indicator works with any time frame, from M1 to MN. When the blue arrow
30 USD
To get access to MT4 version please click here . - This is the exact conversion from TradingView: "Stochastic Momentum Index" By "UCSgears". - This is a popular version of stochastic oscillator on tradingview. - This is a light-load processing and non-repaint indicator. - Buffers are available for the lines on chart. - You can message in private chat for further changes you need. Thanks for downloading
40 USD
Alligator modified
Gennadiy Stanilevych
5 (5)
The indicator has standard settings. The new modification of indicator provides special marking of the segment when the moving averages begin to form a cross in one direction or another. The Alligator`s cross indicates that the trend is about to change. Modified Alligator helps traders to determine a trend on a particular timeframe even if the averages are intertwined and have a shift in the future. Direction of a trend is determined by a cross of the averages with a specified marking area on th
100 USD
O nível Premium é um indicador único com mais de 80% de precisão nas previsões corretas! Este indicador foi testado pelos melhores Especialistas em Negociação por mais de dois meses! O indicador do autor você não encontrará em nenhum outro lugar! A partir das imagens você pode ver por si mesmo a precisão desta ferramenta! 1 é ótimo para negociar opções binárias com um tempo de expiração de 1 vela. 2 funciona em todos os pares de moedas, ações, commodities, criptomoedas Instruções:
1 100 USD
The standard Bollinger Bands indicator has been improved by integrating additional indications from the Standard Deviation indicator (StdDev), which gives an additional filter for confirming trading signals. In addition, the color of the indicator's lines shows the beginning of a trend, its development and exhaustion. This indicator has a signal block that notifies the trader of the beginning of the trend on any time frame to which it is attached. Settings Type of messages - select the type of
30 USD
Rainbow EA MT5
Jamal El Alama
Description : Rainbow EA MT5 is a simple Expert advisor based on   Rainbow MT5 indicator witch is based on Moving average with period 34. The indicator is incorporated in the EA, therefore, it is not required for the EA to operate, but if you wish, you can download it from   my product page . The Expert Advisor settings are as follows : Suitable for Timeframes up to H1 The parameters below can be set according to your trading rules. StopLoss ( Stop Loss in pips) TakeProfit ( Take Profit in pi
59 USD
HMA Trend Professional MT5
Pavel Zamoshnikov
4.4 (5)
Improved version of the free HMA Trend indicator (for MetaTrader 4) with statistical analysis. HMA Trend is a trend indicator based on the Hull Moving Average (HMA) with two periods. HMA with a slow period identifies the trend, while HMA with a fast period determines the short-term movements and signals in the trend direction. The main differences from the free version: Ability to predict the probability of a trend reversal using analysis of history data. Plotting statistical charts for analyz
30 USD
The best time to trade Using this Indicator is when the time reach exactly hour,half,45 minutes,15 minutes and sometimes 5 minutes.. This indicators is helpful to those who trade boom and crash indecies.How to read this indicator first you'll see Blue allow and Red allow all these allows used to indicate or to detect the spike which will happen so the allow happens soon before the spike happen.This indicator works properly only in boom and crash trading thing which you have to consider when
30 USD
Short term extremum
Gennadiy Stanilevych
5 (1)
The indicator determines and marks the short-term lows and highs of the market on the chart according to Larry Williams` book "Long-term secrets to short-term trading". "Any time there is a daily low with higher lows on both sides of it, that low will be a short-term low. We know this because a study of market action will show that prices descended in the low day, then failed to make a new low, and thus turned up, marking that ultimate low as a short-term point. A short-term market high is just
30 USD
You can avoid constant monitoring of computer screen waiting for the DeMarker signal while receiving push notifications to a mobile terminal or a sound alert on the screen about all required events, by using this indicator - DeMarker Alerts. In fact, it is the replacement of the standard indicator with which you will never miss the oscillator signals. If you don't know the benefits of DeMarker or how to use it, please read here . If you need signals of a more popular RSI indicator, use RSI Alert
30 USD
Blahtech VWAP - Volume Weighted Average Price (VWAP) is the ratio of price to total volume. It provides an average price over a specified time interval.  Links [  Install  |  Update  |  Documentation   ] Feature Highlights Configurable VWAP Line Sessions, intervals, anchored or continuous Previous day settlement line Standard Deviation bands Alerts at bar close or real time Automatic Broker or Tick volumes Significantly reduced CPU usage Input Parameters Max Bars   - Restrict the number of
49 USD
HLC bar MT5 Wyckoff
Eduardo Da Costa Custodio Santos
O indicador "HLC_bar_MT5 Wyckoff" para MT5 foi criado para facilitar a análise na hora da negociação. A Barra HLC foi utilizada por Richard Wyckoff e atualmente muito utilizada nas operações de "VSA". Wyckoff descobriu que a utilização da Máxima, mínima e fechamento deixava o gráfico muito mais limpo e fácil de ser analisado. O Indicador "HLC_bar_MT5 Wyckoff" permite: # Alterar a largura da barra; # Deixar a barra da mesma cor; # E destacar a barra que abriu e fechou no mesmo preço.
30 USD
Stochastic R
Antony Augustine
Stochastic  Reversal  allows you to recognize reversals professionally. Stochastic Indicator: This technical indicator was developed by George Lane more than 50 years ago. The reason why this indicator survived for so many years is because it continues to show consistent signals even in these current times. The Stochastic indicator is a momentum indicator that shows you how strong or weak the current trend is. It helps you identify overbought and oversold market conditions within a trend.  Rules
30 USD
Renko Gold
Ignacio Agustin Mene Franco
Renko Gold! clearly indicates the floors and ceilings where it goes from 4 lines, the line below that marks the floor in green confirming with the thinnest line clarifies the purchase entry, the same is for sale, the top line marks the ceiling and the thinnest red line marks the sale, This indicator works for all temporalities! For Forex and Synthetic Indices markets! It also works for crypto markets! Good profit! World Investor.
40 USD
Range Target
Ignacio Agustin Mene Franco
Range Target! indicator that marks the depletion of strength of the candle where it touches the floor and catches a trend, whether it is up or down The indicator has two support lines where it marks the floor and the ceiling. where on the same line marks the entry for rise or fall, the lines have Gold and Blue colors the gold line shows the purchase the blue line shows the sale works for any season works for forex markets works for synthetic index markets! Good Profit, World Investor.
50 USD
Fractals
Mikhail Nazarenko
The Fractals indicator displays on the chart only fractals with the specified parameters in the indicator settings. This allows you to more accurately record a trend reversal, excluding false reversals. According to the classical definition of a fractal, it is a candlestick - an extremum on the chart, which was not crossed by the price of 2 candles before and 2 candles after the appearance of a fractal candle. This indicator provides the ability to adjust the number of candles before and after t
34 USD
This plots  Fibonacci deviation levels above and below a moving average of the price. Companion indicator to the " Golden Bull Wave Trader "  expert advisor which uses volume\price trend to determine price reversals. https://www.mql5.com/en/market/product/56291 The expert advisor and this indicator were created in order to: Identify ideal and repeatable trade entries with high level of certainty Create a day trading strategy which doesn’t require a hard SL and TP Use alternate risk management me
30 USD
Volality Index scalper indicator  Meant for Volality pairs such as Volality 10, 25, 50, 75 and 100 The indicator works on all timeframes from the 1 minute to the monthly timeframe the indicator is non repaint the indicator has 3 entry settings 1 color change on zero cross 2 color change on slope change 3 color change on signal line cross Orange line is your sell signal Blue line is your buy signal.
35 USD
ZigZag Lines MTF for MT5
Taras Slobodyanik
5 (7)
Multitimeframe ZigZag indicator. It displays the support/resistance lines and their breakouts, as well as draws the current targets of the market. It can also display lines of the Fractals indicator and candles from other periods (up to Quarterly).  The indicator redraws the last (current) point, and in some cases can change the last 2-3 points. All lines are drawn as objects (not indicator buffers, but there is a possibility to receive the data for the EA ). When used in an Expert Advisor,
35 USD
Trend Monitor MT5
Pavel Zamoshnikov
4 (4)
The indicator generates early signals basing on ADX reading data combined with elements of price patterns. Works on all symbols and timeframes. The indicator does not redraw its signals. You see the same things on history and in real time. For better visual perception signals are displayed as arrows (in order not to overload the chart). Features The best results are obtained when the indicator works on two timeframes. For example: M30 – the indicator shows the main trend; M5 – the indicator ge
30 USD
Pattern DejaVu
Andriy Konovalov
1 (1)
This indicator predicts the nearest bars of the chart based on the search of up to three best coincided patterns (a sequence of bars of a given length) in the history of the current instrument of the current timeframe. The found patterns are aligned with the current pattern at the   opening price   of the current (last) bar. The predicted bars are bars following immediately for patterns found in history. Pattern search is performed once every time a new bar of the current timeframe opens. The i
30 USD
An indicator of pattern #31 ("Long Island") from Encyclopedia of Chart Patterns by Thomas N. Bulkowski. The second gap is in the opposite direction. Parameters: Alerts - show alert when an arrow appears   Push - send a push notification when an arrow appears (requires configuration in the terminal) GapSize - minimum gap size in points ArrowType - a symbol from 1 to 17 ArrowVShift - vertical shift of arrows in points   ShowLevels - show levels ColUp - color of an upward line ColDn - color of a
30 USD
Introduction The "Two Moving Average Crossover" indicator for MetaTrader 5 (MT5) is a technical analysis tool that displays two moving averages and notifies when the moving averages cross each other. The indicator calculates and plots two moving averages, one of which is faster and the other is slower. When the faster moving average crosses above the slower moving average, it is considered a bullish signal, indicating a potential trend reversal or the start of a new uptrend. Conversely, when th
35 USD
PipFinite Trend PRO MT5
Karlo Wilson Vendiola
4.86 (657)
Breakthrough Solution For Trend Trading And Filtering With All Important Features Built Inside One Tool! Trend PRO's smart algorithm detects the trend, filters out market noise and gives entry signals with exit levels. The new features with enhanced rules for statistical calculation improved the overall performance of this indicator. Important Information Revealed Maximize the potential of Trend Pro, please visit www.mql5.com/en/blogs/post/713938 The Powerful Expert Advisor Version Automa
98 USD
Laguerre SuperTrend Clouds   adds an Adaptive Laguerre averaging algorithm and alerts to the widely popular SuperTrend indicator. As the name suggests,   Laguerre SuperTrend Clouds (LSC)   is a trending indicator which works best in trendy (not choppy) markets. The SuperTrend is an extremely popular indicator for intraday and daily trading, and can be used on any timeframe. Incorporating Laguerre's equation to this can facilitate more robust trend detection and smoother filters. The LSC uses the
30 USD
Trend Side - um indicador técnico para determinar a tendência. É um conjunto de várias estratégias de negociação completas. O indicador utiliza um sistema avançado de filtragem de tendências, possui um painel estatístico, calcula os níveis de entrada e saída e calcula o nível dinâmico do Trailing Stop. Adequado para qualquer tipo de símbolos, nunca redesenha seus sinais e resultados. Uma ferramenta abrangente para negociação de tendências profissional. O conjunto do indicador Trend Side també
50 USD
PZ Trend Trading MT5
PZ TRADING SLU
3.67 (3)
O Trend Trading é um indicador projetado para lucrar o máximo possível com as tendências que ocorrem no mercado, cronometrando retrocessos e rupturas. Ele encontra oportunidades de negociação analisando o que o preço está fazendo durante as tendências estabelecidas. [ Guia de instalação | Guia de atualização | Solução de problemas | FAQ | Todos os produtos ] Negocie mercados financeiros com confiança e eficiência Lucre com as tendências estabelecidas sem ser chicoteado Reconhecer retrocesso
175 USD
Uma das sequências numéricas é chamada de "Forest Fire Sequence". Foi reconhecida como uma das mais belas novas sequências. Sua principal característica é que essa sequência evita tendências lineares, mesmo as mais curtas. É esta propriedade que formou a base deste indicador. Ao analisar uma série temporal financeira, este indicador tenta rejeitar todas as opções de tendência possíveis. E somente se ele falhar, ele reconhece a presença de uma tendência e dá o sinal apropriado. Esta abordagem pe
30 USD
A professional tool for trading - the divergence indicator between the  Stochastic and the price, which allows you to receive a signal about a trend reversal in a timely manner or catch price pullback movements (depending on the settings). The indicator settings allow you to adjust the strength of the divergence due to the angle of the  Stochastic peaks and the percentage change in price, which makes it possible to fine-tune the signal strength. The indicator code is optimized and is tested ver
37 USD
Os compradores deste produto também adquirem
ICT, SMC, SMART MONEY CONCEPTS, SMART MONEY, Smart Money Concept, Support and Resistance, Trend Analysis, Price Action, Market Structure, Order Blocks, BOS/CHoCH,   Breaker Blocks ,  Momentum Shift,   Supply&Demand Zone/Order Blocks , Strong Imbalance,   HH/LL/HL/LH,    Fair Value Gap, FVG,  Premium  &   Discount   Zones, Fibonacci Retracement, OTE, Buy Side Liquidity, Sell Side Liquidity, BSL/SSL Taken, Equal Highs & Lows, MTF Dashboard, Multiple Time Frame, BigBar, HTF OB, HTF Market Structur
65 USD
Este é um indicador para MT5 que fornece sinais precisos para entrar em uma negociação sem redesenhar. Ele pode ser aplicado a qualquer ativo financeiro: forex, criptomoedas, metais, ações, índices. Ele fornecerá estimativas bastante precisas e informará quando é melhor abrir e fechar um negócio. Assista o vídeo (6:22) com um exemplo de processamento de apenas um sinal que compensou o indicador! A maioria dos traders melhora seus resultados de negociação durante a primeira semana de negociação c
125 USD
Advanced Supply Demand MT5
Bernhard Schweigert
4.42 (12)
Atualmente com 33% de desconto! A melhor solução para qualquer Trader Novato ou especialista! Este indicador é uma ferramenta de negociação exclusiva, de alta qualidade e acessível porque incorporamos uma série de recursos proprietários e uma nova fórmula. Com esta atualização, você poderá mostrar fusos horários duplos. Você não só será capaz de mostrar um TF mais alto, mas também mostrar ambos, o TF do gráfico, MAIS o TF mais alto: MOSTRANDO ZONAS ANINHADAS. Todos os traders de Oferta e Demanda
199 USD
Matrix Arrow Indicator MT5
Juvenille Emperor Limited
5 (11)
O   Matrix Arrow Indicator MT5   é uma tendência única 10 em 1 seguindo um indicador multi-timeframe   100% sem repintura   que pode ser usado em todos os símbolos/instrumentos:   forex ,   commodities ,   criptomoedas ,   índices ,   ações .  O  Matrix Arrow Indicator MT5  determinará a tendência atual em seus estágios iniciais, reunindo informações e dados de até 10 indicadores padrão, que são: Índice de movimento direcional médio (ADX) Índice de canal de commodities (CCI) Velas clássicas de
75 USD
Blahtech Supply Demand MT5
Blahtech Limited
4.45 (11)
Supply Demand uses previous price action to identify potential imbalances between buyers and sellers. The key is to identify the better odds zones, not just the untouched ones. Blahtech Supply Demand indicator delivers functionality previously unavailable on any trading platform. This 4-in-1 indicator not only highlights the higher probability zones using a multi-criteria strength engine, but also combines it with multi-timeframe trend analysis, previously confirmed swings and engulfing detecto
99 USD
TPA True Price Action indicator reveals the true price action of the market makers through 100% non-repainting signals strictly at the close of a candle! TPA shows entries and re-entries, every time the bulls are definitely stronger than the bears and vice versa. Not to confuse with red/green candles. The shift of power gets confirmed at the earliest stage and is ONE exit strategy of several. There are available now two free parts of the TPA User Guide for our customers. The first "The Basics"
168 USD
Market Profile defines a number of day types that can help the trader to determine market behaviour. A key feature is the Value Area, representing the range of price action where 70% of trading took place. Understanding the Value Area can give traders valuable insight into market direction and establish the higher odds trade. It is an excellent addition to any system you may be using. Blahtech Limited presents their Market Profile indicator for the MetaTrader community. Inspired by Jim Dalton’s
99 USD
Owl Smart Levels MT5
Sergey Ermolov
5 (7)
Guia do Indicador   |  Estratégia  Owl Smart Levels  |   Versão MT4  |  Como instalar?   |   FAQ O Indicador Owl Smart Levels é um sistema de negociação completo dentro de um indicador que inclui ferramentas populares de análise de mercado, como fractais avançados de Bill Williams , Valable ZigZag que constrói a estrutura de onda correta do mercado e níveis de Fibonacci que marcam os níveis exatos de entrada no mercado e lugares para obter lucros. Para uma descrição detalhada do sistema de nego
97 USD
Italo Volume Indicator MT5
Italo Santana Gomes
4.69 (13)
BUY INDICATOR AND GET EA FOR FREE AS A BONUS + SOME OTHER GIFTS! ITALO VOLUME INDICATOR  is the best volume indicator ever created, and why is that? The Indicator works on all time-frames and assets, indicator built after 6 years of experience on forex and many other markets. You know many volume indicators around the internet are not complete, does not help, and it's difficult to trade, but the Italo Volume Indicator is different , the Italo Volume Indicator shows the wave volume, when market
65 USD
ACB Breakout Arrows MT5
KEENBASE SOFTWARE SOLUTIONS
5 (1)
The ACB Breakout Arrows indicator provides a crucial entry signal in the market by detecting a special breakout pattern. The indicator constantly scans the chart for a settling momentum in one direction and provide the accurate entry signal right before the major move. Get multi-symbol and multi-timeframe scanner from here - Scanner for ACB Breakout Arrows MT 5 Key features Stoploss   and Take Profit levels are provided by the indicator. Comes with a MTF Scanner dashboard which tracks the br
145 USD
Introduction to X3 Chart Pattern Scanner X3 Cherart Pattern Scanner is the non-repainting and non-lagging indicator detecting X3 chart patterns including Harmonic pattern, Elliott Wave pattern, X3 patterns, and Japanese Candlestick patterns. Historical patterns match with signal patterns. Hence, you can readily develop the solid trading strategy in your chart. More importantly, this superb pattern scanner can detect the optimal pattern of its kind. In addition, you can switch on and off individu
250 USD
Introduction to EFW Analytics EFW Analytics was designed to accomplish the statement "We trade because there are regularities in the financial market". EFW Analytics is a set of tools designed to maximize your trading performance by capturing the repeating fractal geometry, known as the fifth regularity in the financial market. The functionality of EFW Analytics consists of three parts. Firstly, Equilibrium Fractal Wave Index is an exploratory tool to support your trading logic to choose which r
200 USD
FX Power MT5
Daniel Stein
4.3 (23)
Quer tornar-se um comerciante forex de 5 estrelas constantemente lucrativo? 1.   Leia a descrição básica do nosso   sistema de   negociação simples e   a sua grande actualização estratégica em 2020 2.   Envie um screenshot da sua compra para obter o seu convite pessoal para o nosso chat comercial exclusivo FX Power   é o primeiro medidor de força da moeda com uma história completa em todos os períodos de tempo. Analisa o impulso e a força de todas as principais moedas para determinar transa
66 USD
Stargogs Spike Catcher
Lorenzo Edward Beukes
5 (6)
Stargogs Spike Catcher V3.11 This Indicator is Developed To milk the BOOM and CRASH indices . Send me Message if you need any help with the indicator.  CHECK OUT THE STARGOGS SPIKE CATCHER EA/ROBOT V3: CLICK HERE ALSO CHECK OUT SECOND TO NONEFX SPIKE CATCHER:   CLICK HERE STARGOGS SPIKE CATCHER V3.11 WHATS NEW! Brand New Strategy. This is the Indicator you need for 2023. The Indicator Gives you an Entry at a time when conditions are met and you should use TP & SL. New Trendline that changes col
100 USD
Trend Chief mt5
Vladimir Stepanov
O Trend Chief é um algoritmo de indicador avançado que filtra o ruído do mercado, determina a tendência, os pontos de entrada e os possíveis níveis de saída. Use prazos mais curtos para scalping e prazos mais altos para swing trading. Trend Chief é perfeito para todos os símbolos Metatrader: moedas, metais, moedas criptográficas, ações e índices * Como usar o indicador Trend Chief: - Obtenha a tendência principal observando os gráficos diários e H4 - Se a tendência for de alta, vá para interva
99 USD
XQ Indicator MT5
Marzena Maria Szmit
5 (1)
The signal conditions are a combination of three indicators, and XQ Forex Indicators only display  medium and long-term trends . The indicator's efficacy has been improved with the addition of a filter that blocks out false signals. The XQ Forex Indicator can be used on  FX pairs, CFDs, and Cryptocurrencies . There are two type of signals:  Buy or Sell and Big Long or Big Short It is possible to enable sending emails when a major trend-change signal is detected, as well as to display the alerts
179 USD
Legacy of Gann for MT5
Pavel Zamoshnikov
5 (2)
The indicator very accurately determines the levels of the possible end of the trend and profit fixing. The method of determining levels is based on the ideas of W.D.Gann, using an algorithm developed by his follower Kirill Borovsky. Extremely high reliability of reaching levels (according to K. Borovsky  - 80-90%) Indispensable for any trading strategy – every trader needs to determine the exit point from the market! Precisely determines targets on any timeframes and any instruments (forex, met
65 USD
MetaBands M5
Vahidreza Heidar Gholami
5 (2)
MetaBands utiliza algoritmos poderosos e únicos para desenhar canais e detectar tendências, a fim de fornecer aos traders pontos potenciais para entrar e sair de negociações. É um indicador de canal mais um indicador de tendência poderoso. Inclui diferentes tipos de canais que podem ser mesclados para criar novos canais simplesmente usando os parâmetros de entrada. O MetaBands usa todos os tipos de alertas para notificar os usuários sobre eventos de mercado. Recursos Suporta a maioria dos algori
129 USD
Este indicador reconhece mais de 30 padrões de candlestick japoneses e os destaca maravilhosamente no gráfico. É simplesmente um daqueles indicadores que os operadores de ação de preços não podem viver sem. Melhore sua análise técnica da noite para o dia Detectar padrões de velas japonesas facilmente Negocie padrões de reversão confiáveis e universais Entre nas tendências estabelecidas com segurança usando padrões de continuação O indicador não repinta e implementa alertas O indicador implement
99 USD
Royal Scalping Indicator M5
Vahidreza Heidar Gholami
5 (8)
Royal Scalping Indicator is an advanced price adaptive indicator designed to generate high-quality trading signals. Built-in multi-timeframe and multi-currency capabilities make it even more powerful to have configurations based on different symbols and timeframes. This indicator is perfect for scalp trades as well as swing trades. Royal Scalping is not just an indicator, but a trading strategy itself. Features Price Adaptive Trend Detector Algorithm Multi-Timeframe and Multi-Currency Trend Low
149 USD
Royal Wave Pro M5
Vahidreza Heidar Gholami
3.67 (3)
Royal Wave is a Trend-Power oscillator which has been programmed to locate and signal low-risk entry and exit zones. Its core algorithm statistically analyzes the market and generates trading signals for overbought, oversold and low volatile areas. By using a well-designed alerting system, this indicator makes it easier to make proper decisions regarding where to enter and where to exit trades. Features Trend-Power Algorithm Low risk Entry Zones and Exit Zones Predictions for Overbought and Over
129 USD
PZ Swing Trading MT5
PZ TRADING SLU
5 (4)
Swing Trading é o primeiro indicador projetado para detectar oscilações na direção da tendência e possíveis oscilações de reversão. Ele usa a abordagem de negociação de linha de base, amplamente descrita na literatura de negociação. O indicador estuda vários vetores de preço e tempo para rastrear a direção da tendência agregada e detecta situações nas quais o mercado está sobrevendido ou sobrecomprado em excesso e pronto para corrigir. [ Guia de instalação | Guia de atualização | Solução de prob
175 USD
Short description : TAMA is, at its core, a novel method for correcting moving averages (MAs) during trends. | This usually also results in better smoothing and a significantly lower time delay (lag) of the MAs. | The indicator can additionally be used for price forecasts and band formation, also combined. | TAMA received an award from VTAD in 2022. | Honored with the VTAD Award 2022 (VTAD = Association of Technical Analysts Germany, German branch of IFTA).   Core Features : Classic MAs
99 USD
WAPV Full MT5
Eduardo Da Costa Custodio Santos
## Se você não conseguir utilizar a versão demo , por favor entrar em contato por mensagem. ## Opere de forma Profissional utilizando o WAPV Full e consiga rastrear aonde esta o dinheiro dos Grandes Players Funciona em qualquer Mercado que tenha Preço e Volume , FUTUROS, FOREX, CRIPTOS, AÇÕES, CFDS... Imagine você ter em suas mão uma ferramenta que sozinha faz a leitura dos grandes Players do Mercado, mostrando as melhores regiões de negociação com base da análise de Preço e Volume. O WAP
199 USD
Hunting Trend MT5
Claudia Ramona Angerer
5 (11)
75% discount only for the first 5 buyers (3 left), main price: 300 $ Show the signal as a line graph Prediction of 10 future candles and advanced display Prediction of individual candles graphically Can be used in the gold symbol Can be used in 15 minutes time frame How the indicator works: Using complex mathematical calculations, it predicts the future 10 candles. The predictions of this indicator are based on price. Therefore, it can predict each candle separately But it is better to
75 USD
ToolBox 360 is the swiss knife of all indicators. It is full packed with useful tools to help you with your trading. It can be used to find best entry and exit points and help you to decide if you should open a trade or not. It shows market trends, candlestick formations outside / inside bars and you can sett time based allerts. Main features: Time based Fibonacci lines Choose a start and end time and the indicator shows you Fibonacci lines within the selected time range including range high
399 USD
Currency Strength Meter is the easiest way to identify strong and weak currencies. This indicator shows the relative strength of 8 major currencies + Gold: AUD, CAD, CHF, EUR, GBP, JPY, NZD, USD, XAU. Gold symbol can be changed to other symbols like XAG, XAU etc. By default the strength value is normalised to the range from 0 to 100 for RSI algorithm: The value above 60 means strong currency; The value below 40 means weak currency; This indicator needs the history data of all 28 major currenc
78 USD
Anchored VWAP with Alert MT5
Trade The Volume Waves Single Member P.C.
What is the Volume Weighted Average Price (VWAP)? The volume weighted average price (VWAP) is a trading benchmark used by traders that gives the average price an instrument has traded at throughout the day, based on both volume and price.  It is important because it provides traders with insight into both the trend and value of the instrument. What is the Difference between VWAP and AVWAP? While VWAP is having as starting point the beggining of the day,week,month etc. in the AVWAP you can p
80 USD
(FOR MT5)  Divergence Scanner Multi Pair And Multi Time Frame :   This indicator has been designed to automatically identify when a divergence occurs between price and an oscillator. It can identify both bull and bear divergence and it is already loaded with four of the most popular oscillators. You can choose from RSI, MACD, Stochastics and CCI. IMPORTANT FACTORS TO KEEP IN MIND: When a divergence occurs, it means that price and momentum are not in agreement. And divergence signals are widel
79 USD
Ichimoku Map (instant look at the markets) - built on the basis of the legendary Ichimoku Kinko Hyo indicator. The task of the Ichimoku Map is to provide information about the market strength on the selected time periods and instruments, from the point of view of the Ichimoku indicator. The indicator displays 7 degrees of buy signal strength and 7 degrees of sell signal strength. The stronger the trend, the brighter the signal rectangle in the table. The table can be dragged with the mouse. T
77 USD
Mais do autor
Recognizer 1 2 3 Patterns
Gennadiy Stanilevych
4.53 (34)
tO indicador é destinado ao reconhecimento e marcação dos padrões 1-2-3 comprar e vende de um gráfico. O indicador vai ajudar um negócio para determinar o início e o sinal de fractais, e especificar os possíveis pontos de entrada em todos os tempos do МetaTrader 5. Linhas de Fibonacci são desenhados no gráfico para indicar supostos alvos de movimento sobre a base da teoria ondulatória. As formações 1-2-3 parecem ser especialmente importante como as divergências (convergências) são formados em to
FREE
Trading Chaos Expert
Gennadiy Stanilevych
5 (10)
Não existe software igual no mundo e que represente um "console" universal de negociação informando sinais para operar, entrada automatizada do mercado, configurando o Stop Loss e o Take Profit, assim como o Trailling Profit para diversas negociações em apenas uma janela aberta. O controle intuitivo do Expert Advisor em "três cliques" garante um uso abrangente de todas as suas funções em diferentes computadores, incluindo tablets. Interagindo com indicadores de sinal adicionais que marcam o gráf
995 USD
Modified Awesome Oscillator
Gennadiy Stanilevych
5 (1)
O principal objetivo do indicador é detectar e marcar sinais de negociação no histograma do Awesome Oscillator de acordo com as estratégias de "Trading Chaos, second edition" e "New Trading Dimensions". O indicador detecta e marca os seguintes sinais de negociação: "Two peaks" (dois topos) - divergência. O sinal do "Second wise-man" (Segundo homem sábio) - terceiro barra consequente do indicador Awesome Oscillator após a sua cor ter sido alterada. O histograma cruza a linha zero. O sinal "Saucer
50 USD
Alligator modified
Gennadiy Stanilevych
5 (5)
The indicator has standard settings. The new modification of indicator provides special marking of the segment when the moving averages begin to form a cross in one direction or another. The Alligator`s cross indicates that the trend is about to change. Modified Alligator helps traders to determine a trend on a particular timeframe even if the averages are intertwined and have a shift in the future. Direction of a trend is determined by a cross of the averages with a specified marking area on th
100 USD
Spread and Swap monitor
Gennadiy Stanilevych
5 (1)
O indicador tem o objetivo de determinar o tamanho do spread e swap, a distância para configurar ordens pendentes, stop loss permitido com o preço atual e o risco por 1 ponto na moeda de depósito. O indicador informa ao trader sobre possíveis despesas e os lucros adicionais relacionados com a transferência de uma posição para a próxima sessão de negociação do instrumento financeiro. Ele também informa sobre o tamanho do spread, a distância das ordens pendentes, stop loss e o trailing stop a part
30 USD
Trading Chaos Expert Lite
Gennadiy Stanilevych
5 (1)
Trading Chaos Expert Lite is a light version of Trading Chaos Expert. In the Lite version it is not possible to receive the table of trading signals, automatically place pending orders based on them and maintain open positions for multiple symbols at the same time in one window. Only the Current Chart mode is available. In all other features the panel is fully consistent with the basic version of the Expert Advisor. This is, rather, a well thought out trader's assistant which is not easy to do w
250 USD
Purpose and functions of the indicator The indicator determines and marks the moments of trend change on the chart based on the theory of fractal levels breakout on any of the analyzed timeframes. If a breakout based on all rules is valid, a horizontal line with corresponding color will appear on the chart. If there is an uptrend, the line will be blue. In the descending trend, the line will be red. The blue line is a strong support level, the trader should look for buying opportunities above th
60 USD
Auto Format
Gennadiy Stanilevych
Este é um utilitário para o dimensionar automaticamente o gráfico com menos de 140 barras visíveis. Isso é necessário para uma análise correta de ondas de acordo com a estratégia "Negociação do Caos"de Bill Williams. O utilitário pode ser usado em qualquer período de tempo disponível no МetaТrader 5. Ele desenha uma linha vertical através da primeira barra iniciando o cálculo. Esta linha permite que você veja o ponto provável de partida da sequência da onda, juntamente com um número suficiente d
60 USD
Short term extremum
Gennadiy Stanilevych
5 (1)
The indicator determines and marks the short-term lows and highs of the market on the chart according to Larry Williams` book "Long-term secrets to short-term trading". "Any time there is a daily low with higher lows on both sides of it, that low will be a short-term low. We know this because a study of market action will show that prices descended in the low day, then failed to make a new low, and thus turned up, marking that ultimate low as a short-term point. A short-term market high is just
30 USD
O principal objetivo do indicador é determinar e marcar sinais de negociação no histograma do Accelerator Oscillator, que foram descritos por Bill Williams em seu livro "New Trading Dimensions". A lista de sinais: O sinal de compra quando o histograma do indicador está abaixo da linha zero. O sinal de venda quando o histograma do indicador está abaixo da linha zero. O sinal de venda quando o histograma do indicador está acima da linha de zero. O sinal de compra quando o histograma do indicador e
30 USD
Slider
Gennadiy Stanilevych
5 (1)
This is a utility created to ease charts watching on tablet PCs. The indicator allows you automatically alternately display "slide show" of all currency charts from "MarketWatch". The user can set the display time interval (in seconds) between charts in indicator settings. In addition, there is an option of selecting the angle of Start/Stop button which starts and stops the display of charts. This function is very useful if a trader noticed a trading signal and would like to study it in more det
FREE
Trading Chaos Expert Demo
Gennadiy Stanilevych
4 (7)
Trading Chaos Expert Demo é uma versão demo do Trading Chaos Expert. A versão demo do Painel Expert permite que o trader aprenda o funcionamento e as possibilidades do algoritmo Trading Chaos Expert. Isso irá ajudá-lo a aprender a trabalhar com o Expert Advisor sem risco em uma conta demo em vez do testador de estratégia. Na versão demo: apenas um par de moeda é usado (1 especificado nas configurações) você só pode usar os tempos M5, M30 e H12 (mesmo se você especificar outro) todas as posições
FREE
Slider profy
Gennadiy Stanilevych
The idea of ​​enhancing the free Slider utility appeared after the release of a lite version of the EA trade panel Trading Chaos Expert Lite , which operates in the Current Chart mode without the possibility to maintain trades of several symbols in a single window. The purpose of Slider profy Ease search for trading signals by automatic display of charts of currency pairs from the "Market Watch" one by one at a specified interval of time in seconds. Automation of one-click placing of pending ord
30 USD
Stairway
Gennadiy Stanilevych
The multi-timeframe indicator of the levels of the Pivot Points. Every closed daily period has its own so-called reference point - Pivot Point, which sets the levels for smaller intraday timeframes for the following day. The Pivot Points indicators existing in the codes have no method of showing the dynamics of the pivot point changes on the historical data of the price chart. Pivot Point calculation formula. Pivot=(High + Low + Close) /3 High — the maximum of the previous day; Low — the minimum
30 USD
The standard Bollinger Bands indicator has been improved by integrating additional indications from the Standard Deviation indicator (StdDev), which gives an additional filter for confirming trading signals. In addition, the color of the indicator's lines shows the beginning of a trend, its development and exhaustion. This indicator has a signal block that notifies the trader of the beginning of the trend on any time frame to which it is attached. Settings Type of messages - select the type of
30 USD
Fifth dimension
Gennadiy Stanilevych
5 (1)
The indicator looks for the "Fifth dimension" trade signals and marks them on the chart. A detailed description of the chart patterns that generate the trade signals can be found in Chapter 8 "The Balance Line Trades" in the book Williams' "New Trading Dimensions". Signal levels with indication of the position entry or stop loss placement price are indicated directly on the chart. This feature creates additional convenience for the trader when placing pending orders. A solid horizontal line is d
30 USD
Filtro:
argo17
25
argo17 2020.11.11 12:27 
 

Классный продукт, на 5 баллов

Oleksii Stanilevych
586
Oleksii Stanilevych 2017.06.23 09:12 
 

O usuário não deixou nenhum comentário para sua avaliação

Responder ao comentário
Versão 6.96 2021.12.07
Индикатор скомпилирован в новой версии редактора МТ5 по рекомендации администрации mql5.
Versão 6.92 2019.06.28
Оптимизация и исправление незначительных ошибок.
Versão 6.90 2019.03.18
Индикатор оптимизирован для работы с 2009 версией терминала МТ5 и выше.
Versão 6.81 2018.12.27
Индикатор оптимизирован для работы с новой версией 6.81 торговой панели Trading Chaos Expert.
Versão 6.13 2015.06.03
- Increased the speed of working with graphic objects.
- Improved the function of detecting and labeling the divergent bars (bdb) on a chart.
Versão 3.26 2014.12.15
Оптимизация кода индикатора с учетом новых релизов МetaТrader 5.
Versão 3.25 2014.05.19
The indicator has been optimized. Slow calls of object search corrected.