• Visão global
  • Comentários
  • Discussão

Market Waves Heikin Ashi

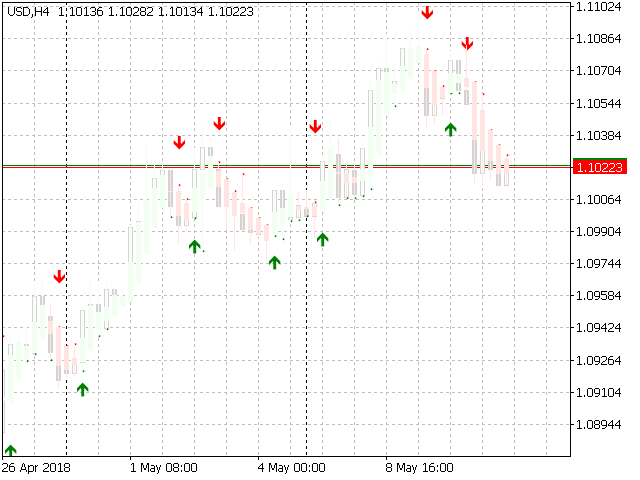
Market Waves marks reversal price points on a chart following the modified Larry Williams method. The price is preliminarily smoothed using Heikin Ashi method.

Open positions in the indicator signal direction. Note the patterns formed by reversal point groups. I recommend reading Larry Williams' "Long-Term Secrets to Short-Term Trading" before using the indciator.

Produtos recomendados
Heiken Ashi Smoothed Strategy is a very simple but powerful system to get forex market trend direction. This indicator is actually 2 indicators in 1 pack, Heiken Ashi and Heiken Ashi Smoothed Moving Average both included. Because HA (Heiken Ashi) and HAS (Heiken Ashi Smoothed) are calculated in the same one system event with necessary buffers and loop only, so it is the FAST, OPTIMIZED and EFFICIENT HA having the combined indicator of MetaTrader 5. You can choose to display HA and HAS in the sam
The standard Bollinger Bands indicator has been improved by integrating additional indications from the Standard Deviation indicator (StdDev), which gives an additional filter for confirming trading signals. In addition, the color of the indicator's lines shows the beginning of a trend, its development and exhaustion. This indicator has a signal block that notifies the trader of the beginning of the trend on any time frame to which it is attached. Settings Type of messages - select the type of
KF-BB Professional Bollinger Bands with Alert. Bollinger bands available in the market are mostly drawn based on simple moving average . KF-BB is the first bollinger bands that can draw the center line using all the usual methods simple , exponential, etc. A very professional indicator, it does not end here other advantages of this indicator include creating an alarm on the desktop and the mobile phone When the candlesticks hit one of the center lines or the upper and lower bands Features in
Esta é a versão customizada da Gekko para o famoso indicaor Heiken Ashi. Ele amplia o uso das famosas barras de Heiken Ashi e calcula sinais fortes de entrada e saída. Parâmetros de Entrada Number of Bars to Plot Indicator:  número de barras históricas para plotar o indicador, mantenha  baixo para melhor desempenho; Produce Arrow Signals:  escolha se o indicador irá produzir sinais de seta para compras e vendas; Produces Signal Only When a Bar Closes:  coloque true para esperar pelo fechamento d
Hunter trend
Yaroslav Varankin
Hunter Trend: Arrow Indicator for Binary Options Trading Hunter Trend is an arrow indicator designed for trading binary options (turbo options) on the M1 timeframe, allowing for short-term trading opportunities. How to Trade with this Tool: Signals may appear when a candlestick forms. Once such a signal appears, wait for the closure of that candlestick. Upon the opening of a new candlestick, open a trade for 1-2 candlesticks in the indicated direction. In this case, for 1-2 minutes. A blue dot
The Pivot Point Pioneer indicator is based on unique indicators capable of detecting extreme points. It is ideal for identifying reversals or sharp price movements in one direction. Thanks to this indicator, you will be informed about upcoming events: a blue dot will appear for a buy signal, and a red dot for a sell signal. This technical indicator allows you to assess the current state of the market and make a decision about entering a trend movement with minimal risk. It uses a process of a
Owl Smart Levels MT5
Sergey Ermolov
4.47 (36)
Versão MT4  |  FAQ O Indicador Owl Smart Levels é um sistema de negociação completo dentro de um indicador que inclui ferramentas populares de análise de mercado, como fractais avançados de Bill Williams , Valable ZigZag que constrói a estrutura de onda correta do mercado e níveis de Fibonacci que marcam os níveis exatos de entrada no mercado e lugares para obter lucros. Descrição detalhada da estratégia Instruções para trabalhar com o indicador Consultor de negociação Owl Helper Chat privado d
Automated Trendlines MT5
Georgios Kalomoiropoulos
As linhas de tendência são a ferramenta mais essencial de análise técnica na negociação forex. Infelizmente, a maioria dos traders não os desenha corretamente. O indicador Automated Trendlines é uma ferramenta profissional para traders sérios que o ajudam a visualizar o movimento de tendências dos mercados. Existem dois tipos de Trendlines Bullish Trendlines e Bearish Trendlines. Na tendência de alta, a linha de tendência Forex é desenhada através dos pontos de oscilação mais baixos do m
The indicator determines the state of the market: trend or flat. The state of the market is determined by taking into account volatility. The flat (trading corridor)is displayed in yellow. The green color shows the upward trend. The red color shows the downward trend. The height of the label corresponds to the volatility in the market. The indicator does not redraw . Settings History_Size   - the amount of history for calculation. Period_Candles  - the number of candles to calculate the
I want again that the wedge light on all the indicators did not converge. No matter how hard you search, you still will not find an indicator that will always and in all conditions give you exclusively profitable signals. As you can see, everything is quite simple, and you don’t even need to analyze anything, in fact. In general, I would say that the Signal No Problem indicator can be a great help for creating your own trading system. It goes without saying that you don’t need to trade only by a
The Trend Complete indicator is a signal indicator and has interesting properties. It should be taken into account that this indicator reflects extremes and should be used as an additional one, and another instrument should be used for the entry point. Searches for and displays pivot points on the price chart. Trend indicators are one of the main tools for analyzing trends in the Forex market. The indicator is able to transmit all types of signals to the user: messages, E-mail and Push! The g
O indicador de tendência "Trend Two Moving Average" usa dois tipos de seta para exibir os resultados do cálculo - estes são "Trend UP" e "Trend DN".       Setas "Tendência para cima"       são desenhados       Por       preço       'Baixo'       barra   ,       A       Setas "Tendência DN" -       Por       preço       'alto'. O algoritmo de busca de tendências é baseado na análise do preço de uma barra e nos valores de dois indicadores de 'Moving Average'. A direção da tendência é calculada na
The ChanLun or Chan theory is one of the most popular trading theories in China. But it seems like that it has little influence in western countries. Actually, the Chan Theory is based on a sophisticated mathematical model. The basic idea ChanLun is to simplify the bar chart by its model. With the help of ChanLun, a trader can analyze and predict the trend of future goods, stocks. In ChanLun, there are several basic elements called fractals, strokes, line segments and pivots . A trader should p
Trend Direction ADX indicator Trend Direction ADX is part of a serie of indicators used to characterize market conditions. Almost any strategy only work under certain market conditions. Therefore it is important to be able to characterize market conditions at any time: trend direction, trend strength, volatility, etc.. Trend Direction ADX is an indicator to be used to characterize trend direction: trending up trending down ranging Trend Direction ADX is based on ADX standard indicator.
Oscillator trading signals - это динамический индикатор, определяющий состояние к продолжению тенденции роста или падению цены торгового инструмента и отсечению зон с нежелательной торговлей. Индикатор состоит из 2 линий осцилляторов. Медленная и быстрая сигнальная линия.  Шкала отображения перевернутая. Зоны вблизи 0 свидетельствуют о тенденции роста цены валютной пары. Зоны -100 свидетельствуют о падении цены валютной пары. На основном графике в виде стрелок отображается потенциально выгодные
XCalper TFO
Aecio de Feo Flora Neto
This oscillator was developed exclusively by xCalper in 2015 based on moving averages calculations to indicate and try predicting oversold and overbought levels. The fast line (white, by default) oscillates basically between values -0.5 (oversold) and +0.5 (overbought). Whenever this line crosses upward value -0.5, it means an oversold price level. When it crosses downward value +0.5, it means an overbought price level. When fast line crosses value 0.0 and returns, it is a strong pull-back indic
Hush mt5
Iurii Plokhov
4.33 (3)
Hush mt5 is an advanced indicator that gives a signal about the overbought or oversold market in a certain period of time Hush mt5 the advantage of this indicator is that it does not disappear after the signal on the chart Suitable for any trade: forex, stocks, cryptocurrency, metals Hush mt5 can be used on any time period. The signal goes to the beginning of the next candle after the arrow Hush mt5 performed best on the period H1,H4,daily It can be used in addition to forex, in binar
Reverse Rayer MT5
Oleksandr Novosiadlyi
Description Reverse Rayer  is an indicator that draws rays on inclined trend levels. Recommendations You can use this indicator to determine the trend and, accordingly, to determine the direction of opening a position or closing an opposite position. Parameters ===== _INDICATOR_SETTINGS_ =====  - indicator settings Maximum History Bars  - maximum number of history bars for calculating the indicator. Average True Range Period  - ATR indicator period (used to calculate the difference be
Multi-currency and multitimeframe Heikin Ashi indicator. Shows the current state of the market. On the scanner panel you can see the direction, strength and number of bars of the current trend. The Consolidation/Reversal candles are also shown using color. You can specify any desired currencies and periods in the parameters. Also, the indicator can send notifications when the trend changes or when reversal and consolidation candles (dojis) appear. By clicking on a cell, this symbol and period wi
This indicator is the same as the popular Heiken Ashi Smoothed. The Heikin Ashi indicator for MetaTrader 5 already exists, but it has two disadvantages: It paints the candles not accurate. It's not possible to change the candle width. See also Heikin Ashi in MQL5 Code Base . In this version there are no such disadvantages.
Golden Spikes Detector
Batsirayi L Marango
5 (1)
Golden Spikes Detector Este indicador é baseado em uma estratégia avançada principalmente para picos de negociação nos índices Boom e Crash. Algoritmos complexos foram implementados para detectar apenas entradas de alta probabilidade. Ele alerta sobre possíveis entradas de compra e venda. Para negociar picos na corretora Deriv ou Binária, receba apenas os alertas Buy Boom e Sell Cash. Ele foi otimizado para ser carregado em um período de 5 minutos, embora a análise de vários períodos de tempo se
Trend Side - um indicador técnico para determinar a tendência. É um conjunto de várias estratégias de negociação completas. O indicador utiliza um sistema avançado de filtragem de tendências, possui um painel estatístico, calcula os níveis de entrada e saída e calcula o nível dinâmico do Trailing Stop. Adequado para qualquer tipo de símbolos, nunca redesenha seus sinais e resultados. Uma ferramenta abrangente para negociação de tendências profissional. O conjunto do indicador Trend Side també
"GoldenSwing" is a comprehensive MetaTrader 5 indicator meticulously crafted by Southern Star Trading, designed to enhance your trading strategies with precision swing high and swing low identification. Harnessing the power of swing analysis, this indicator provides traders with invaluable insights into market reversals and trend continuations, enabling them to make informed trading decisions. With its advanced algorithm, GoldenSwing detects significant swing highs and swing lows in real-time
Технический индикатор Universal Oscillator является комбинацией торговых сигналов самых популярных и широко используемых осцилляторов. Индикатор представлен гистограммами, а также линиями fast и slow MA, что позволяет расширить список получаемых торговых рекомендаций и работать как по тренду, так и в боковом движении рынка. Таким образом, гистограммы позволяют определить момент пробоя ценовых значений и движение в новой фазе рынка, а линии указывают на зоны перекупленности и перепроданности.  Ос
Fractals
Mikhail Nazarenko
The Fractals indicator displays on the chart only fractals with the specified parameters in the indicator settings. This allows you to more accurately record a trend reversal, excluding false reversals. According to the classical definition of a fractal, it is a candlestick - an extremum on the chart, which was not crossed by the price of 2 candles before and 2 candles after the appearance of a fractal candle. This indicator provides the ability to adjust the number of candles before and after t
O HAshi-E é uma forma aprimorada de analisar os sinais do Heiken-Ashi. Resumo: O Heiken-Ashi é particularmente valorizado por sua capacidade de filtrar a volatilidade de curto prazo, o que o torna a ferramenta preferida para identificar e acompanhar tendências, ajuda na tomada de decisões sobre pontos de entrada e saída e auxilia na distinção entre sinais falsos e reversões genuínas de tendências. Diferentemente dos gráficos de velas tradicionais, as velas Heiken-Ashi são calculadas usando
TrendDetect
Pavel Gotkevitch
The Trend Detect indicator combines the features of both trend indicators and oscillators. This indicator is a convenient tool for detecting short-term market cycles and identifying overbought and oversold levels. A long position can be opened when the indicator starts leaving the oversold area and breaks the zero level from below. A short position can be opened when the indicator starts leaving the overbought area and breaks the zero level from above. An opposite signal of the indicator can
Ultimate Divergence Scanner (Multi Pair And Multi Time Frame) :   ---LIMITED TIME OFFER: NEXT 25 CLIENTS ONLY ---46% OFF REGULAR PRICE AND 2 FREE BONUSES ---SEE BELOW FOR FULL DETAILS It is a widely known market principle that momentum generally precedes price.  Making divergence patterns a clear indication that price and momentum are not in agreement.  Divergence patterns are widely used by institutional traders around the world. As they allow you to manage  your trades within strictly de
DYJ TRADINGVIEW é um sistema de classificação de vários indicadores, usando as contagens de sinais de classificação e ferramentas de análise para encontrar oportunidades de entrada nos mercados globais DYJ TRADINGVIEW possui 10 indicadores integrados para análise de mercado. A análise baseada em indicadores é usada por muitos traders para ajudá-los a tomar decisões sobre quais negociações realizar e onde entrar e sair delas. Usamos vários tipos diferentes que podem se complementar bem.
This is the spike indicator , determining the highest high and lowest lows of price in the given period ,  it is also a zigzag indicator , to it may recalculate the values  or repaint if a new higher high or lower low forms in that given period,so beware How ever the indicator can be very powerful when used with other technical indicators for entry confirmation  Be sure to check out some of my other premium products   
Os compradores deste produto também adquirem
Primeiramente, vale ressaltar que este Sistema de Trading é um Indicador Não Repintado, Não Redesenho e Não Atrasado, o que o torna ideal tanto para o trading manual quanto para o automatizado. O "Sistema de Trading Inteligente MT5" é uma solução completa de trading projetada para traders novos e experientes. Ele combina mais de 10 indicadores premium e apresenta mais de 7 estratégias de trading robustas, tornando-o uma escolha versátil para diversas condições de mercado. Estratégia de Seguime
Atomic Analyst MT5
Issam Kassas
3.64 (11)
Primeiramente, vale ressaltar que este Indicador de Negociação não repinta, não redesenha e não apresenta atrasos, tornando-o ideal tanto para negociação manual quanto automatizada. O Analista Atômico é um Indicador de Ação de Preço PA que utiliza a força e o momentum do preço para encontrar uma vantagem melhor no mercado. Equipado com filtros avançados que ajudam a remover ruídos e sinais falsos, e aumentam o potencial de negociação. Utilizando múltiplas camadas de indicadores complexos, o A
Quantum Trend Sniper
Bogdan Ion Puscasu
5 (37)
Apresentando       Quantum Trend Sniper Indicator   , o inovador Indicador MQL5 que está transformando a maneira como você identifica e negocia as reversões de tendência! Desenvolvido por uma equipe de traders experientes com experiência comercial de mais de 13 anos,       Indicador de Atirador de Tendência Quântica       foi projetado para impulsionar sua jornada de negociação a novos patamares com sua forma inovadora de identificar reversões de tendência com precisão extremamente alta. ***C
FX Volume MT5
Daniel Stein
4.94 (17)
Receba a sua atualização diária do mercado com detalhes e screenshots através do nosso Morning Briefing aqui no mql5 e no Telegram ! O Volume FX é o PRIMEIRO e ÚNICO indicador de volume que fornece uma visão REAL do sentimento do mercado do ponto de vista de um corretor. Ele fornece uma visão incrível de como os participantes do mercado institucional, como corretores, estão posicionados no mercado Forex, muito mais rápido do que os relatórios COT. Ver essas informações diretamente no seu gráfi
Trend Screener Pro MT5
STE S.S.COMPANY
4.89 (61)
Desbloqueie o poder da negociação de tendências com o indicador Trend Screener: sua solução definitiva de negociação de tendências, alimentada por lógica difusa e sistema de múltiplas moedas! Eleve sua negociação de tendências com o Trend Screener, o revolucionário indicador de tendências alimentado por lógica difusa. É um poderoso indicador de acompanhamento de tendências que combina mais de 13 ferramentas e recursos premium e 3 estratégias de negociação, tornando-o uma escolha versátil para to
Antes de tudo, vale ressaltar que esta Ferramenta de Negociação é um Indicador Não Repintante, Não Redesenhante e Não Atrasado, o que a torna ideal para negociação profissional. O Indicador de Conceitos de Ação de Preço Inteligente é uma ferramenta muito poderosa tanto para traders novos quanto experientes. Ele combina mais de 20 indicadores úteis em um único, combinando ideias avançadas de negociação como Análise do Trader do Círculo Interno e Estratégias de Negociação de Conceitos de Dinhei
FX Power MT5 NG
Daniel Stein
5 (4)
Receba a sua atualização diária do mercado com detalhes e screenshots através do nosso Morning Briefing aqui no mql5 e no Telegram ! O FX Power MT5 NG é a próxima geração do nosso medidor de força de moeda muito popular de longa data, o FX Power. E o que é que este medidor de força da próxima geração oferece? Tudo o que adorou no FX Power original MAIS Análise de força GOLD/XAU Resultados de cálculo ainda mais precisos Períodos de análise configuráveis individualmente Limite de cálculo personal
Advanced Supply Demand MT5
Bernhard Schweigert
4.53 (15)
Atualmente com 33% de desconto! A melhor solução para qualquer Trader Novato ou especialista! Este indicador é uma ferramenta de negociação exclusiva, de alta qualidade e acessível porque incorporamos uma série de recursos proprietários e uma nova fórmula. Com esta atualização, você poderá mostrar fusos horários duplos. Você não só será capaz de mostrar um TF mais alto, mas também mostrar ambos, o TF do gráfico, MAIS o TF mais alto: MOSTRANDO ZONAS ANINHADAS. Todos os traders de Oferta e Demanda
RelicusRoad Pro MT5
Relicus LLC
4.81 (21)
Agora US $ 147 (aumentando para US $ 499 após algumas atualizações) - Contas ilimitadas (PCs ou Macs) Manual do usuário do RelicusRoad + vídeos de treinamento + acesso ao grupo de discórdia privado + status VIP UMA NOVA FORMA DE OLHAR PARA O MERCADO O RelicusRoad é o indicador de negociação mais poderoso do mundo para forex, futuros, criptomoedas, ações e índices, oferecendo aos traders todas as informações e ferramentas necessárias para se manterem rentáveis. Fornecemos análises técnica
XQ Indicator MetaTrader 5
Marzena Maria Szmit
5 (1)
Step into the realm of Forex trading with confidence and precision using XQ, a cutting-edge Forex indicator designed to elevate your trading game to unprecedented heights. Whether you're a seasoned trader or just stepping into the world of currency exchange, XQ Forex Indicator empowers you with the insights and signals needed to make informed trading decisions. The signal conditions are a combination of three indicators, and XQ Forex Indicator only display  medium and long-term trends . The ind
The Volume by Price Indicator for MetaTrader 5 features Volume Profile and Market Profile TPO (Time Price Opportunity). Get valuable insights out of currencies, equities and commodities data. Gain an edge trading financial markets. Volume and TPO histogram bar and line charts. Volume Footprint charts. TPO letter and block marker charts including split structures. Versatile segmentation and compositing methods. Static, dynamic and flexible ranges with relative and/or absolute visualizations. Lay
Auto Order Block with break of structure based on ICT and Smart Money Concepts Futures Break of Structure ( BoS )             Order block ( OB )            Higher time frame Order block / Point of Interest ( POI )    shown on current chart           Fair value Gap ( FVG ) / Imbalance   ,  MTF      ( Multi Time Frame )    Volume Imbalance     ,  MTF          vIMB Gap’s Equal High / Low’s     ,  MTF             EQH / EQL Liquidity               Current Day High / Low           HOD /
Este é um indicador para MT5 que fornece sinais precisos para entrar em uma negociação sem redesenhar. Ele pode ser aplicado a qualquer ativo financeiro: forex, criptomoedas, metais, ações, índices. Ele fornecerá estimativas bastante precisas e informará quando é melhor abrir e fechar um negócio. Assista o vídeo (6:22) com um exemplo de processamento de apenas um sinal que compensou o indicador! A maioria dos traders melhora seus resultados de negociação durante a primeira semana de negociação c
ICT, SMC, SMART MONEY CONCEPTS, SMART MONEY, Smart Money Concept, Support and Resistance, Trend Analysis, Price Action, Market Structure, Order Blocks, BOS/CHoCH,   Breaker Blocks ,  Momentum Shift,   Supply&Demand Zone/Order Blocks , Strong Imbalance,   HH/LL/HL/LH,    Fair Value Gap, FVG,  Premium  &   Discount   Zones, Fibonacci Retracement, OTE, Buy Side Liquidity, Sell Side Liquidity, BSL/SSL Taken, Equal Highs & Lows, MTF Dashboard, Multiple Time Frame, BigBar, HTF OB, HTF Market Structure
Torne-se um Negociador Breaker e lucre com as mudanças na estrutura do mercado à medida que o preço reverte. O indicador de quebra de bloco de pedidos identifica quando uma tendência ou movimento de preço está chegando à exaustão e pronto para reverter. Ele o alerta sobre mudanças na estrutura do mercado, que normalmente ocorrem quando uma reversão ou uma grande retração está prestes a ocorrer. O indicador usa um cálculo proprietário que identifica rupturas e momento do preço. Toda vez que
Blahtech Supply Demand MT5
Blahtech Limited
4.57 (14)
Was: $299  Now: $99   Supply Demand uses previous price action to identify potential imbalances between buyers and sellers. The key is to identify the better odds zones, not just the untouched ones. Blahtech Supply Demand indicator delivers functionality previously unavailable on any trading platform. This 4-in-1 indicator not only highlights the higher probability zones using a multi-criteria strength engine, but also combines it with multi-timeframe trend analysis, previously confirmed swings
O Indicador de Quadrados de Gann é uma poderosa ferramenta de análise de mercado baseada no artigo "Fórmula Matemática para Previsões de Mercado" escrito por W.D. Gann, que se baseia em conceitos matemáticos para análise. Ele incorpora elementos das técnicas de Gann relacionadas com os quadrados de 144, 90 e 52, bem como o quadrado de 9. Além disso, inclui o método do  sobre como combinar o quadrado de 9 com canais e padrões de estrela. Manual do Usuário e Modo de Uso: Antes de usar este indicad
Trend Line Map Pro MT5
STE S.S.COMPANY
4.67 (9)
O indicador Trend Line Map é um complemento do Trend Screener Indicator. Ele funciona como um scanner para todos os sinais gerados pelo Trend screener (Trend Line Signals). É um Trend Line Scanner baseado no Trend Screener Indicator. Se você não tiver o Trend Screener Pro Indicator, o Trend Line Map Pro não funcionará. It's a Trend Line Scanner based on Trend Screener Indicator. If you don't have Trend Screener Pro Indicator,     the Trend Line Map Pro will not work . Acessando nosso Blog
TrendLine PRO MT5
Evgenii Aksenov
4.78 (49)
The Trend Line PRO indicator is an independent trading strategy. It shows the trend change, the entry point to the transaction, as well as automatically calculates three levels of Take Profit and Stop Loss protection Trend Line PRO is perfect for all Meta Trader symbols: currencies, metals, cryptocurrencies, stocks and indices Advantages of Trend Line PRO Never redraws its signals The possibility of using it as an independent strategy It has three automatic levels Take Profit and Stop Loss lev
Apresentando       Quantum Breakout PRO   , o inovador Indicador MQL5 que está transformando a maneira como você negocia Breakout Zones! Desenvolvido por uma equipe de traders experientes com experiência comercial de mais de 13 anos,       Quantum Breakout PRO       foi projetado para impulsionar sua jornada comercial a novos patamares com sua estratégia de zona de fuga inovadora e dinâmica. O Quantum Breakout Indicator lhe dará setas de sinal em zonas de breakout com 5 zonas-alvo de lucro e
AW Trend Predictor MT5
AW Trading Software Limited
4.76 (54)
A combinação de níveis de tendência e quebra em um sistema. Um algoritmo de indicador avançado filtra o ruído do mercado, determina a tendência, os pontos de entrada e os possíveis níveis de saída. Os sinais indicadores são registrados em um módulo estatístico, que permite selecionar as ferramentas mais adequadas, mostrando a eficácia do histórico do sinal. O indicador calcula as marcas Take Profit e Stop Loss. Manual e instruções ->   AQUI   / versão MT4 ->   AQUI Como negociar com o indicador
Gartley Hunter Multi
Siarhei Vashchylka
5 (5)
Gartley Hunter Multi - An indicator for searching for harmonic patterns simultaneously on dozens of trading instruments and on all classic timeframes: (m1, m5, m15, m30, H1, H4, D1, Wk, Mn). Manual (Be sure to read before purchasing) | Version for MT4 Advantages 1. Patterns: Gartley, Butterfly, Shark, Crab. Bat, Alternate Bat, Deep Crab, Cypher 2. Simultaneous search for patterns on dozens of trading instruments and on all classic timeframes 3. Search for patterns of all possible sizes. Fr
Was: $249  Now: $99   Market Profile defines a number of day types that can help the trader to determine market behaviour. A key feature is the Value Area, representing the range of price action where 70% of trading took place. Understanding the Value Area can give traders valuable insight into market direction and establish the higher odds trade. It is an excellent addition to any system you may be using. Inspired by Jim Dalton’s book “Mind Over Markets”, this indicator is designed to suit the
TPSpro TRENDPRO  - is a trend indicator that automatically analyzes the market and provides information about the trend and each of its changes, as well as giving signals for entering trades without redrawing! The indicator uses each candle, analyzing them separately. referring to different impulses - up or down impulse. Exact entry points into transactions for currencies, crypto, metals, stocks, indices!  -  Version MT4                  DETAILED DESCRIPTION        /       TRADING SETUPS       
Black Dragon indicator mt5
Ramil Minniakhmetov
4.82 (56)
O indicador de detecção de tendências complementará qualquer estratégia e também pode ser usado como uma ferramenta independente. Vantagens Fácil de usar, não sobrecarrega o gráfico com informações desnecessárias; Pode ser usado como filtro para qualquer estratégia; Possui níveis integrados de suporte e resistência dinâmicos, que podem ser usados ​​tanto para fins de lucro quanto para definir stop-loss; O indicador não muda de cor após o fechamento do castiçal;  Trabalha no mercado de ações
Matrix Arrow Indicator MT5
Juvenille Emperor Limited
5 (14)
O   Matrix Arrow Indicator MT5   é uma tendência única 10 em 1 seguindo um indicador multi-timeframe   100% sem repintura   que pode ser usado em todos os símbolos/instrumentos:   forex ,   commodities ,   criptomoedas ,   índices ,   ações .  O  Matrix Arrow Indicator MT5  determinará a tendência atual em seus estágios iniciais, reunindo informações e dados de até 10 indicadores padrão, que são: Índice de movimento direcional médio (ADX) Índice de canal de commodities (CCI) Velas clássicas de
IX Power MT5
Daniel Stein
5 (2)
O   IX Power   traz finalmente a precisão imbatível do FX Power para símbolos não-Forex. Determina com exatidão a intensidade das tendências a curto, médio e longo prazo nos seus índices, acções, mercadorias, ETFs e até criptomoedas favoritos. Pode   analisar tudo o que   o seu terminal tem para oferecer. Experimente e veja como   o seu timing melhora significativamente   quando negoceia. Características principais do IX Power Resultados de cálculo 100% precisos e sem repintura - para tod
Account Graph MT5
Kyra Nickaline Watson-gordon
5 (1)
An indicator to draw a graph of account current and historical state such as Balance, Equity, Margin, Free Margin, Margin Level, Drawdown, Account Profit, Deposit and Withdrawals. Indicator Inputs : Draw Balance Graph Draw Equity Graph Draw Margin Graph Draw Free Margin Graph Draw Margin Level Graph Draw Drawdown Graph Draw Account Profit Graph Hide Data on Chart and Buffers Connect Gaps by Lines Sign of DDs on Profit Sign of DDs on Loss Tips : The Indicator will draw historical balance gra
** All Symbols x All Timeframes scan just by pressing scanner button ** ***Contact me after purchase to send you instructions and add you in "123 scanner group" for sharing or seeing experiences with other users. After 15 years of experience in the markets and 3 years of programming, Winner indicator is ready. I would like to share with you! Introduction The 123 Pattern Scanner indicator with a special enhanced algorithm is a very repetitive common pattern finder with a high success rate . Inte
Smart Peak Bottom
Xiaoyu Huang
5 (2)
Este é um indicador claro para julgar topos e fundos e funciona bem para o mercado oscilante. Preço promocional 49$ → 59$ características bom em julgar topos e fundos Sem redesenho, sem deriva Cálculo rápido, sem atraso Modo de lembrete avançado Vários parâmetros e cores podem ser ajustados parâmetro "========== Principal ========" HighLowPeriod1 = 9 HighLowPeriod2 = 60 HighLowPeriod3 = 34 HighLowEMAPeriod = 4 MASignalPeriod = 5 "========== Notificar ========" UseAlertNotify = verdadeiro;
Filtro:
Sem comentários
Responder ao comentário