TSO Stochastic RSI MT5
- Indicadores
- Dionisis Nikolopoulos
- Versão: 1.15
- Atualizado: 29 junho 2019
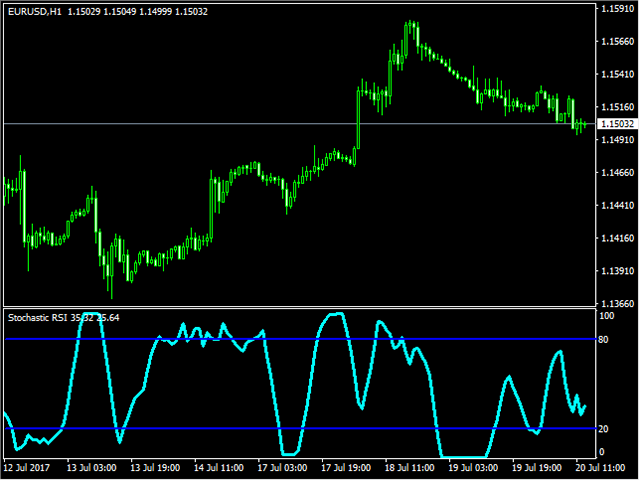
Stochastic RSI makes a stochastic calculation on the RSI indicator. The Relative Strength Index (RSI) is a well known momentum oscillator that measures the speed and change of price movements, developed by J. Welles Wilder.
Features
- Find overbought and oversold situations.
- Sound alert when overbought/oversold level is reached.
- Get email and/or push notification alerts when a signal is detected.
- The indicator is non-repainting.
- Returns buffer values for %K and %D to be used as part of an EA. (see below)
Basic Strategy
- Look for shorts when the price rises above the upper boundary.
- Look for longs when the price falls below the lower boundary.
Inputs
- RSI Period: Typically set to 14
- %K period: Typically set to 8
- %K Smoothing Period: Set to 1 for the default %K calculation. Set a higher value to have %K smoothed using an X-period Simple Moving Average (SMA). This also affects %D since it is the SMA of %K.
- %D period: Typically set to 5
For EA Developers
The indicator can be easily used as part of an EA.
- Buffer for %D value = 0
- Buffer for %K value = 1


Gute Arbeit, danke fürs teilen.