Fibo Candle Previous for MT5
- Indicadores
- Taras Slobodyanik
- Versão: 3.70
- Atualizado: 7 junho 2024
- Ativações: 10
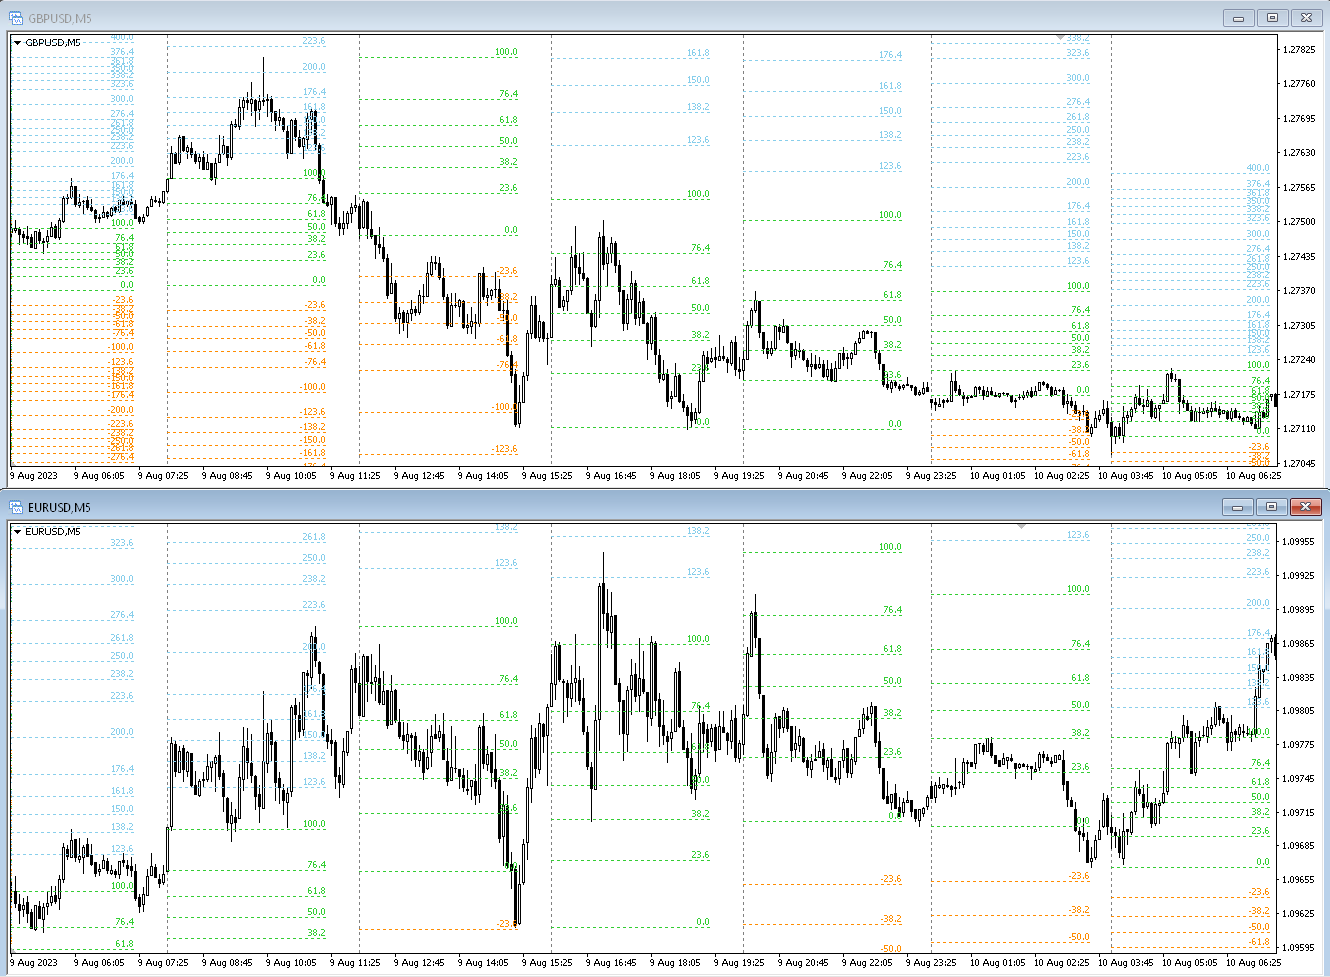
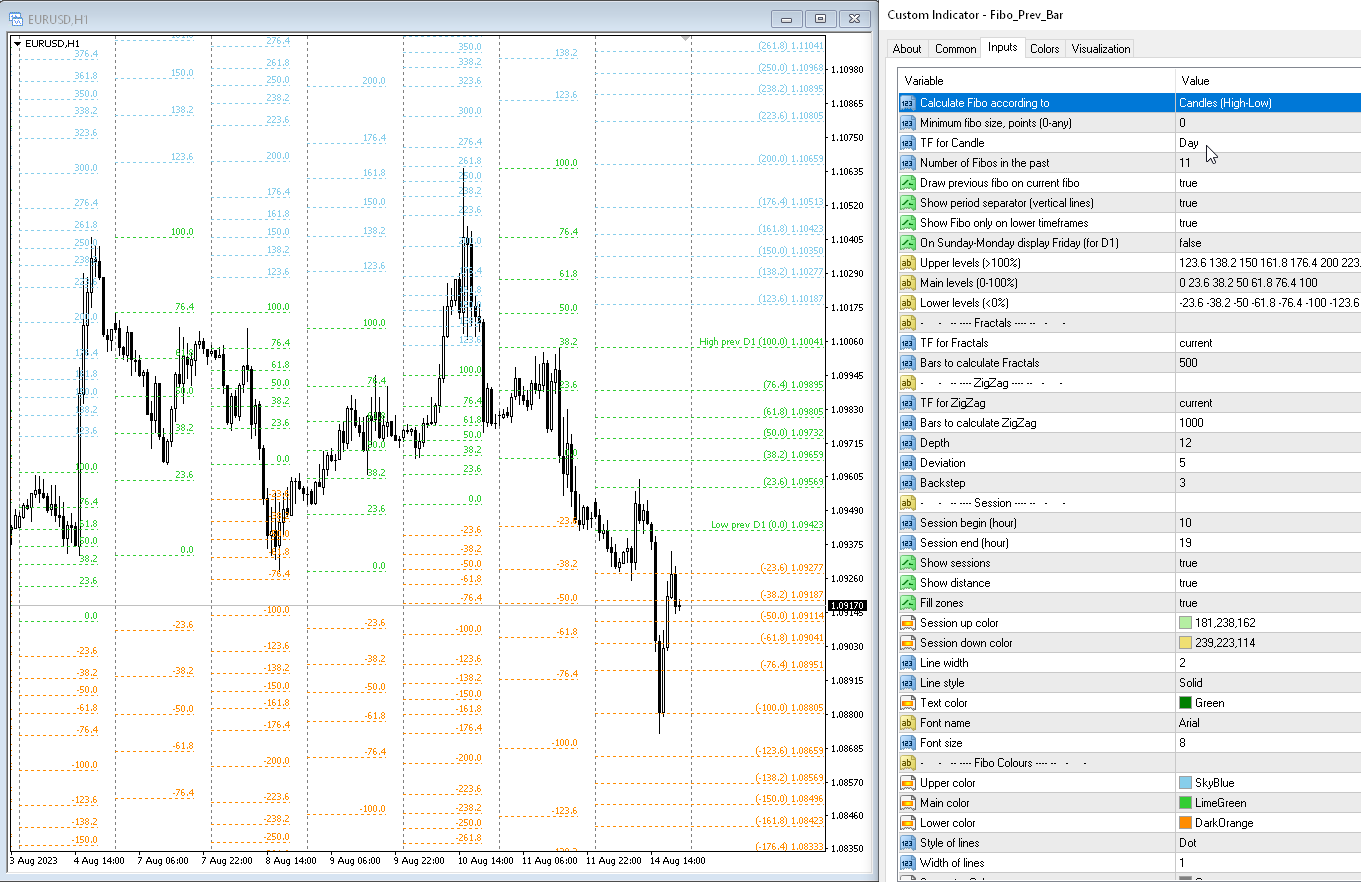
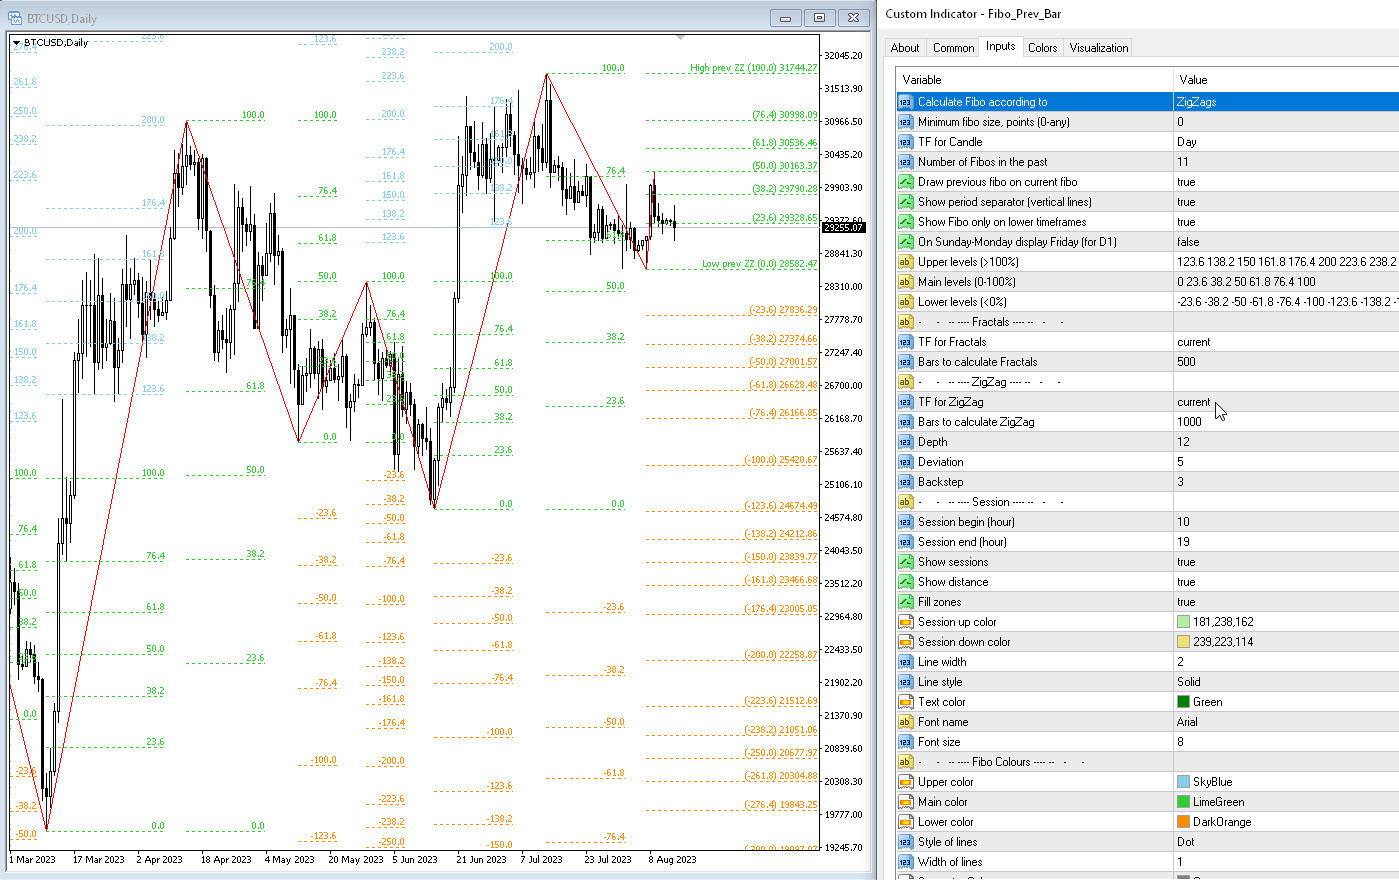
O indicador desenha automaticamente os níveis de Fibonacci com base no indicador ZigZag, sessões de negociação, fractais ou velas (incluindo períodos de tempo não padrão: ano, 6 meses, 4 meses, 3 meses, 2 meses) (Retração Fibo Automática). Você pode escolher qualquer período de tempo superior para o cálculo de Fibonachi.
Os níveis são redesenhados sempre que a barra atual fecha. É possível ativar alertas ao cruzar os níveis especificados.
Você também pode analisar níveis no histórico. Para fazer isso, é necessário especificar o número de níveis Fibo no parâmetro "Número de Fibo no passado".
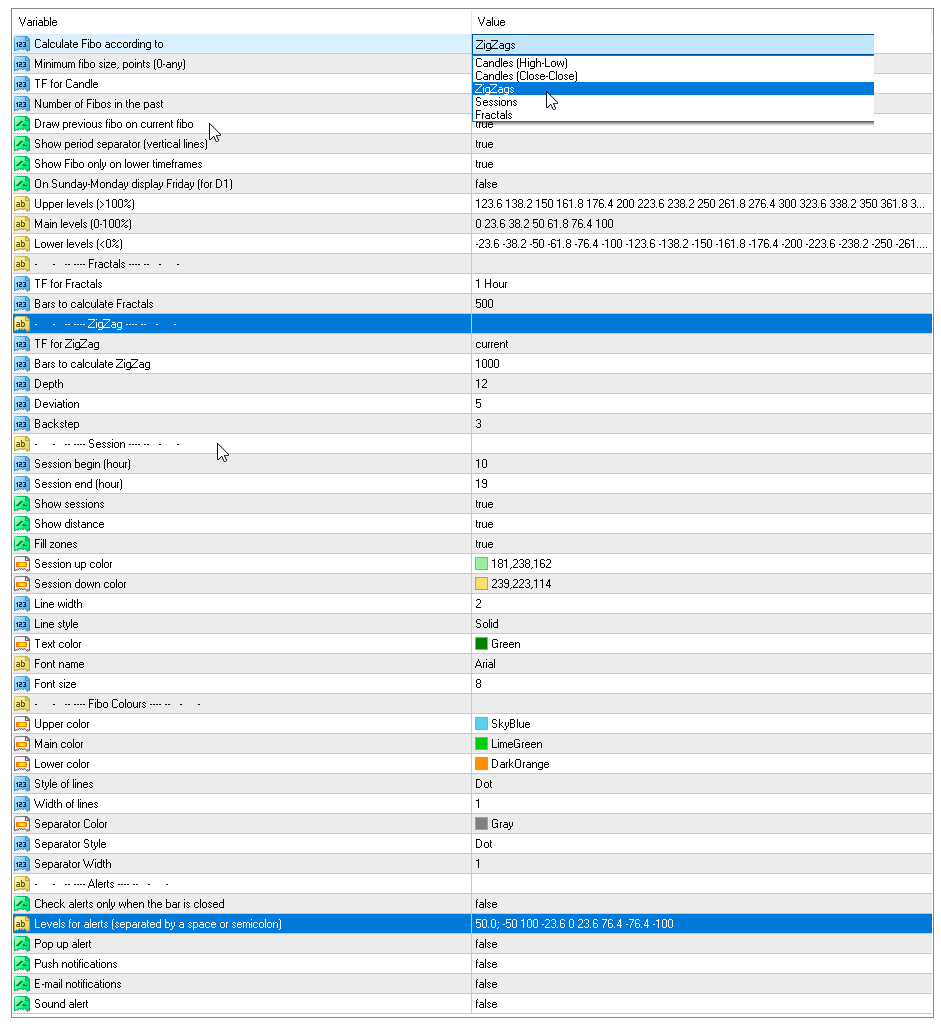
Parâmetros
Calculate Fibo according to — modos de pesquisa Fibo:
- Candles (High-Low) — construa uma fibo com base no alto-baixo;
- Candles (Close-Close) — construa um fibo baseado no close-close;
- ZigZags — constrói fibo por pontos ZigZag;
- Sessions — construir fibo por Sessões de Negociação;
- Fractals — construa fibo por pontos Fractais.
Minimum fibo size, points (0-any) — o tamanho mínimo do Fibo em pontos. Se o fibo for menor que esse tamanho, ele será ignorado.
TF for Candle — prazo das velas para construção de níveis Fibo;
Number of Fibo in the past — o número de níveis Fibo a serem plotados na história;
Upper levels (>100%) — níveis superiores, os valores devem ser maiores que 100 (separados por espaço ou ponto e vírgula);
Main levels (0-100%) — níveis intermediários, os valores devem estar entre 0 e 100 (separados por espaço ou ponto e vírgula);
Lower levels (<0%) — níveis inferiores, os valores devem ser menores que 100 (separados por espaço ou ponto e vírgula);
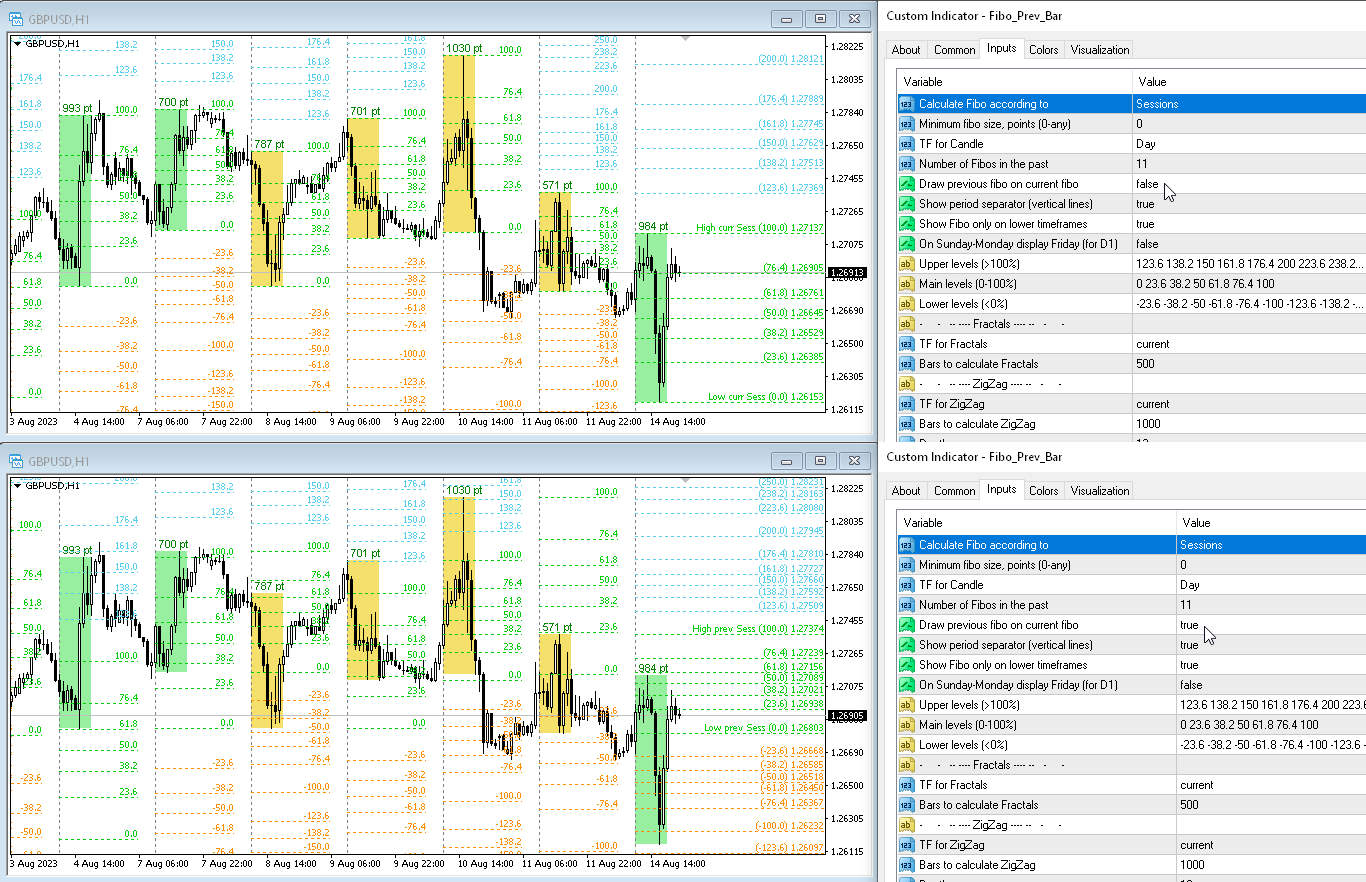
Draw previous fibo on current fibo — desenhe o Fibo anterior no lugar do Fibo atual. Se você desabilitar este parâmetro, os Fibos serão desenhados nos níveis em que foram calculados.
On Sunday-Monday display Friday (for D1) — se houver cotações de sábado a domingo, desenhe um fibo de sexta-feira. Somente para o período D1;
Show period separator (vertical lines) — mostra o separador de período. Serão exibidos como linhas verticais no gráfico;
Show Fibo only on lower timeframes — desenhe Fibo apenas em períodos menores;
Upper color — cor das linhas superiores;
Main color — cor das linhas médias;
Lower color — cor das linhas inferiores;
Style of lines — estilo de linha;
Width of lines — largura da linha;
Min pause between signals (sec) — pausa entre alertas em segundos;
Levels for alerts (separated by a space or semicolon) — níveis para alertas, separados por espaço ou ponto e vírgula;
Alerts — habilite alertas pop-up;
Push notification — habilite notificações push;
Send e-mail — envie e-mails.


This is one of the main indicators for my reviews, excellent the attentiveness of the developer to implement suggestions for improvements, great job!