• Visão global
  • Comentários (5)
  • Discussão (9)
  • O que há de novo

Labor

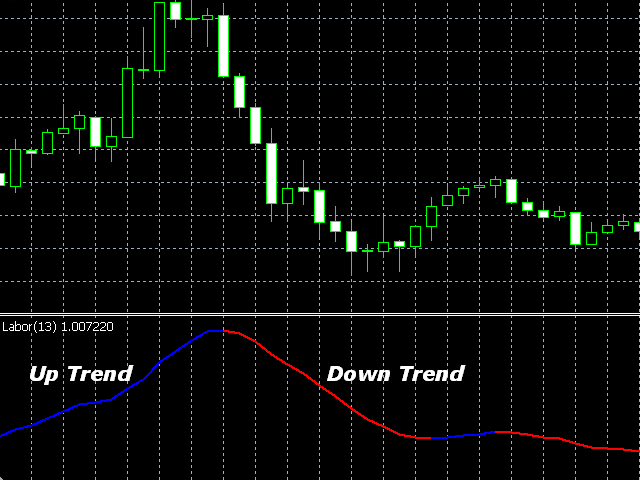
Labor is a technical analysis indicator defining trend direction and power, as well as signaling a trend change.

The indicator is based on a modified EMA (Exponential Moving Average) with an additional smoothing filter.

The indicator works on any timeframe.

The uptrend is shown as a blue line, while a downtrend - as a red one.

Close a short position and open a long one if the line color changes from red to blue.

Close a long position and open a short one if the line color changes from blue to red.

Use a small stop loss to protect against false signals.

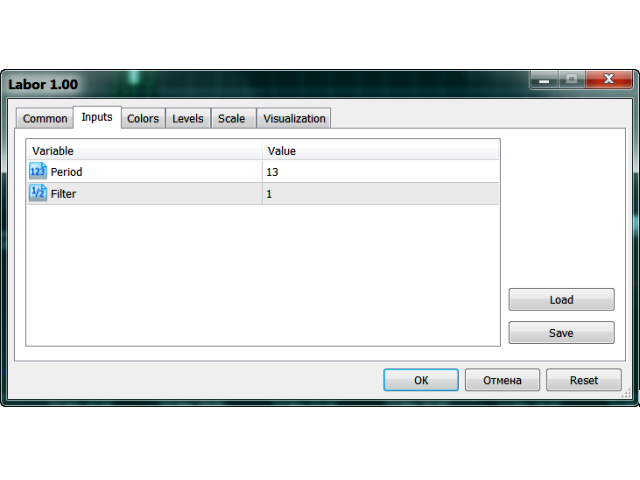
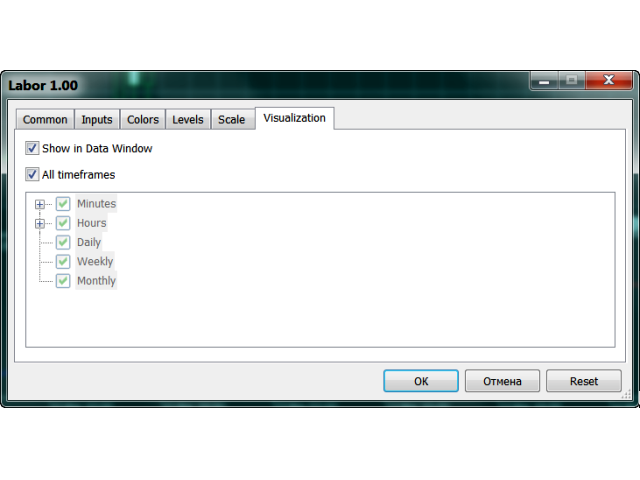
The indicator's Inputs tab allows you to select:

  • the indicator period;
  • the smoothing filter degree.

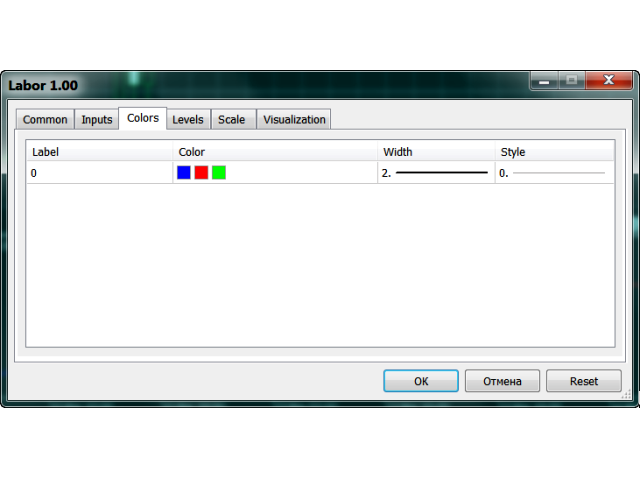
The Colors tab allows you to select the line color, width and style.


Parameters

  • period - number of bars used for the indicator calculation;
  • filter - smoothing filter degree.
Produtos recomendados
Follow The Line MT5
Oliver Gideon Amofa Appiah
4.42 (31)
This indicator obeys the popular maxim that: "THE TREND IS YOUR FRIEND" It paints a GREEN line for BUY and also paints a RED line for SELL. (you can change the colors). It gives alarms and alerts of all kinds. IT DOES NOT REPAINT and can be used for all currency pairs and timeframes. Yes, as easy and simple as that. Even a newbie can use it to make great and reliable trades. NB: For best results, get my other premium indicators for more powerful and reliable signals. Get them here: https://www.m
FREE
Owl Smart Levels MT5
Sergey Ermolov
4.47 (36)
Versão MT4  |  FAQ O Indicador Owl Smart Levels é um sistema de negociação completo dentro de um indicador que inclui ferramentas populares de análise de mercado, como fractais avançados de Bill Williams , Valable ZigZag que constrói a estrutura de onda correta do mercado e níveis de Fibonacci que marcam os níveis exatos de entrada no mercado e lugares para obter lucros. Descrição detalhada da estratégia Instruções para trabalhar com o indicador Consultor de negociação Owl Helper Chat privado d
This indicator is a zero-lag indicator and displays  strength of trend change . True Trend  Oscillator Pro works best in combination with True Trend Moving Average Pro that displays exact trend as is. Oscillator value is exact price change in given direction of the trend. True Trend Moving Average Pro: https://www.mql5.com/en/market/product/103586 If you set PERIOD input parameter to 1 this indicator becomes a sharpshooter for binary options. Developers can use True Trend Oscillator in E
FREE
LT Rainbow Trend
Thiago Duarte
5 (1)
Você, assim como eu, gosta de operar a favor da tendência? Então este indicador vai te ajudar! Rainbow Trend é um indicador de tendência, no qual utiliza várias Médias Móveis junto do gráfico. Ela mede diferentes zonas de força da tendência para diferentes prazos: muito curto, curto, médio, longo e muito longo. Cada zona tem sua cor, e é possível ter alertas sonoros quando o preço sai de uma zona e entra em outra. Sua configuração é muito simples. Se encontrou alguma falha ou tem alguma suges
Divergence MACD indicator shows price and MACD indicator divergence. The indicator is not redrawn! The algorithm for detection of price and MACD extremums has been balanced for the earliest entry allowing you to use the smallest SL order possible. The indicator displays all types of divergences including the hidden one, while having the minimum number of settings. Find out more about the divergence types in Comments tab. Launch settings: Max Bars - number of bars calculated on the chart. Indent
F Channel
Pavel Gotkevitch
F-Channel is a technical indicator defining the current Forex market status - trend or flat. The indicator is based on FRAMA (Fractal Adaptive Moving Average). The FRAMA follows strong trend movements and slows down significantly during price consolidation. The indicator is able to work on any timeframes, but H1 and higher timeframes are recommended to minimize false signals. The indicator displays a channel as lines located above and below the middle line. The upper and lower lines can serve as
The indicator detects and displays М. Gartley's Butterfly pattern. The pattern is plotted by the extreme values of the ZigZag indicator (included in the resources, no need to install). After detecting the pattern, the indicator notifies of that by the pop-up window, a mobile notification and an email. The pattern and wave parameters are displayed on the screenshots. The default parameters are used for demonstration purposes only in order to increase the amount of detected patterns. Parameters
What is this indicator? This indicator is the MACD (Moving Average Convergence/Divergence) supporting Virtual Trading mode of  Knots Compositor . When the mode is turned on, the indicator will be recalculated based on the displayed candlesticks. When the mode is turned off, the indicator will be recalculated based on the original chart candlesticks. Types of the applied price - Close - Open - High - Low - Median Price (HL/2) - Typical Price (HLC/3) - Weighted Price (HLCC/4) KC-Indicators
FREE
Important Lines
Terence Gronowski
4.88 (26)
This indicator displays Pivot-Lines, preday high and low, preday close and the minimum and maximum of the previous hour. You just have to put this single indicator to the chart to have all these important lines, no need to setup many single indicators. Why certain lines are important Preday high and low : These are watched by traders who trade in a daily chart. Very often, if price climbs over or falls under a preday low/high there is an acceleration in buying/selling. It is a breakout out of
FREE
Free automatic Fibonacci is an indicator that automatically plots a Fibonacci retracement based on the number of bars you select on the BarsToScan setting in the indicator. The Fibonacci is automatically updated in real time as new highest and lowest values appears amongst the selected bars. You can select which level values to be displayed in the indicator settings. You can also select the color of the levels thus enabling the trader to be able to attach the indicator several times with differe
FREE
Donchian Channel DC is the indicator of Donchian Channels, that plots maximum and minimum values of a specific period, besides mean value line. It´s possible to configure simple period for analysis and the indicator will plot all three values. You can trade with this indicator as trend or reversal, according to each strategy. Do not let to test others indicators as soon as others expert advisors.
Unda
Pavel Gotkevitch
The Unda indicator determines the trend direction and strength, as well as signals about trend changes. The indicator uses price extremums for the previous periods and calculates the ratio between the current price and extremums. Therefore, the only parameter is Period (default = 13), which sets the number of bars to determine extremums. The higher the Period, the less the number of signals about trend changes, but the greater the indicator delay. Uptrends are shown by blue color of the indicato
JAC Trend Color Candle
Eduardo Da Costa Custodio Santos
O indicador "JAC  Trend Color Candle" para Meta Trader 5, foi criado para facilitar visualmente a tendência para o trader. Ele tem como base três parâmetros, que identifica a tendência de alta, tendência de baixa e mercado sem tendência. As cores são podem ser configuradas pelo trader, e a média também pode ser configurada pelo trader. os parâmetros de tendência não podem ser configurados, pois, são o diferencial do indicador.
Slopes are an increasingly key concept in Technical Analysis. The most basic type is to calculate them on the prices, but also on technical indicators such as moving averages and the RSI. In technical analysis, you generally use the RSI to detect imminent reversal moves within a range. In the case of the Blue indicator, we are calculating the slope of the market price and then calculating the RSI of that slope in order to detect instances of reversal. The Blue indicator is therefore used
Are you tired of drawing trendlines every time you're analyzing charts? Or perhaps you would like more consistency in your technical analysis. Then this is for you. This indicator will draw trend lines automatically when dropped on a chart. How it works Works similar to standard deviation channel found on mt4 and mt5. It has 2 parameters: 1. Starting Bar 2. Number of bars for calculation The   starting bar   is the bar which drawing of the trend lines will begin, while the   number of bars for c
FREE
HMA Color with Alerts MT5
Pavel Zamoshnikov
4.73 (51)
Hull Moving Average (HMA) is well-deservedly popular among traders because of the effective averaging of market noise and a relatively small delay. The current MetaTrader 5 version changes its color when the movement direction changes. Sound and text signals are available. It also supports sending email and push messages. It is possible to trigger a signal on the current incomplete bar, although such a signal may be canceled before completion if conditions are no longer appropriate. One of the p
FREE
Swing Tracer
Ely Alsedy
5 (2)
it depends on ATR period to get swing points to help make better trading decisions  blue dot and red dot is the default color scheme of course you can change it later if you'd like  you can change the following : ATR PERIOD  sending notifications number of times to send notifications  sending notifications to your smart phone that's it very simple to use just drag and drop and follow the trend 
Dash
Pavel Gotkevitch
Dash is a histogram indicator, which measures the rate of price change and determines the overbought and oversold levels. The indicator uses price extremums for the previous periods and calculates the ratio between the current price and extremums. Therefore, the only parameter is Period , which sets the number of bars to determine extremums. A long position can be opened when the red lines of the indicator start leaving the oversold area and break the -1 level upwards. A short position can be op
Bollinger Bands B
Flavio Javier Jarabeck
5 (3)
John Bollinger created this indicator in 2010 as a way to read the original indicator (Bollinger Bands) in a more "technical" way, shown as an oscillator. The typical range of the Bollinger Bands %B is 0 - 0.5 - 1.0, where "0" represents the lower band, the "0.5" the middle band, and "1" the upper band. The line on the indicator represents the Closing prices. As simple as that. SETTINGS Bollinger Bands period of analysis Standard Deviation multiplier Shift Price type to be analyzed If you
FREE
Mitimom
Danil Poletavkin
The indicator is based on Robert Miner's methodology described in his book "High probability trading strategies" and displays signals along with momentum of 2 timeframes. A Stochastic oscillator is used as a momentum indicator. The settings speak for themselves period_1 is the current timeframe, 'current' period_2 is indicated - the senior timeframe is 4 or 5 times larger than the current one. For example, if the current one is 5 minutes, then the older one will be 20 minutes The rest of the
FREE
Point Black
Ignacio Agustin Mene Franco
Black Card Pack indicator 5/1 point black It has the strategy of professional bollingers where each arrow gives you a different entry signal. It is used to operate in m1 and in d1 It is used for scalping and intraday, modified for forex markets ! suitable for all pairs modified for synthetic index markets suitable for all pairs! Ideal for volatility and jumps!
Gobbo MT5
Alessandro Grossi
Gobbo è un indicatore professionale che evidenzia il trend del mercato con un aspetto grafico chiaro e comprensibile, è basato sulla Moving Average e può essere impostato su qualsiasi periodo di intervallo, di default impostato sul periodo 14, scegliendo un periodo più alto evidenzierà meno cambi di tendenza per un approccio sul medio o lungo periodo, con un periodo più basso più cambi di tendenza per un approccio sul breve termine L'aggiornamento e l'adattamento al time frame scelto avviene in
Macd Rsi
Ignacio Agustin Mene Franco
macd rsi It is a macd indicator added to the rsi to capture perfect entries in the average crossovers! As seen in the indicator, it has 2 lines, one of gold color and the other violet line, where the cross of the violet with the gold downwards is a sell signal when it crosses the violet up from the gold it is a buy signal! very good to make shorts works for forex markets and synthetic indices It is used in any temporality! Good profit! World Investor.
O nível Premium é um indicador único com mais de 80% de precisão nas previsões corretas! Este indicador foi testado pelos melhores Especialistas em Negociação por mais de dois meses! O indicador do autor você não encontrará em nenhum outro lugar! A partir das imagens você pode ver por si mesmo a precisão desta ferramenta! 1 é ótimo para negociar opções binárias com um tempo de expiração de 1 vela. 2 funciona em todos os pares de moedas, ações, commodities, criptomoedas Instruções:
Combined
Ahmed Alaaeldin Abdulrahman Ahmed Elherzawi
5 (1)
Welcome to Investment Castle products This product is exclusively available in the MQL5 market and is not available and will not be available anywehere else. The Combined indicator is a multi-time frame indicator and it is built using 3 indicators: Bands indicator which draws the support and resistance key levels using up to 5 different time frames Patterns indicator which draws the chart patterns using up to 6 different time frames Spots indicator which shows the common candlestick patterns Yo
InfinX Slope MT5
Stanislav Shtiliyanov
The Slope indicator   measures the slope of a linear regression , which is the line of best fit for a data series. A 20-period Slope, therefore, measures the slope of a 20-day linear regression. ... In general, a positive slope indicates an uptrend, while a negative slope indicates a downtrend. How do you use slope Indicator? By applying the slope indicator  to both the price chart and the price relative , chartists can quantify the price trend and relative performance with one indicator. A po
Este é um indicador MTF dos níveis de suporte e resistência com base nos   extremos do indicador Advanced ZigZag Dynamic   e / ou   Extended Fractals   com etiquetas de preço (pode ser desativado). TFs mais altos podem ser selecionados para o modo MTF. Por padrão, os níveis são gerados com base nos pontos do indicador ZigZag. Os pontos indicadores fractais também podem ser usados em conjunto com o ZigZag ou em vez dele. Para simplificar o uso e economizar tempo de CPU, o cálculo é realizado uma
O indicador identifica quando ocorre uma divergência entre o preço e um indicador ou oscilador. Ele identifica divergências regulares e ocultas. Combinado com suas próprias regras e técnicas, este indicador permitirá que você crie (ou aprimore) seu próprio sistema poderoso. Recursos Pode detectar divergências para os seguintes osciladores / indicadores:       MACD, OsMA, Stochastics, RSI, CCI, RVI, Awesome, ADX, ATR, OBV, Índice composto, MFI e Momentum. Apenas um oscilador / indicador pode se
FREE
Bounce Zone MT5
Nguyen Thanh Cong
4 (6)
Introduction The Bounce Zone indicator is a cutting-edge non-repainting technical tool built to identify key areas on the price chart where market sentiment is likely to cause a significant price reversal. Using advanced algorithms and historical price data analysis, this indicator pinpoints potential bounce zones. Combined with other entry signal, this indicator can help forex traders place the best trades possible Signal A possible buy signal is generated when price is in the green zo
FREE
PZ Penta O MT5
PZ TRADING SLU
4 (6)
The Penta-O is a 6-point retracement harmonacci pattern which usually precedes big market movements. Penta-O patterns can expand and repaint quite a bit. To make things easier this indicator implements a twist: it waits for a donchian breakout in the right direction before signaling the trade. The end result is an otherwise repainting indicator with a very reliable trading signal. The donchian breakout period is entered as an input. [ Installation Guide | Update Guide | Troubleshooting | FAQ | A
FREE
Os compradores deste produto também adquirem
Primeiramente, vale ressaltar que este Sistema de Trading é um Indicador Não Repintado, Não Redesenho e Não Atrasado, o que o torna ideal tanto para o trading manual quanto para o automatizado. O "Sistema de Trading Inteligente MT5" é uma solução completa de trading projetada para traders novos e experientes. Ele combina mais de 10 indicadores premium e apresenta mais de 7 estratégias de trading robustas, tornando-o uma escolha versátil para diversas condições de mercado. Estratégia de Seguime
Atomic Analyst MT5
Issam Kassas
3.64 (11)
Primeiramente, vale ressaltar que este Indicador de Negociação não repinta, não redesenha e não apresenta atrasos, tornando-o ideal tanto para negociação manual quanto automatizada. O Analista Atômico é um Indicador de Ação de Preço PA que utiliza a força e o momentum do preço para encontrar uma vantagem melhor no mercado. Equipado com filtros avançados que ajudam a remover ruídos e sinais falsos, e aumentam o potencial de negociação. Utilizando múltiplas camadas de indicadores complexos, o A
Quantum Trend Sniper
Bogdan Ion Puscasu
5 (37)
Apresentando       Quantum Trend Sniper Indicator   , o inovador Indicador MQL5 que está transformando a maneira como você identifica e negocia as reversões de tendência! Desenvolvido por uma equipe de traders experientes com experiência comercial de mais de 13 anos,       Indicador de Atirador de Tendência Quântica       foi projetado para impulsionar sua jornada de negociação a novos patamares com sua forma inovadora de identificar reversões de tendência com precisão extremamente alta. ***C
FX Volume MT5
Daniel Stein
4.94 (17)
Receba a sua atualização diária do mercado com detalhes e screenshots através do nosso Morning Briefing aqui no mql5 e no Telegram ! O Volume FX é o PRIMEIRO e ÚNICO indicador de volume que fornece uma visão REAL do sentimento do mercado do ponto de vista de um corretor. Ele fornece uma visão incrível de como os participantes do mercado institucional, como corretores, estão posicionados no mercado Forex, muito mais rápido do que os relatórios COT. Ver essas informações diretamente no seu gráfi
Trend Screener Pro MT5
STE S.S.COMPANY
4.89 (61)
Desbloqueie o poder da negociação de tendências com o indicador Trend Screener: sua solução definitiva de negociação de tendências, alimentada por lógica difusa e sistema de múltiplas moedas! Eleve sua negociação de tendências com o Trend Screener, o revolucionário indicador de tendências alimentado por lógica difusa. É um poderoso indicador de acompanhamento de tendências que combina mais de 13 ferramentas e recursos premium e 3 estratégias de negociação, tornando-o uma escolha versátil para to
Antes de tudo, vale ressaltar que esta Ferramenta de Negociação é um Indicador Não Repintante, Não Redesenhante e Não Atrasado, o que a torna ideal para negociação profissional. O Indicador de Conceitos de Ação de Preço Inteligente é uma ferramenta muito poderosa tanto para traders novos quanto experientes. Ele combina mais de 20 indicadores úteis em um único, combinando ideias avançadas de negociação como Análise do Trader do Círculo Interno e Estratégias de Negociação de Conceitos de Dinhei
FX Power MT5 NG
Daniel Stein
5 (4)
Receba a sua atualização diária do mercado com detalhes e screenshots através do nosso Morning Briefing aqui no mql5 e no Telegram ! O FX Power MT5 NG é a próxima geração do nosso medidor de força de moeda muito popular de longa data, o FX Power. E o que é que este medidor de força da próxima geração oferece? Tudo o que adorou no FX Power original MAIS Análise de força GOLD/XAU Resultados de cálculo ainda mais precisos Períodos de análise configuráveis individualmente Limite de cálculo personal
Advanced Supply Demand MT5
Bernhard Schweigert
4.53 (15)
Atualmente com 33% de desconto! A melhor solução para qualquer Trader Novato ou especialista! Este indicador é uma ferramenta de negociação exclusiva, de alta qualidade e acessível porque incorporamos uma série de recursos proprietários e uma nova fórmula. Com esta atualização, você poderá mostrar fusos horários duplos. Você não só será capaz de mostrar um TF mais alto, mas também mostrar ambos, o TF do gráfico, MAIS o TF mais alto: MOSTRANDO ZONAS ANINHADAS. Todos os traders de Oferta e Demanda
RelicusRoad Pro MT5
Relicus LLC
4.82 (22)
Agora US $ 147 (aumentando para US $ 499 após algumas atualizações) - Contas ilimitadas (PCs ou Macs) Manual do usuário do RelicusRoad + vídeos de treinamento + acesso ao grupo de discórdia privado + status VIP UMA NOVA FORMA DE OLHAR PARA O MERCADO O RelicusRoad é o indicador de negociação mais poderoso do mundo para forex, futuros, criptomoedas, ações e índices, oferecendo aos traders todas as informações e ferramentas necessárias para se manterem rentáveis. Fornecemos análises técnica
XQ Indicator MetaTrader 5
Marzena Maria Szmit
5 (1)
Step into the realm of Forex trading with confidence and precision using XQ, a cutting-edge Forex indicator designed to elevate your trading game to unprecedented heights. Whether you're a seasoned trader or just stepping into the world of currency exchange, XQ Forex Indicator empowers you with the insights and signals needed to make informed trading decisions. The signal conditions are a combination of three indicators, and XQ Forex Indicator only display  medium and long-term trends . The ind
The Volume by Price Indicator for MetaTrader 5 features Volume Profile and Market Profile TPO (Time Price Opportunity). Get valuable insights out of currencies, equities and commodities data. Gain an edge trading financial markets. Volume and TPO histogram bar and line charts. Volume Footprint charts. TPO letter and block marker charts including split structures. Versatile segmentation and compositing methods. Static, dynamic and flexible ranges with relative and/or absolute visualizations. Lay
Auto Order Block with break of structure based on ICT and Smart Money Concepts Futures Break of Structure ( BoS )             Order block ( OB )            Higher time frame Order block / Point of Interest ( POI )    shown on current chart           Fair value Gap ( FVG ) / Imbalance   ,  MTF      ( Multi Time Frame )    Volume Imbalance     ,  MTF          vIMB Gap’s Equal High / Low’s     ,  MTF             EQH / EQL Liquidity               Current Day High / Low           HOD /
Este é um indicador para MT5 que fornece sinais precisos para entrar em uma negociação sem redesenhar. Ele pode ser aplicado a qualquer ativo financeiro: forex, criptomoedas, metais, ações, índices. Ele fornecerá estimativas bastante precisas e informará quando é melhor abrir e fechar um negócio. Assista o vídeo (6:22) com um exemplo de processamento de apenas um sinal que compensou o indicador! A maioria dos traders melhora seus resultados de negociação durante a primeira semana de negociação c
ICT, SMC, SMART MONEY CONCEPTS, SMART MONEY, Smart Money Concept, Support and Resistance, Trend Analysis, Price Action, Market Structure, Order Blocks, BOS/CHoCH,   Breaker Blocks ,  Momentum Shift,   Supply&Demand Zone/Order Blocks , Strong Imbalance,   HH/LL/HL/LH,    Fair Value Gap, FVG,  Premium  &   Discount   Zones, Fibonacci Retracement, OTE, Buy Side Liquidity, Sell Side Liquidity, BSL/SSL Taken, Equal Highs & Lows, MTF Dashboard, Multiple Time Frame, BigBar, HTF OB, HTF Market Structure
Torne-se um Negociador Breaker e lucre com as mudanças na estrutura do mercado à medida que o preço reverte. O indicador de quebra de bloco de pedidos identifica quando uma tendência ou movimento de preço está chegando à exaustão e pronto para reverter. Ele o alerta sobre mudanças na estrutura do mercado, que normalmente ocorrem quando uma reversão ou uma grande retração está prestes a ocorrer. O indicador usa um cálculo proprietário que identifica rupturas e momento do preço. Toda vez que
Blahtech Supply Demand MT5
Blahtech Limited
4.57 (14)
Was: $299  Now: $99   Supply Demand uses previous price action to identify potential imbalances between buyers and sellers. The key is to identify the better odds zones, not just the untouched ones. Blahtech Supply Demand indicator delivers functionality previously unavailable on any trading platform. This 4-in-1 indicator not only highlights the higher probability zones using a multi-criteria strength engine, but also combines it with multi-timeframe trend analysis, previously confirmed swings
O Indicador de Quadrados de Gann é uma poderosa ferramenta de análise de mercado baseada no artigo "Fórmula Matemática para Previsões de Mercado" escrito por W.D. Gann, que se baseia em conceitos matemáticos para análise. Ele incorpora elementos das técnicas de Gann relacionadas com os quadrados de 144, 90 e 52, bem como o quadrado de 9. Além disso, inclui o método do  sobre como combinar o quadrado de 9 com canais e padrões de estrela. Manual do Usuário e Modo de Uso: Antes de usar este indicad
Trend Line Map Pro MT5
STE S.S.COMPANY
4.67 (9)
O indicador Trend Line Map é um complemento do Trend Screener Indicator. Ele funciona como um scanner para todos os sinais gerados pelo Trend screener (Trend Line Signals). É um Trend Line Scanner baseado no Trend Screener Indicator. Se você não tiver o Trend Screener Pro Indicator, o Trend Line Map Pro não funcionará. It's a Trend Line Scanner based on Trend Screener Indicator. If you don't have Trend Screener Pro Indicator,     the Trend Line Map Pro will not work . Acessando nosso Blog
TrendLine PRO MT5
Evgenii Aksenov
4.78 (49)
The Trend Line PRO indicator is an independent trading strategy. It shows the trend change, the entry point to the transaction, as well as automatically calculates three levels of Take Profit and Stop Loss protection Trend Line PRO is perfect for all Meta Trader symbols: currencies, metals, cryptocurrencies, stocks and indices Advantages of Trend Line PRO Never redraws its signals The possibility of using it as an independent strategy It has three automatic levels Take Profit and Stop Loss lev
Apresentando       Quantum Breakout PRO   , o inovador Indicador MQL5 que está transformando a maneira como você negocia Breakout Zones! Desenvolvido por uma equipe de traders experientes com experiência comercial de mais de 13 anos,       Quantum Breakout PRO       foi projetado para impulsionar sua jornada comercial a novos patamares com sua estratégia de zona de fuga inovadora e dinâmica. O Quantum Breakout Indicator lhe dará setas de sinal em zonas de breakout com 5 zonas-alvo de lucro e
AW Trend Predictor MT5
AW Trading Software Limited
4.76 (54)
A combinação de níveis de tendência e quebra em um sistema. Um algoritmo de indicador avançado filtra o ruído do mercado, determina a tendência, os pontos de entrada e os possíveis níveis de saída. Os sinais indicadores são registrados em um módulo estatístico, que permite selecionar as ferramentas mais adequadas, mostrando a eficácia do histórico do sinal. O indicador calcula as marcas Take Profit e Stop Loss. Manual e instruções ->   AQUI   / versão MT4 ->   AQUI Como negociar com o indicador
Gartley Hunter Multi
Siarhei Vashchylka
5 (5)
Gartley Hunter Multi - An indicator for searching for harmonic patterns simultaneously on dozens of trading instruments and on all classic timeframes: (m1, m5, m15, m30, H1, H4, D1, Wk, Mn). Manual (Be sure to read before purchasing) | Version for MT4 Advantages 1. Patterns: Gartley, Butterfly, Shark, Crab. Bat, Alternate Bat, Deep Crab, Cypher 2. Simultaneous search for patterns on dozens of trading instruments and on all classic timeframes 3. Search for patterns of all possible sizes. Fr
Was: $249  Now: $99   Market Profile defines a number of day types that can help the trader to determine market behaviour. A key feature is the Value Area, representing the range of price action where 70% of trading took place. Understanding the Value Area can give traders valuable insight into market direction and establish the higher odds trade. It is an excellent addition to any system you may be using. Inspired by Jim Dalton’s book “Mind Over Markets”, this indicator is designed to suit the
TPSpro TRENDPRO  - is a trend indicator that automatically analyzes the market and provides information about the trend and each of its changes, as well as giving signals for entering trades without redrawing! The indicator uses each candle, analyzing them separately. referring to different impulses - up or down impulse. Exact entry points into transactions for currencies, crypto, metals, stocks, indices!  -  Version MT4                  DETAILED DESCRIPTION        /       TRADING SETUPS       
Golden Spikes Detector
Batsirayi L Marango
5 (1)
Golden Spikes Detector Este indicador é baseado em uma estratégia avançada principalmente para picos de negociação nos índices Boom e Crash. Algoritmos complexos foram implementados para detectar apenas entradas de alta probabilidade. Ele alerta sobre possíveis entradas de compra e venda. Para negociar picos na corretora Deriv ou Binária, receba apenas os alertas Buy Boom e Sell Cash. Ele foi otimizado para ser carregado em um período de 5 minutos, embora a análise de vários períodos de tempo se
Matrix Arrow Indicator MT5
Juvenille Emperor Limited
5 (14)
O   Matrix Arrow Indicator MT5   é uma tendência única 10 em 1 seguindo um indicador multi-timeframe   100% sem repintura   que pode ser usado em todos os símbolos/instrumentos:   forex ,   commodities ,   criptomoedas ,   índices ,   ações .  O  Matrix Arrow Indicator MT5  determinará a tendência atual em seus estágios iniciais, reunindo informações e dados de até 10 indicadores padrão, que são: Índice de movimento direcional médio (ADX) Índice de canal de commodities (CCI) Velas clássicas de
IX Power MT5
Daniel Stein
5 (2)
O   IX Power   traz finalmente a precisão imbatível do FX Power para símbolos não-Forex. Determina com exatidão a intensidade das tendências a curto, médio e longo prazo nos seus índices, acções, mercadorias, ETFs e até criptomoedas favoritos. Pode   analisar tudo o que   o seu terminal tem para oferecer. Experimente e veja como   o seu timing melhora significativamente   quando negoceia. Características principais do IX Power Resultados de cálculo 100% precisos e sem repintura - para tod
Account Graph MT5
Kyra Nickaline Watson-gordon
5 (1)
An indicator to draw a graph of account current and historical state such as Balance, Equity, Margin, Free Margin, Margin Level, Drawdown, Account Profit, Deposit and Withdrawals. Indicator Inputs : Draw Balance Graph Draw Equity Graph Draw Margin Graph Draw Free Margin Graph Draw Margin Level Graph Draw Drawdown Graph Draw Account Profit Graph Hide Data on Chart and Buffers Connect Gaps by Lines Sign of DDs on Profit Sign of DDs on Loss Tips : The Indicator will draw historical balance gra
** All Symbols x All Timeframes scan just by pressing scanner button ** ***Contact me after purchase to send you instructions and add you in "123 scanner group" for sharing or seeing experiences with other users. After 15 years of experience in the markets and 3 years of programming, Winner indicator is ready. I would like to share with you! Introduction The 123 Pattern Scanner indicator with a special enhanced algorithm is a very repetitive common pattern finder with a high success rate . Inte
Smart Peak Bottom
Xiaoyu Huang
5 (2)
Este é um indicador claro para julgar topos e fundos e funciona bem para o mercado oscilante. Preço promocional 49$ → 59$ características bom em julgar topos e fundos Sem redesenho, sem deriva Cálculo rápido, sem atraso Modo de lembrete avançado Vários parâmetros e cores podem ser ajustados parâmetro "========== Principal ========" HighLowPeriod1 = 9 HighLowPeriod2 = 60 HighLowPeriod3 = 34 HighLowEMAPeriod = 4 MASignalPeriod = 5 "========== Notificar ========" UseAlertNotify = verdadeiro;
Mais do autor
Vates
Pavel Gotkevitch
4 (6)
Vates is a Latin word meaning a prophet. Vates is a multicurrency trend Expert Advisor that can run on any type real accounts, on any timeframe, with any initial deposit, with a fixed or varying lot size, with four and five-digit quotes, with brokers offering different order filling types. A distinctive feature of the EA is its stability and reliability. The results of Expert Advisor testing in the Strategy Tester in four modes (two main modes – normal and with a delay, and two additional modes
DeMarker Mod
Pavel Gotkevitch
3.8 (5)
В стандартном индикаторе DeMarker используется простая скользящая средняя - Simple Moving Average, что несколько ограничивает возможности этого индикатора. В представленном индикаторе DeMarker Mod добавлен выбор из четырех скользящих средних - Simple, Exponential, Smoothed, Linear weighted, что позволяет существенно расширить возможности данного индикатора.   Параметры стандартного индикатора DeMarker: ·         period  - количество баров, используемых для расчета индикатора;   Параметры индикат
FREE
Bulls Power Mod
Pavel Gotkevitch
4 (4)
Only Exponential Moving Average at Close Price is used in standard Bulls Power limiting the possibilities of that indicator to some extent. Bulls Power Mod enables you to select from four Moving Averages and seven applied prices, thus greatly expanding the indicator's functionality.
FREE
Bears Power Mod
Pavel Gotkevitch
4 (5)
Only Exponential Moving Average at Close Price is used in standard Bears Power limiting the possibilities of that indicator to some extent. Bears Power Mod enables you to select from four Moving Averages and seven applied prices, thus greatly expanding the indicator's functionality.
FREE
MAPC
Pavel Gotkevitch
3.75 (4)
MAPC (Moving Average Percent's Change) shows the Moving Average's percent change from one period to another selected period allowing you to track the smoothed price change rate. MAPC is calculated according to the following equation: MAPC[i] = 100 * (MA[i] - MA[i - n]) / MA[i],  where: MA[i] - current Moving Average value;   MA[i - n] - value of the Moving Average that is n periods away from the current Moving Average value. Input Parameters Period - Moving Average period; Method - smoothing m
FREE
Indicador Support & Resistance é uma modificação do indicador Fractals, padrão Bill Williams. O indicador funciona em qualquer prazo. Ele exibe os níveis de suporte e resistência no gráfico e permite a definição do stop loss e take profit (você pode verificar o valor exato, colocando o cursor do mouse sobre o nível). Linhas tracejadas Azul são nível de suporte. Linhas tracejadas vermelho são nível de resistência. Se você quiser, você pode mudar o estilo e a cor dessas linhas. Se o preço se aprox
MA Crossing
Pavel Gotkevitch
MA Crossing displays two moving averages on the chart painting their crossing points in different colors - blue (buy) and red (sell). The indicator clearly defines the trend direction and power and simplifies the perception of market signals. The indicator may be useful in the strategies involving two moving averages' crossing method. The indicator's input parameters allow you to select the following settings for each moving average: period (Fast Period, Slow Period); smoothing period (Simple, E
Grab
Pavel Gotkevitch
The Grab indicator combines the features of both trend indicators and oscillators. This indicator is a convenient tool for detecting short-term market cycles and identifying overbought and oversold levels. A long position can be opened when the indicator starts leaving the oversold area and breaks the zero level from below. A short position can be opened when the indicator starts leaving the overbought area and breaks the zero level from above. An opposite signal of the indicator can be used for
CCI Modified
Pavel Gotkevitch
The standard Commodity Channel Index (CCI) indicator uses a Simple Moving Average, which somewhat limits capabilities of this indicator. The presented CCI Modified indicator features a selection of four moving averages - Simple, Exponential, Smoothed, Linear weighted, which allows to significantly extend the capabilities of this indicator. Parameter of the standard Commodity Channel Index (CCI) indicator period - the number of bars used for the indicator calculations; apply to - selection from
Unda
Pavel Gotkevitch
The Unda indicator determines the trend direction and strength, as well as signals about trend changes. The indicator uses price extremums for the previous periods and calculates the ratio between the current price and extremums. Therefore, the only parameter is Period (default = 13), which sets the number of bars to determine extremums. The higher the Period, the less the number of signals about trend changes, but the greater the indicator delay. Uptrends are shown by blue color of the indicato
K Channel
Pavel Gotkevitch
K_Channel is a technical indicator defining the current Forex market status - trend or flat. The indicator works on any timeframe. H1 and higher timeframes are recommended though to minimize false signals. The indicator is displayed as lines above and below EMA. Average True Range (ATR) is used as bands' width. Therefore, the channel is based on volatility. This version allows you to change all the parameters of the main Moving Average. Unlike Bollinger Bands that applies the standard deviation
D Channel
Pavel Gotkevitch
D-Channel is a technical indicator defining the current Forex market status - trend or flat. The indicator is based on DEMA (Double Exponential Moving Average). The advantage of DEMA is that it eliminates false signals at the saw-toothed price movement and allows saving a position at a strong trend. The indicator can work on any timeframe, though H1 and higher timeframes are recommended to minimize false signals. The indicator displays a channel as lines located above and below the average line.
Stips
Pavel Gotkevitch
Stips is a histogram indicator that determines trend direction and strength, as well as trend changes. The indicator can be used as a normal oscillator, i.e. analyze its trend change signals (crossing the zero line), as well as divergence and exit from overbought and oversold zones. The indicator uses extreme prices of previous periods and calculates the ratio between the current price and extreme values. Therefore its only parameter is Period (default is 13), which sets the number of bars to de
F Channel
Pavel Gotkevitch
F-Channel is a technical indicator defining the current Forex market status - trend or flat. The indicator is based on FRAMA (Fractal Adaptive Moving Average). The FRAMA follows strong trend movements and slows down significantly during price consolidation. The indicator is able to work on any timeframes, but H1 and higher timeframes are recommended to minimize false signals. The indicator displays a channel as lines located above and below the middle line. The upper and lower lines can serve as
P Channel
Pavel Gotkevitch
P-Channel is a technical indicator determining the current Forex market status - trend or flat. The indicator is able to work on any timeframes, but H1 and higher timeframes are recommended to minimize false signals. The indicator displays a channel as lines located above and below the middle line. The upper and lower lines can serve as the resistance and support levels. Sell when the price reaches the upper line, and buy when the price reaches the lower line. It is recommended to use a small st
FRAMA Crossing
Pavel Gotkevitch
The FRAMA Crossing indicator displays on a chart two FRAMAs (Fractal Adaptive Moving Average) and paints their crossing areas in different colors – blue (buy) and red (sell). FRAMA follows strong trend movements and slows down significantly during price consolidation. The indicator clearly defines the trend direction and power and simplifies the perception of market signals. The indicator can work on any timeframes may be useful in the strategies involving two moving averages' crossing method. T
CCI Crossing
Pavel Gotkevitch
The CCI Crossing indicator displays the intersection of two CCI (Commodity Channel Index) indicators - fast and slow - in a separate window. The intersection area is filled in blue, when the fast CCI is above the slow CCI. The intersection area is filled in red, when the fast CCI is below the slow CCI. This indicator is a convenient tool for measuring the deviations of the current price from the statistically average price and identifying overbought and oversold levels. The indicator can work on
Dash
Pavel Gotkevitch
Dash is a histogram indicator, which measures the rate of price change and determines the overbought and oversold levels. The indicator uses price extremums for the previous periods and calculates the ratio between the current price and extremums. Therefore, the only parameter is Period , which sets the number of bars to determine extremums. A long position can be opened when the red lines of the indicator start leaving the oversold area and break the -1 level upwards. A short position can be op
Surge
Pavel Gotkevitch
The Surge indicator combines the features of trend indicators and oscillators. The indicator measures the rate of price change and determines the overbought and oversold market levels. The indicator can be used on all timeframes and is a convenient tool for detecting short-term market cycles. The indicator uses price extremums for the previous periods and calculates the ratio between the current price and extremums. Therefore, the only parameter is Period, which sets the number of bars to determ
DEMA Crossing
Pavel Gotkevitch
The DEMA Crossing indicator displays the intersection of two DEMA (Double Exponential Moving Average) - fast and slow. The intersection area is filled in blue, when the fast DEMA is above the slow DEMA. The intersection area is filled in red, when the fast DEMA is below the slow DEMA. The advantage of the DEMA moving average is that it eliminates false signals at the saw-toothed price movement and allows saving a position at a strong trend. The indicator clearly defines the trend direction and p
Trend Sight
Pavel Gotkevitch
The Trend Sight indicator shows the Moving Average's percent change from the current bar to the other selected bar allowing you to track the smoothed price change rate, as well as trend strength and change. The uptrend is shown as a blue indicator line, while a downtrend is displayed in red. Close a short position and open a long one if the line color changes from red to blue. Close a long position and open a short one if the line color changes from blue to red. You should use a tight stop loss,
Trend Sign
Pavel Gotkevitch
The Trend Sign indicator is a modification of the MACD indicator (Moving Average Convergence Divergence), which allows determining the direction and strength of the trend, as well as a trend change. The indicator is based on two moving averages - fast and slow, and it can work on any timeframe. Uptrends are shown by blue color of the indicator line, downtrends by the red color. Close a short position and open a long one if the line color changes from red to blue. Close a long position and open a
DEMA Trend
Pavel Gotkevitch
The DEMA Trend indicator is based on two DEMA (Double Exponential Moving Average) - fast and slow. The advantage of the DEMA moving average is that it eliminates false signals at the saw-toothed price movement and allows saving a position at a strong trend. The indicator allows determining the direction and strength of the trend, and it can work on any timeframe. Uptrends are shown by blue color of the indicator line, downtrends by the red color. Close a short position and open a long one if the
T Channel
Pavel Gotkevitch
T-Channel is a technical indicator defining the current Forex market status - trend or flat. The indicator is based on TEMA (Triple Exponential Moving Average). The advantage of the TEMA is that it provides a smaller delay than a moving average with a single or double smoothing. The indicator is able to work on any timeframes, but H1 and higher timeframes are recommended to minimize false signals. The indicator displays a channel as lines located above and below the middle line. The upper and lo
TEMA Trend
Pavel Gotkevitch
The TEMA Trend indicator is based on two TEMA (Triple Exponential Moving Average) - fast and slow. The advantage of the TEMA is that it provides a smaller delay than a moving average with a single or double smoothing. The indicator allows determining the direction and strength of the trend, and it can work on any timeframe. Uptrends are shown by blue color of the indicator line, downtrends by the red color. Close a short position and open a long one if the line color changes from red to blue. Cl
TrendDetect
Pavel Gotkevitch
The Trend Detect indicator combines the features of both trend indicators and oscillators. This indicator is a convenient tool for detecting short-term market cycles and identifying overbought and oversold levels. A long position can be opened when the indicator starts leaving the oversold area and breaks the zero level from below. A short position can be opened when the indicator starts leaving the overbought area and breaks the zero level from above. An opposite signal of the indicator can
Trade Helper
Pavel Gotkevitch
The Trade Helper indicator is a modification of the Trade Assistant indicator (by Andriy Moraru). The Trade Helper multitimeframe indicator is a good assistant for traders, useful as a filter in most trading strategies. This indicator combines the tactics of Elder's Triple Screen in a single chart, which lies in entering a trade when the same trend is present on three adjacent timeframes. The indicator operation is based on the principle of determining the trend on the three selected timeframes
Lotus
Pavel Gotkevitch
Lotus indicator combines the features of both trend indicators and oscillators allowing you to track the smoothed price change rate, as well as trend strength and change. The uptrend is shown as a green indicator line, while a downtrend is displayed in red. A long position can be opened when the indicator breaks the zero level from below. A short position can be opened when the indicator breaks the zero level from above. An opposite signal of the indicator can be used for exiting positions. You
DEMA Cross
Pavel Gotkevitch
DEMA Cross DEMA Cross - это мультивалютный трендовый советник, работающий на реальных счетах любого типа, на любом временном интервале, с любым начальным депозитом, с постоянным или изменяющимся размером лота, с четырех- и с пятизначными котировками, а также с брокерами, использующими различный тип заливки ордеров. Отличительной особенностью советника является его стабильность и, что особенно важно, его достоверность. Результаты проверки советника в тестере стратегий в 4-х режимах (2 основ
Filtro:
[Excluído] 2019.01.14 06:46 
 

O usuário não deixou nenhum comentário para sua avaliação

sunnychow
8753
sunnychow 2019.01.12 16:54 
 

O usuário não deixou nenhum comentário para sua avaliação

Gennadiy Voltornist
11909
Gennadiy Voltornist 2017.12.03 17:49 
 

O usuário não deixou nenhum comentário para sua avaliação

Daniel Andrejczuk
5596
Daniel Andrejczuk 2017.11.09 03:08 
 

O usuário não deixou nenhum comentário para sua avaliação

Nork
6194
Nork 2017.06.28 04:32 
 

O usuário não deixou nenhum comentário para sua avaliação

Responder ao comentário
Versão 1.2 2022.03.24
The indicator is optimized for new versions of MT5.
Versão 1.1 2020.03.26
Improved stability and speed of the indicator.