Gann Square of 144 for MT5
- Indicadores
- Taras Slobodyanik
- Versão: 3.0
- Atualizado: 16 fevereiro 2021
- Ativações: 10
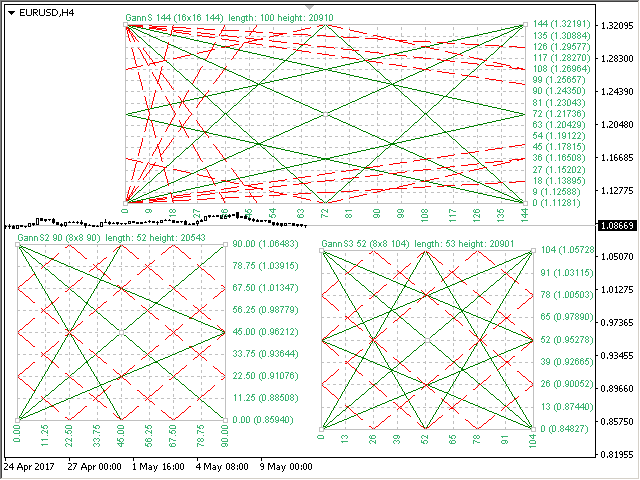
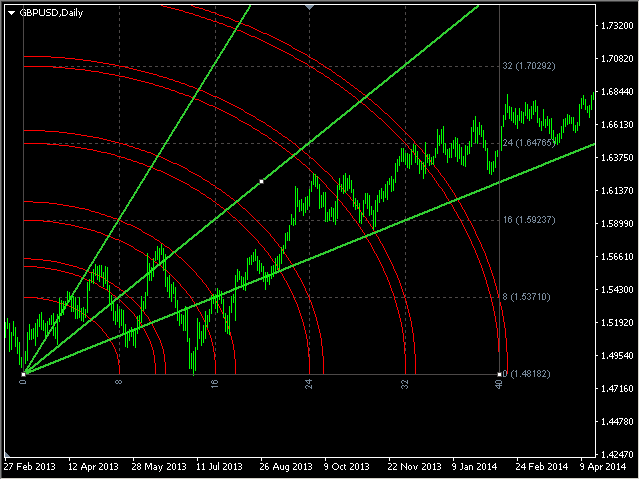
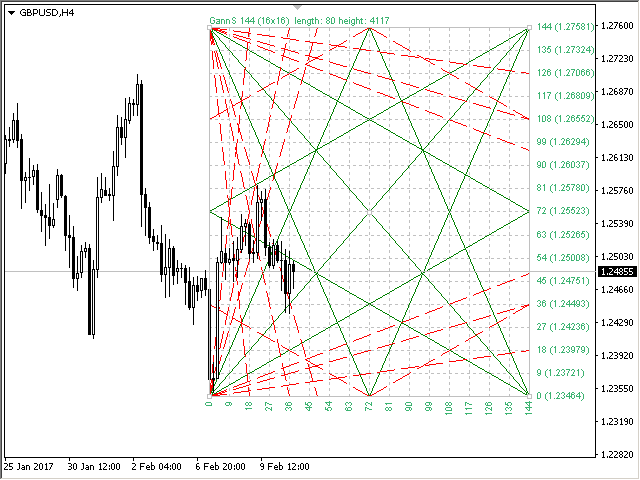
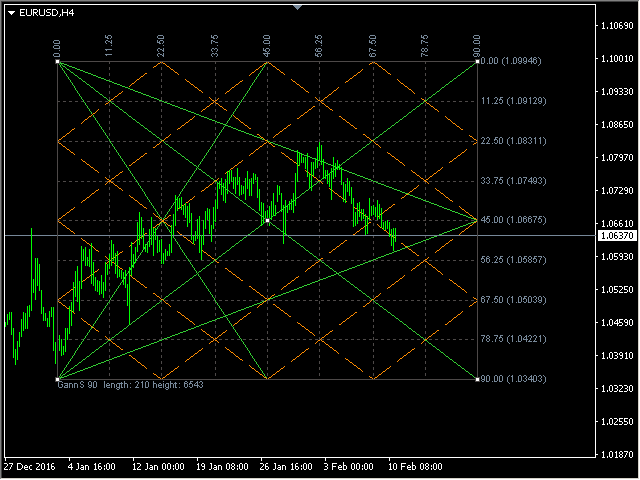
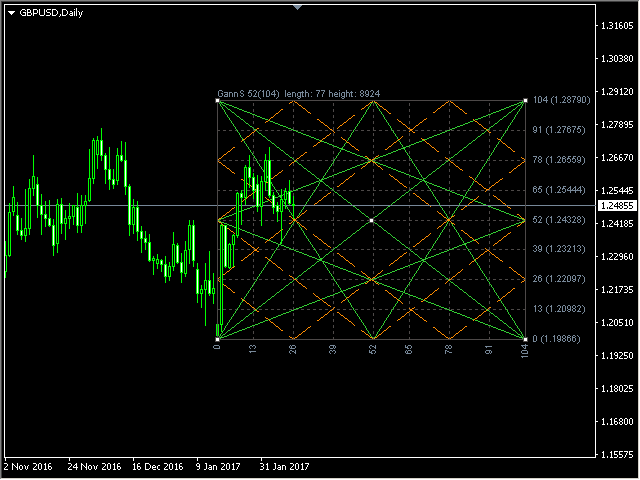
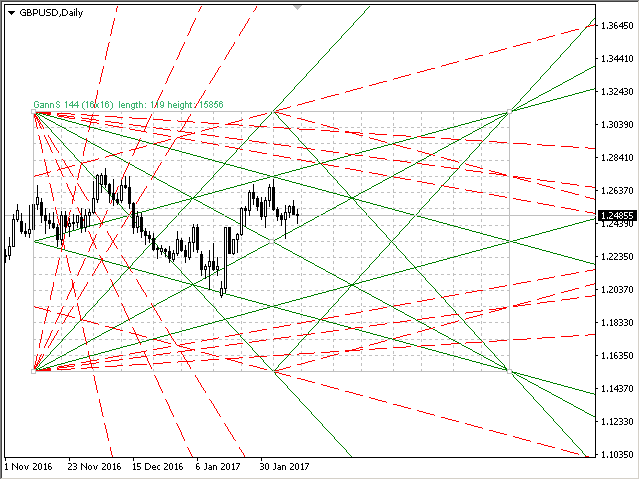
A Gann Box (ou Gann Square) é um método de análise de mercado baseado no artigo "Fórmula matemática para previsões de mercado" de WD Gann. Este indicador pode representar três modelos de Quadrados: 90, 52(104), 144. Existem seis variantes de grades e duas variantes de arcos. Você pode plotar vários quadrados em um gráfico simultaneamente.
Parâmetros
Square — seleção de um modelo quadrado:
- 90 — quadrado de 90 (ou quadrado de nove);
- 52 (104) — quadrado de 52 (ou 104);
- 144 — quadrado universal de 144;
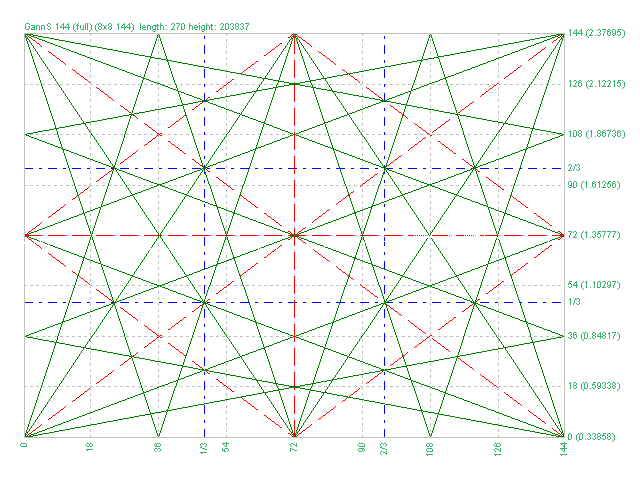
- 144 (full) — versão “completa” do quadrado, linhas combinadas de outros quadrados. Pelo que se sabe, WD Gann não tinha tal marcação;
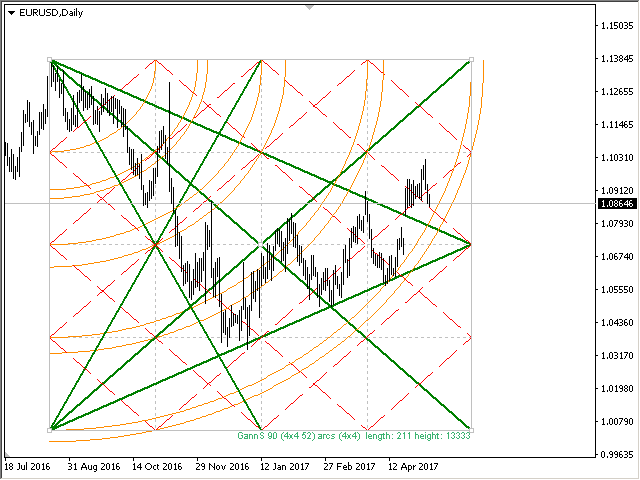
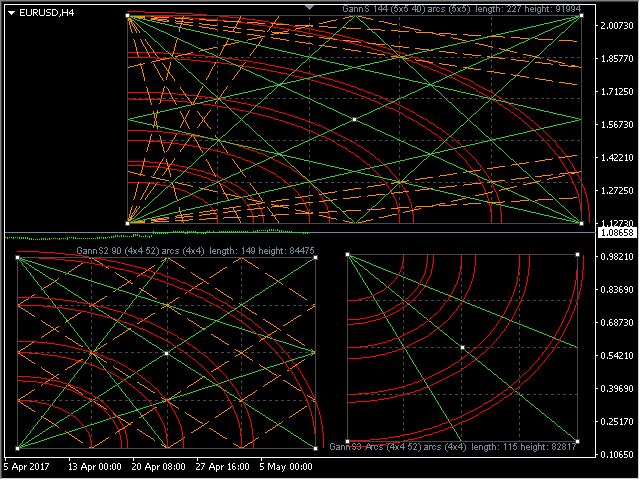
- for Arcs — quadrado simplificado para arcos;
Grid — variantes de grades:
- 4x4 (52) — grade 4 por 4, marcação 52;
- 5x5 (40);
- 8x8 (90);
- 8x8 (104);
- 8x8 (144);
- 16x16 (144);
- 36x36 (144);
- disable — desabilita a grade;
Arcs — variantes de arcos:
- 4x4;
- 5x5;
- disable — desabilita os arcos;
Parâmetros quadrados no início:
Length of Square, Bars (X-axis) — comprimento do quadrado em barras;
Height of Square, Points (Y-axis) — altura do quadrado em pontos;
Build at the start — construa o quadrado no início:
— in the center of the chart — no centro do gráfico;— at the specified time — na hora especificada;— to use the previous — usar o quadrado anterior (se presente no gráfico);
Freeze the size of the box — corrija a escala da caixa;
Leave the square on the chart — deixe o quadrado no gráfico ao remover o indicador;
Display the rays to the right — exiba os raios à direita;
Display the scale numbers — exibe os números da escala;
Display the name of the Square — exibe o nome do quadrado;
Direction of Square — direção para construir o quadrado, para cima ou para baixo;
Time of the bar to start building the Square — hora da barra para começar a traçar a caixa;
Upper price for build the Square (if the Height is zero) — preço superior da caixa, se o parâmetro “Altura do Quadrado” for zero, então o quadrado é plotado para esses preços;
Lower price for build the Square (if the Height is zero) — menor preço da caixa, se o parâmetro “Altura do Quadrado” for zero, então o quadrado é plotado para esses preços;
Prefix (change for several boxes) — prefixo dos objetos caixa, deve ser alterado caso sejam utilizados múltiplos quadrados simultaneamente;
Cores
Color 1 on a white background — a cor da linha 1 sobre fundo branco;
Color 1 on a black background — a cor da linha 1 sobre fundo preto;
Width 1 — largura da linha 1;
Style 1 — estilo de linha 1;
Color 2 on a white background — a cor da linha 2 sobre fundo branco;
Color 2 on a black background — a cor da linha 2 em fundo preto;
Width 2 — largura da linha 2;
Style 2 — estilo de linha 2;
Arcos
Color on a white background — Cor sobre fundo branco;
Color on a black background — Cor sobre fundo preto;
Width — a largura da linha do arco;
Grade
Grid color on a white background — Cor da grade sobre fundo branco;
Grid color on a black background — Cor da grade sobre fundo preto;
Width lines — a largura das linhas da grade;
Style lines — o estilo das linhas de grade;
Linhas 1/3
Display the Grid of one-third — mostre a grade 1/3;
Font size — Tamanho da fonte;
Text color on a white background — Cor do texto em fundo branco;
Text color on a black background — Cor do texto em fundo preto;
Controle de chave
Enable WASD keys — ative o controle com as teclas ‘WASD’. 'W' está para cima, 'A' está para a esquerda, 'S' está para baixo e 'D' está à direita;
Horizontal shift (bars) — deslocamento horizontal do Quadrado (barras);
Vertical shift (points) — deslocamento vertical do Quadrado (pontos);
All timeframes — exibe um quadrado em todos os prazos do gráfico;
M1-MN1 — exibe um quadrado no período correspondente M1-MN1.


its nice