Binnacle Trend Line
- Indicadores
- Versão: 1.0
- Ativações: 5

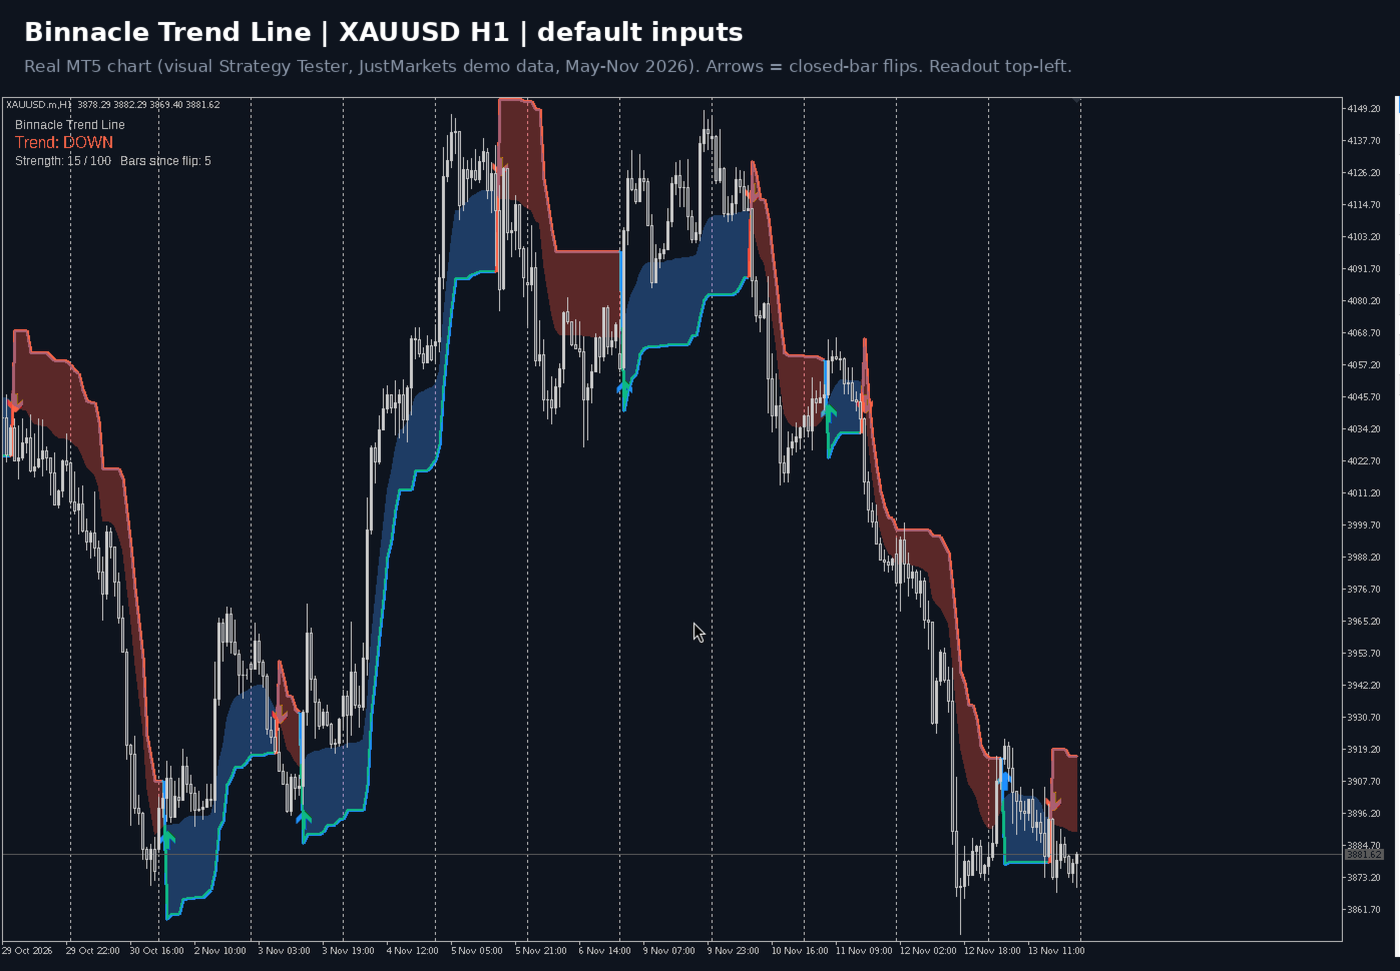
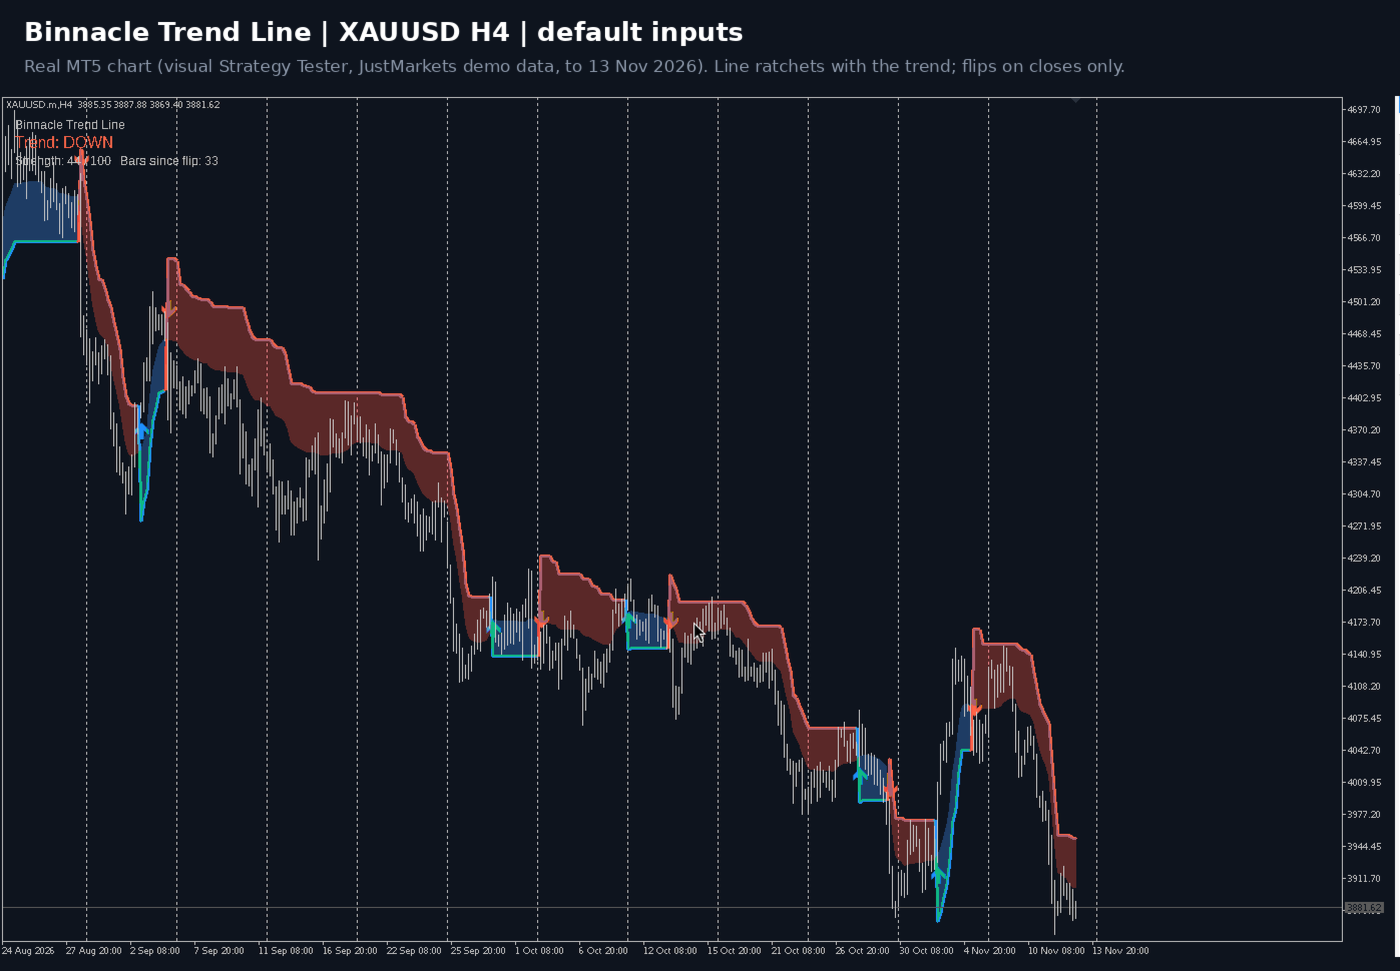
Binnacle Trend Line is an original trend-direction indicator for MetaTrader 5. It draws one adaptive line that is blue in an uptrend and red in a downtrend. An arrow appears when the trend flips, and a small readout shows the current direction and trend strength.
Non-repainting. Flips, arrows, alerts and buffer values are calculated on closed bars only. Once a bar has closed, its values never change. The forming bar copies the last closed bar's line and direction, and it never gets an arrow. This was checked in the Strategy Tester (results below).
No DLLs, no web requests, no hidden behaviour. It does not trade.
How it works
- Efficiency. Over the last N bars the indicator measures how straight the price path was: the net move divided by the total bar-to-bar movement. The result is close to 1 in a clean trend and close to 0 in a choppy market.
- Centre line. This is a moving average whose speed follows efficiency. It moves quickly in clean trends and slowly in noisy markets.
- Volatility band. The line sits a distance from the centre equal to ATR times a multiplier. The multiplier goes from 1.0 in a clean trend up to 2.0 in a noisy market, so the line stays close in strong trends and gives room in choppy ones.
- Ratchet and flip. In an uptrend the line can only rise or stay flat; in a downtrend it can only fall or stay flat. The trend flips when a bar closes beyond the line. The line then restarts on the other side of the centre.
- Strength (0-100). This is half efficiency and half the slope of the centre line over 3 bars, measured in ATR.
Features
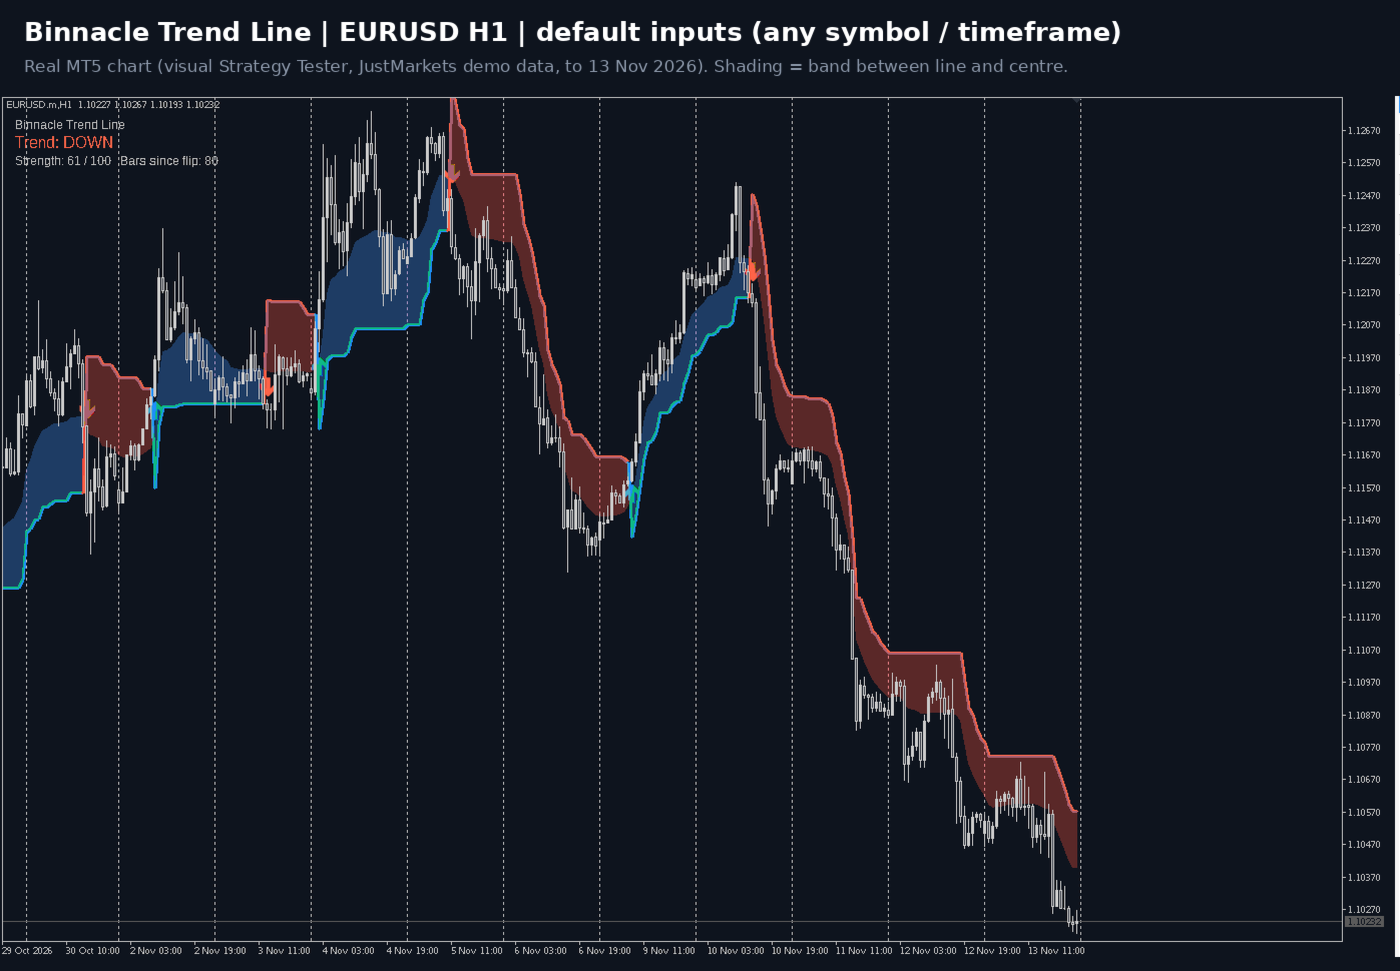
- A two-colour trend line, with optional shading between the line and the centre.
- Up and down arrows on confirmed flips.
- A readout showing direction, strength and the number of bars since the last flip.
- Pop-up, sound, push and e-mail alerts. Each fires once, when a flip bar closes, and never for past bars.
- Works on any symbol and timeframe. The defaults were chosen for XAUUSD H1.
- Calculates efficiently: only newly closed bars are recalculated.
Inputs (defaults)
| InpAtrPeriod | 14 (ATR period) |
| InpErPeriod | 10 (efficiency period, bars) |
| InpFastPeriod / InpSlowPeriod | 2 / 30 (fastest and slowest speed of the centre line) |
| InpBandMin / InpBandMax | 1.0 / 2.0 (band width in ATR for a clean and a noisy market) |
| InpShowFill / InpShowArrows | true / true |
| InpArrowGapATR | 0.3 (arrow distance from the bar, in ATR) |
| InpShowPanel / InpPanelCorner / InpPanelColor | true / left upper / silver |
| InpAlertPopup / InpAlertSound / InpSoundFile | false / false / alert.wav |
| InpAlertPush / InpAlertEmail | false / false (set up in the terminal options first) |
Buffers for EA developers (iCustom)
Call iCustom(_Symbol, _Period, "Market\\Binnacle Trend Line") to use the defaults. Read shift 1, the last closed bar. Shift 0 only mirrors shift 1.
| 0 | Line value (price) |
| 1 | Line colour index (0 = up, 1 = down) |
| 2 | Up-flip arrow price (EMPTY_VALUE if no flip on that bar) |
| 3 | Down-flip arrow price (EMPTY_VALUE if no flip on that bar) |
| 4 | Direction: +1 up, -1 down (0 during warm-up) |
| 5 | Strength 0-100 |
| 6 / 7 | Fill helpers (line / centre) |
| 8 | Centre line value |
| 9 | ATR |
| 10 | Efficiency ratio 0-1 |
A flip happened on bar k when buffer 2 or buffer 3 at shift k is not EMPTY_VALUE. Equivalently, buffer 4 at k differs from buffer 4 at k+1.
Non-repainting check
In the Strategy Tester (real ticks, JustMarkets demo data), a test harness recorded every buffer of each bar right after the bar closed. At the end of the run it compared them with (a) the same indicator instance and (b) a fresh instance that recalculated the whole history. Results: XAUUSD H1 0 of 5,886 bars differed, XAUUSD H4 0 of 1,539, EURUSD H1 0 of 6,191, in both comparisons.
Note: like any recursive average, the line needs a few hundred bars of history to settle. Charts that start at very different points in history can show different flips in their first bars.
Evaluation (honest): indicator statistics, not a trading system
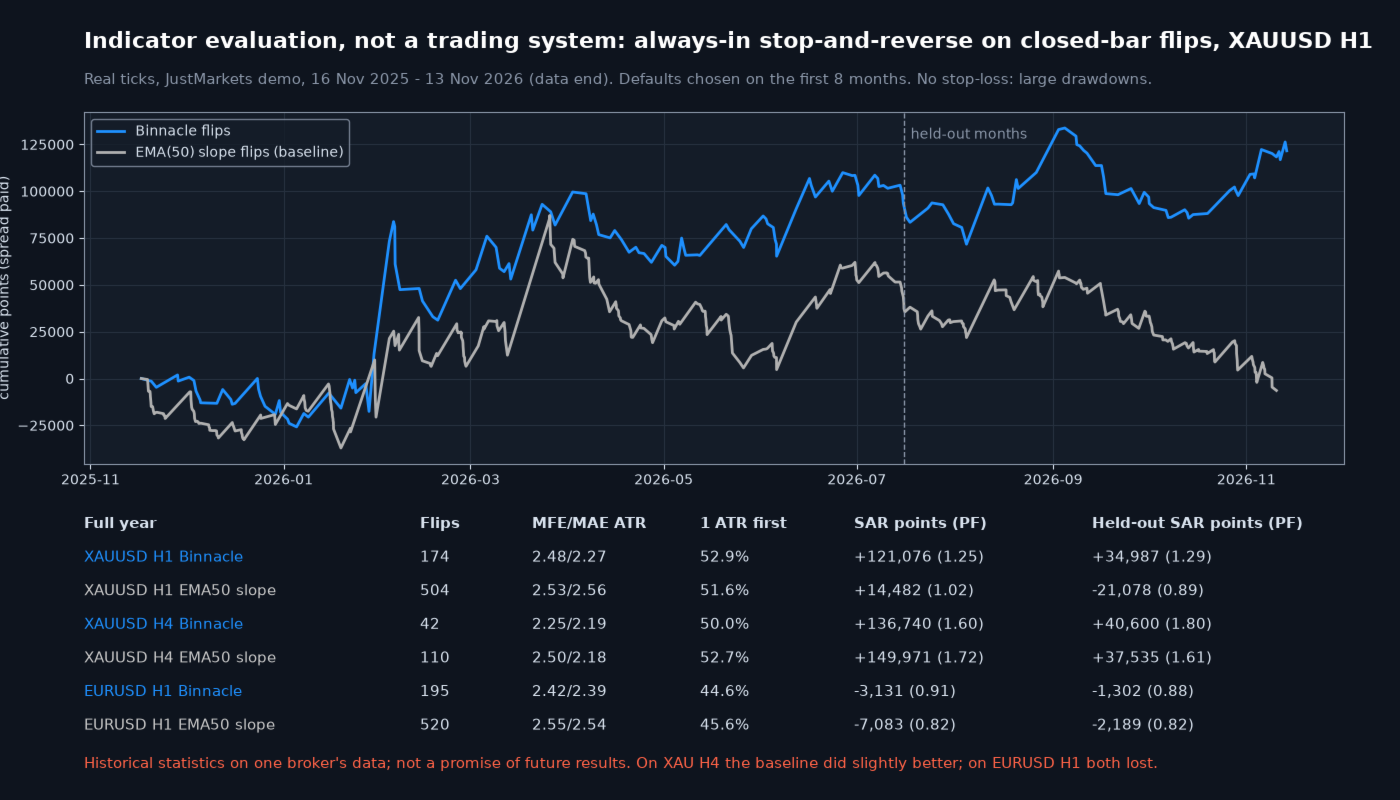
Data: 16 November 2025 to 16 November 2026. Broker data ends on 13 November 2026. Real ticks, default inputs, with the tester's buffer output analysed offline. The defaults were chosen on the first eight months only, and the last four months (from 16 July 2026) were held out. The baseline is the direction of the EMA(50) slope, taken from closed bars.
Definitions:
- MFE / MAE: the average favourable and adverse excursion, in ATR, in the 20 bars after a flip, measured from the flip bar's close.
- Hit rate: the share of flips where price moved 1 ATR in the signal direction before it moved 1 ATR against. If both happen in the same bar, the flip counts as a miss.
- Stop-and-reverse: always in the market and reversing at the next bar's open after each closed-bar flip, with the recorded average spread paid on every entry. This is a measuring tool, not a strategy: it has no stop-loss and its drawdowns are large.
| Market, period | Flips | MFE / MAE (ATR) | Hit rate | Stop-and-reverse, points (PF) |
| XAUUSD H1, full year: Binnacle | 174 | 2.48 / 2.27 | 52.9% | +121,076 (1.25) |
| XAUUSD H1, full year: EMA(50) slope | 504 | 2.53 / 2.56 | 51.6% | +14,482 (1.02) |
| XAUUSD H1, held-out 4 months: Binnacle | 59 | 2.57 / 2.18 | 52.5% | +34,987 (1.29) |
| XAUUSD H1, held-out 4 months: EMA(50) slope | 181 | 2.64 / 2.68 | 51.9% | -21,078 (0.89) |
| XAUUSD H4, full year: Binnacle | 42 | 2.25 / 2.19 | 50.0% | +136,740 (1.60) |
| XAUUSD H4, full year: EMA(50) slope | 110 | 2.50 / 2.18 | 52.7% | +149,971 (1.72) |
| EURUSD H1, full year: Binnacle | 195 | 2.42 / 2.39 | 44.6% | -3,131 (0.91) |
| EURUSD H1, full year: EMA(50) slope | 520 | 2.55 / 2.54 | 45.6% | -7,083 (0.82) |
What this shows:
- On gold H1, Binnacle flipped about one third as often as the EMA slope and did better, including in the held-out months.
- On gold H4, the plain EMA slope did slightly better over this year.
- On EURUSD H1, both lost after spread. The indicator did not find a tradable trend edge there with the default settings.
- The hit rates are close to 50%. Most of the value comes from flips that are followed by long trends, not from accuracy.
Points are the symbol's points (0.01 for XAUUSD.m, 0.00001 for EURUSD.m). The maximum stop-and-reverse drawdown on gold H1 was 52,621 points.
Disclaimer
These are historical statistics from one broker's data over one year. They do not promise future results. A trend indicator shows direction; it does not make trading profitable on its own. Use your own risk management.