Supertrend with Targets
- Indicadores
- Versão: 1.20
- Atualizado: 16 novembro 2026
- Ativações: 5

Supertrend Targets — Description & Trading Tips
What it is
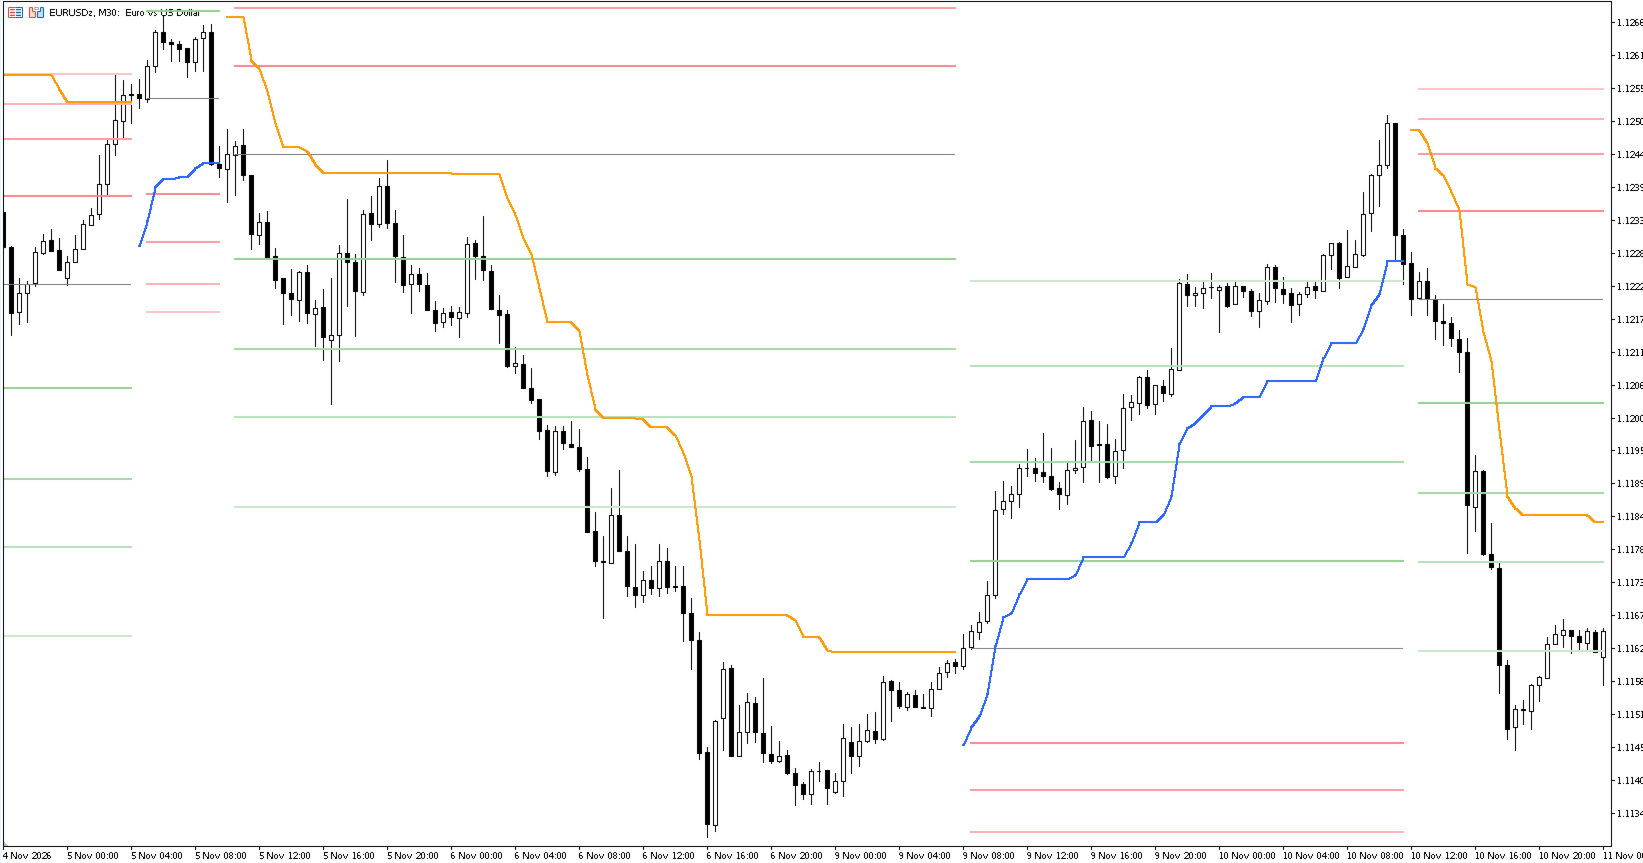
Supertrend Targets is a classic Supertrend that does more than show trend direction: right after every trend flip it draws statistical Take Profit and Stop Loss levels.
How it works:
- The indicator detects a trend change (Supertrend, calculated on closed bars).
- From all completed trends on the chart it measures:
- Gain (MFE) — how far price moved in your favour from the entry point;
- Drawdown (MAE) — how far price moved against you.
- Percentiles of these values are projected from the entry price as horizontal lines.
Bullish and bearish trends are measured separately. Signals are generated on closed bars only, so the indicator does not repaint.
Reading the chart
| Element | Meaning |
|---|---|
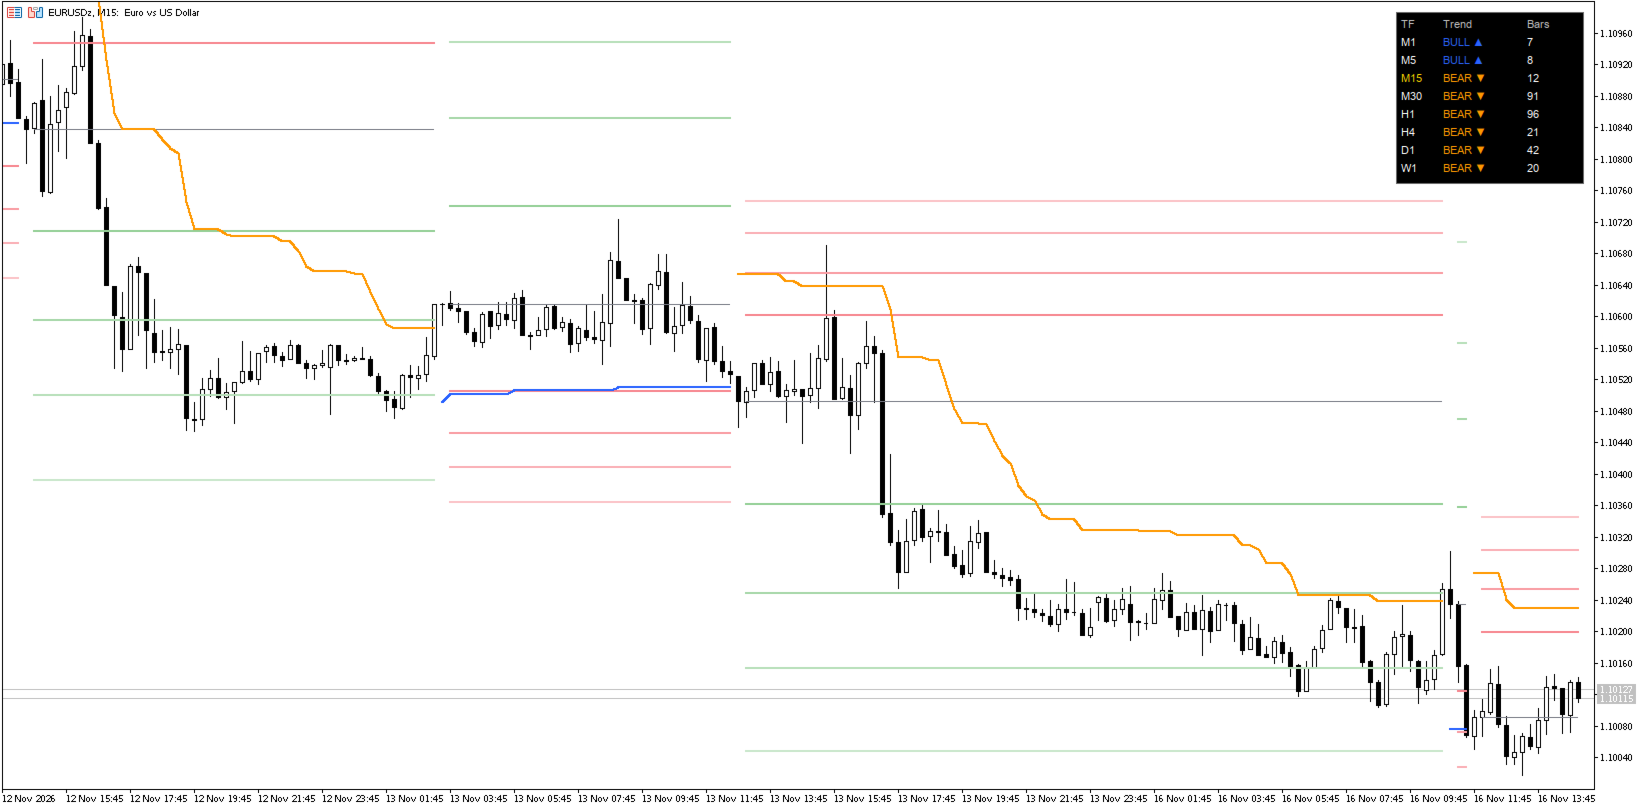
| Grey line | Entry price (close of the signal bar) |
| Green lines | Profit targets (Take Profit) |
| Red lines | Drawdown levels (potential Stop Loss) |
| Blue / orange line | Supertrend trailing stop (bullish / bearish) |
| Thick purple / blue line | Custom level (average or percentile), if enabled |
| Logo in the corner | Name, symbol, timeframe and current trend direction |
What percentile N means:
- Green level N — in roughly (100−N)% of past trends, price reached this target. The higher N, the farther the target and the less often it was reached.
- Red level N — in roughly N% of past trends, the drawdown did not go beyond this level. The higher N, the wider the stop and the less often it was hit.
With the defaults (Scale 80%, Levels −4) the indicator shows percentiles 40 / 60 / 72 / 80.
Key settings
- Source / Multiplier / ATR length — Supertrend settings. A higher multiplier gives fewer but more reliable signals.
- Levels — how many levels to show (positive: nearest first; negative: farthest first).
- Scale — percentile scale (80% keeps levels closer and more realistic).
- Window — how many recent trends to use (0 = all history). Try 30–100 to adapt to current market conditions.
- Custom level — average, average ± standard deviation, or your own percentile.
- Table — Take Profit / Stop Loss / Risk Ratio for each level.
- Logo — show or hide the logo and choose its corner.
- Alerts — popup, push or e-mail on a trend flip (on a closed bar).
Trading tips
This is a statistical tool, not a guarantee of profit. Past results do not predict future performance. This is not financial advice.
- Enter on the open of the bar after the signal. The signal is confirmed by the bar close and levels are calculated from that close. There is no need to enter inside the forming bar.
- Place the stop beyond a red level, not by feel. The nearest red level (~40) gives a tight stop that is hit more often; levels 72–80 are wider and are hit less often. Choose the balance and size the position to the stop distance.
- Take profit in parts. For example, close part of the position at green level 40, part at 60, and trail the rest with the Supertrend stop. Far targets (90–100) are rarely reached — treat them as a bonus.
- Check the Risk Ratio in the table. If the nearest target-to-stop ratio is below 1, the setup needs a high win rate to pay off; skip such signals.
- Trade with the higher-timeframe trend. Signals on M15–H1 are more reliable when they agree with the H4–D1 trend. Against the higher trend, reduce size or skip.
- Avoid ranges. Supertrend whipsaws in sideways markets. If trend flips are frequent and trends are short, reduce risk or wait for a breakout (raising the Multiplier can help).
- Do not rely on thin history. With fewer than ~20–30 completed trends per side, percentiles are unstable. Load more history or use a higher timeframe.
- Account for spread, commissions and news. Levels are based on chart prices; on near targets the spread takes a noticeable share, and news can run through any stop.
- Limit risk. Risk a small fixed share of your account per trade (commonly 0.5–1%) and never widen the stop beyond the distance your position size was calculated for.
- Test before going live. Check your settings on history and on a demo account for your instrument and timeframe.