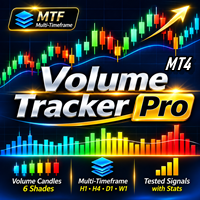
Volume Tracker Pro
- Indicadores
- Versão: 2.31
- Ativações: 20

Volume you can trust - backtested, on every candle
ICFX Volume Tracker turns tick volume into something you can trade: every candle is coloured by how unusual its volume is, and every signal comes with the percentage of times it actually worked in 23 years of history.
Most volume indicators show bars and leave the guessing to you. Volume Tracker only shows volume signals that passed a strict backtest (2003-2026, 6 major USD pairs, 6 USD exotics and Brent crude), tells you in plain language what each one means, and draws the tested stop and targets when a fresh signal appears.
It works on normal time charts, on higher timeframes (MTF) and on offline Point-O / Renko charts - including bigger-brick MTF, which very few volume tools offer.
Key features
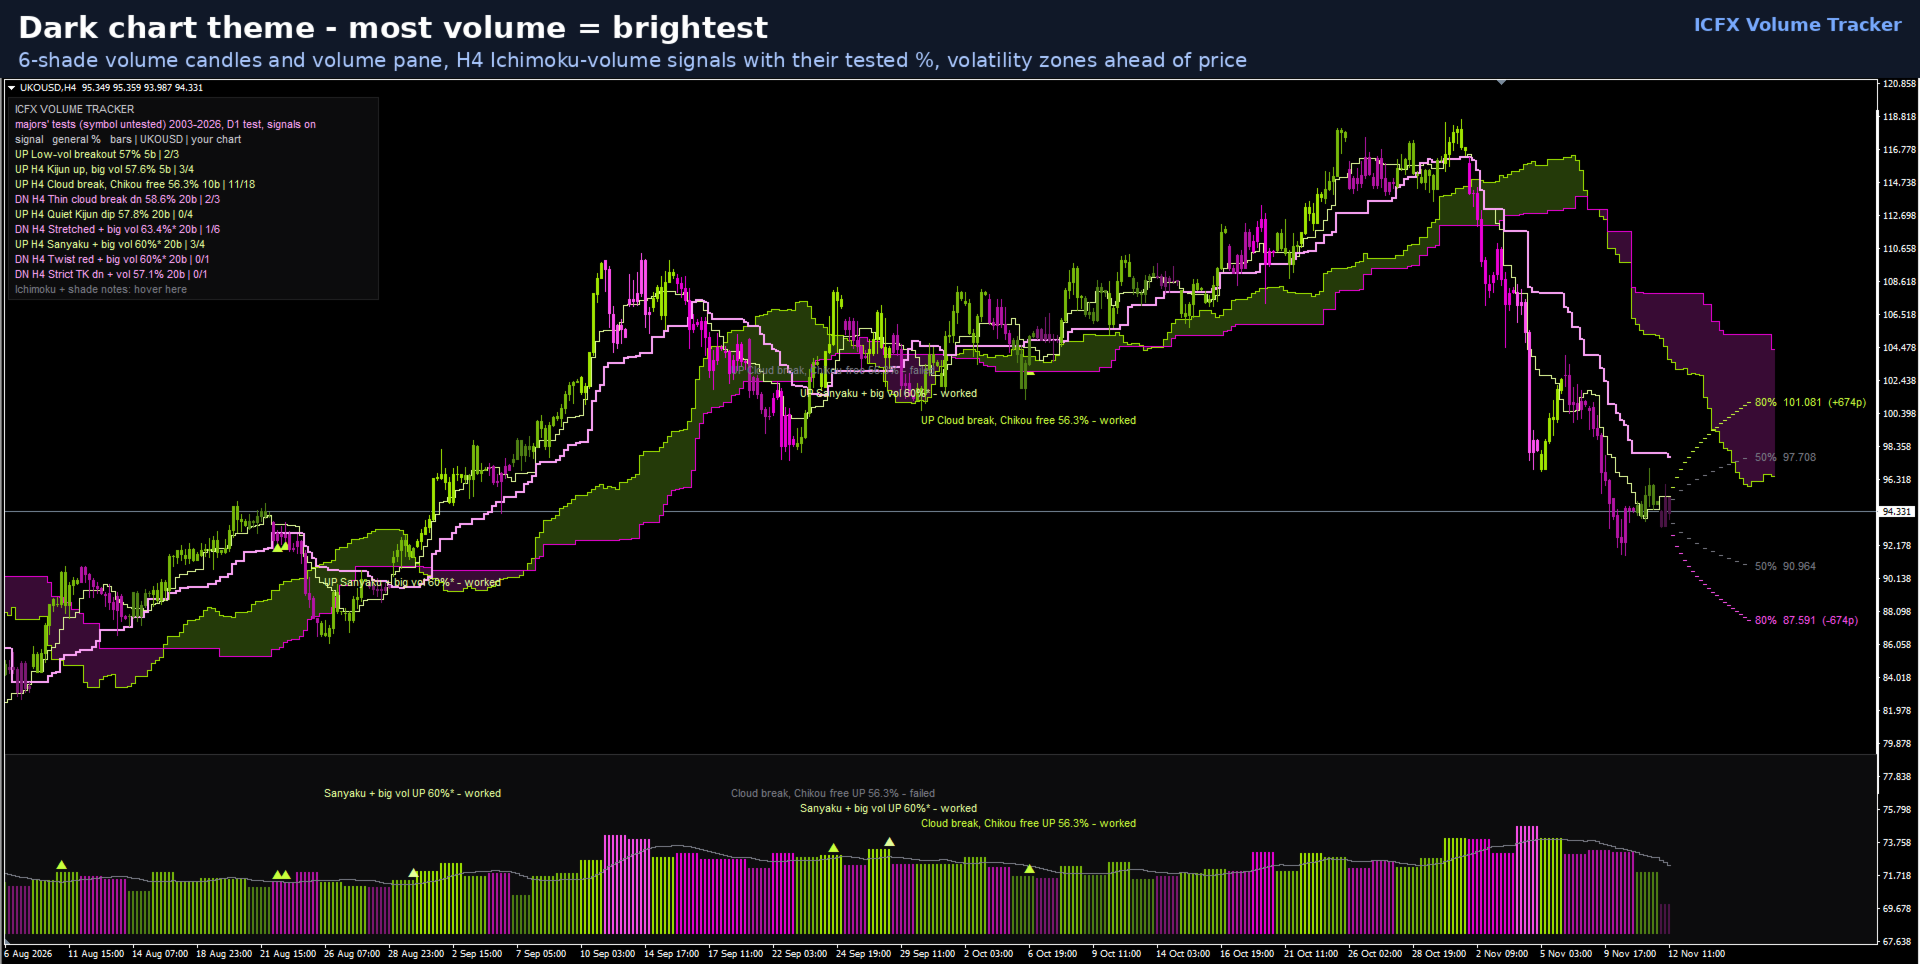
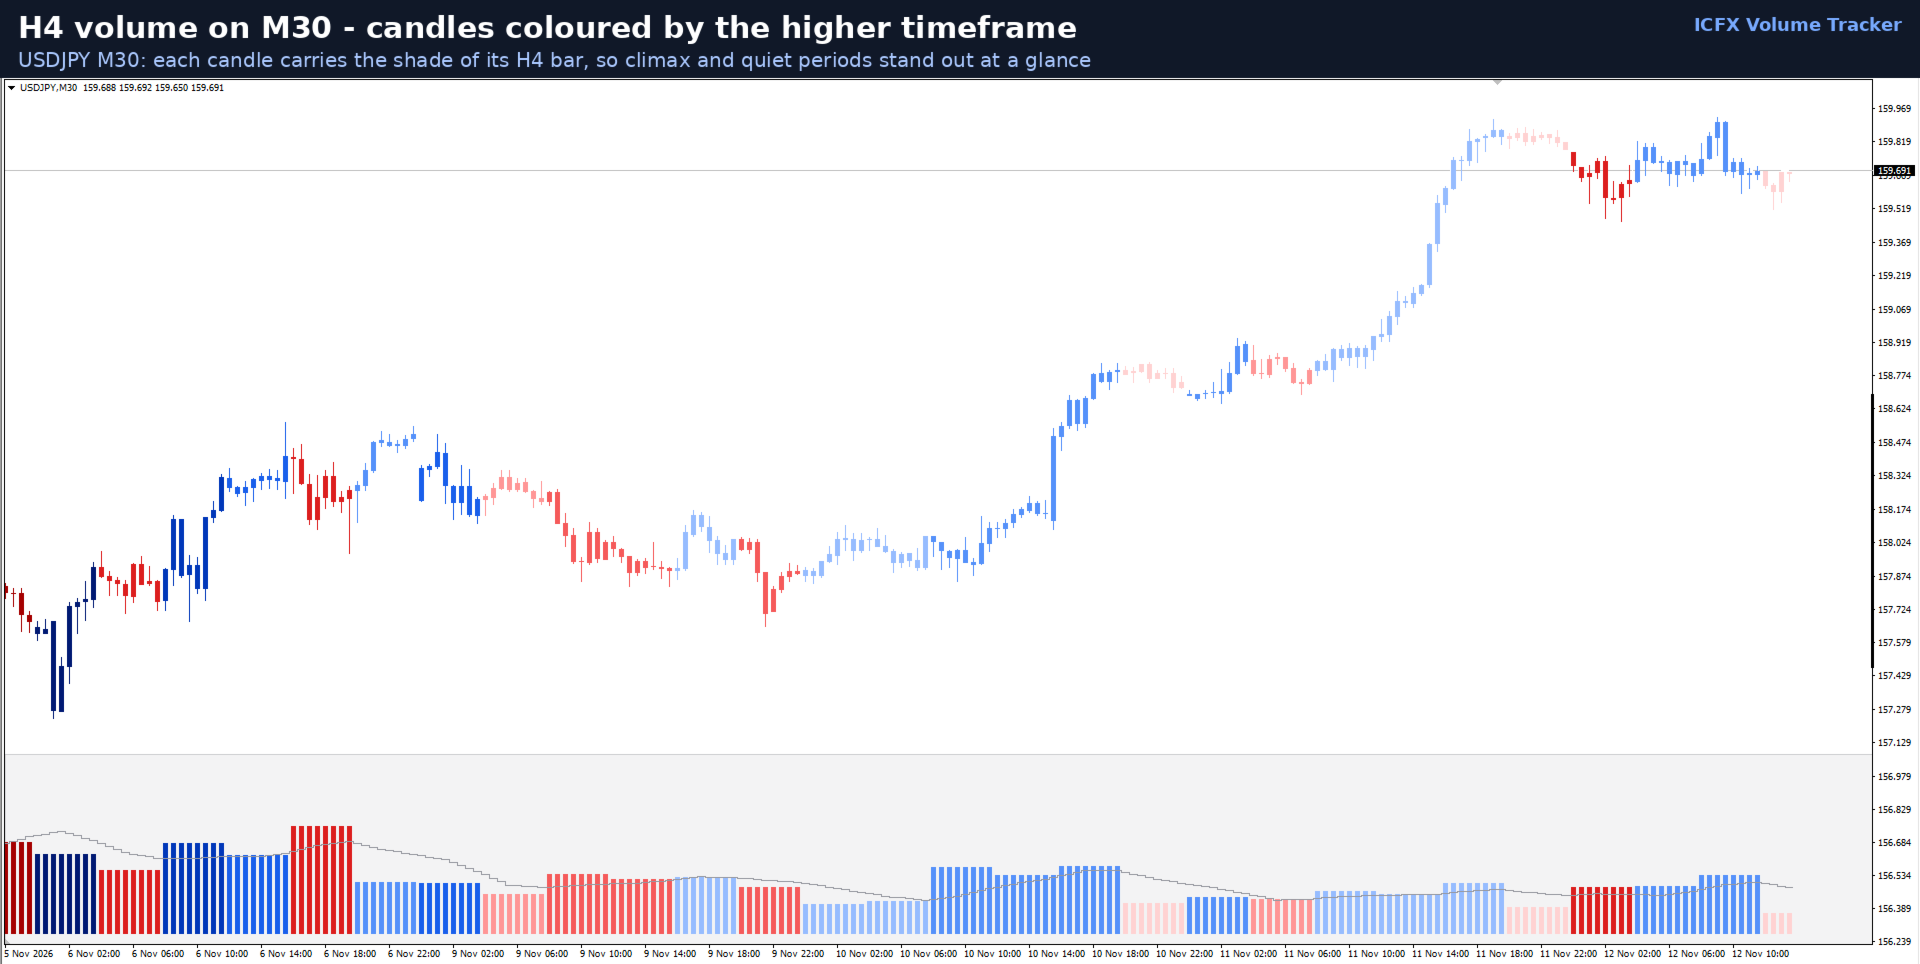
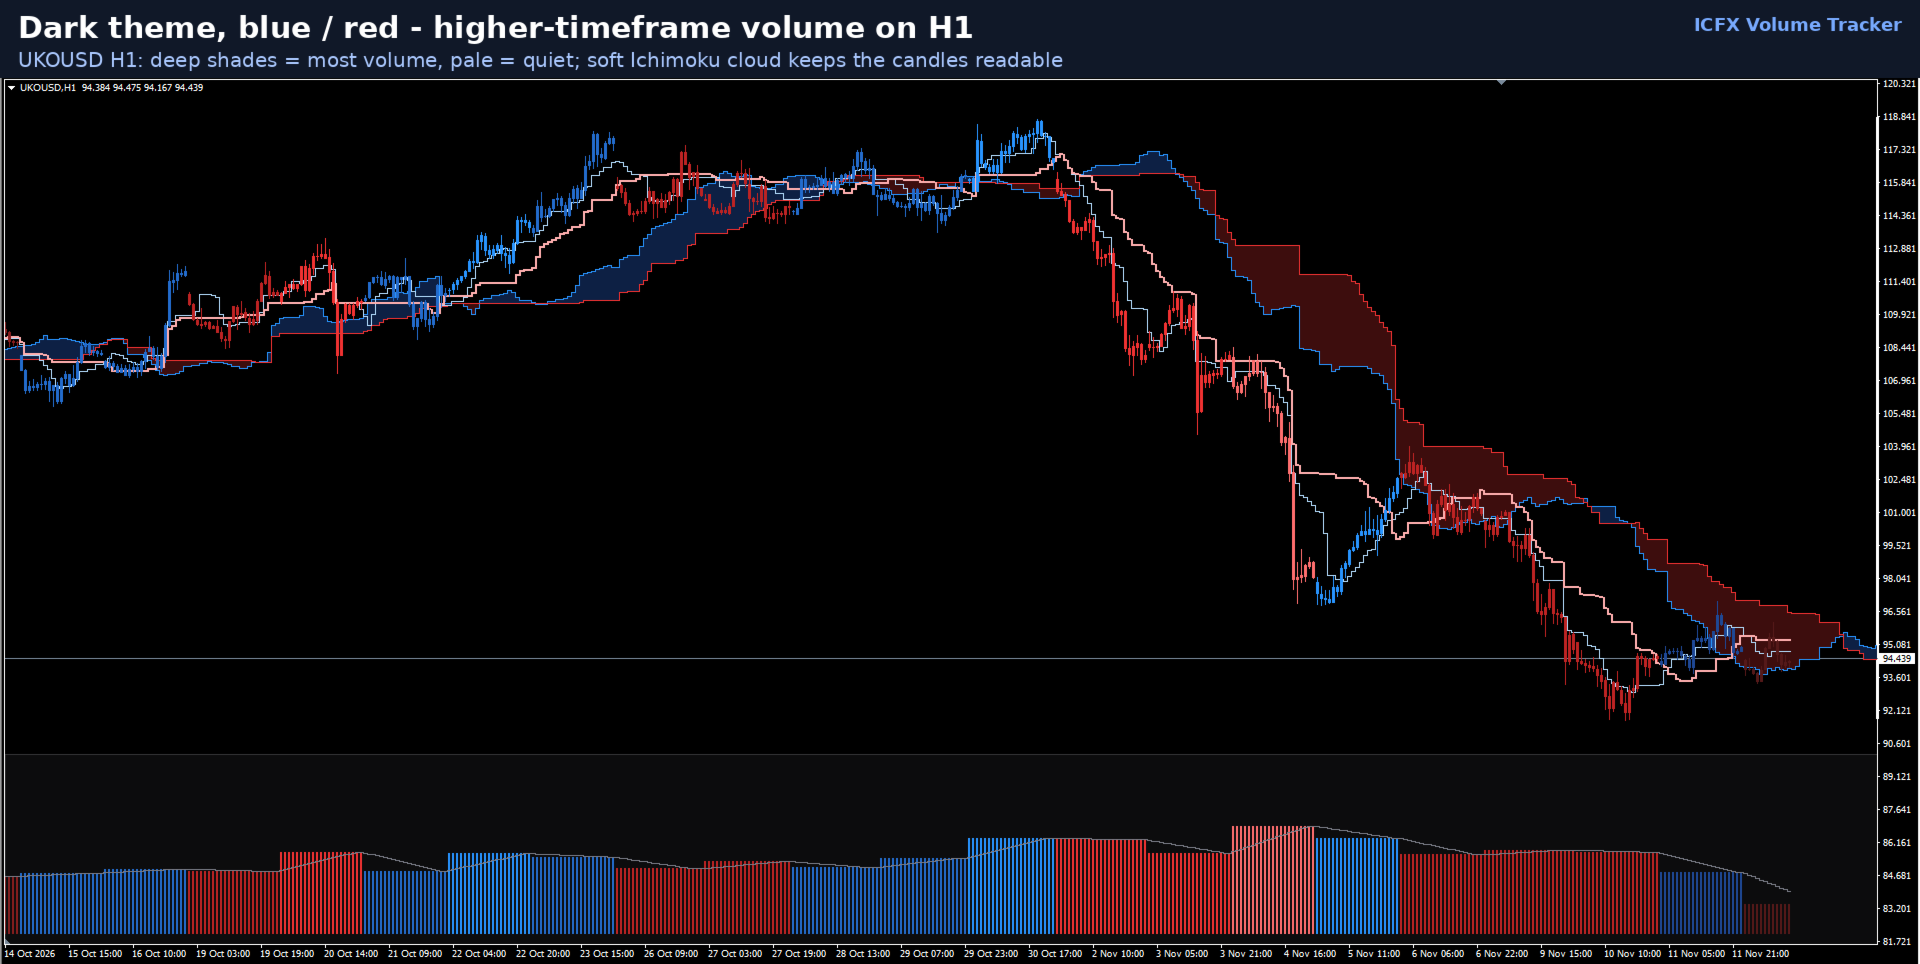
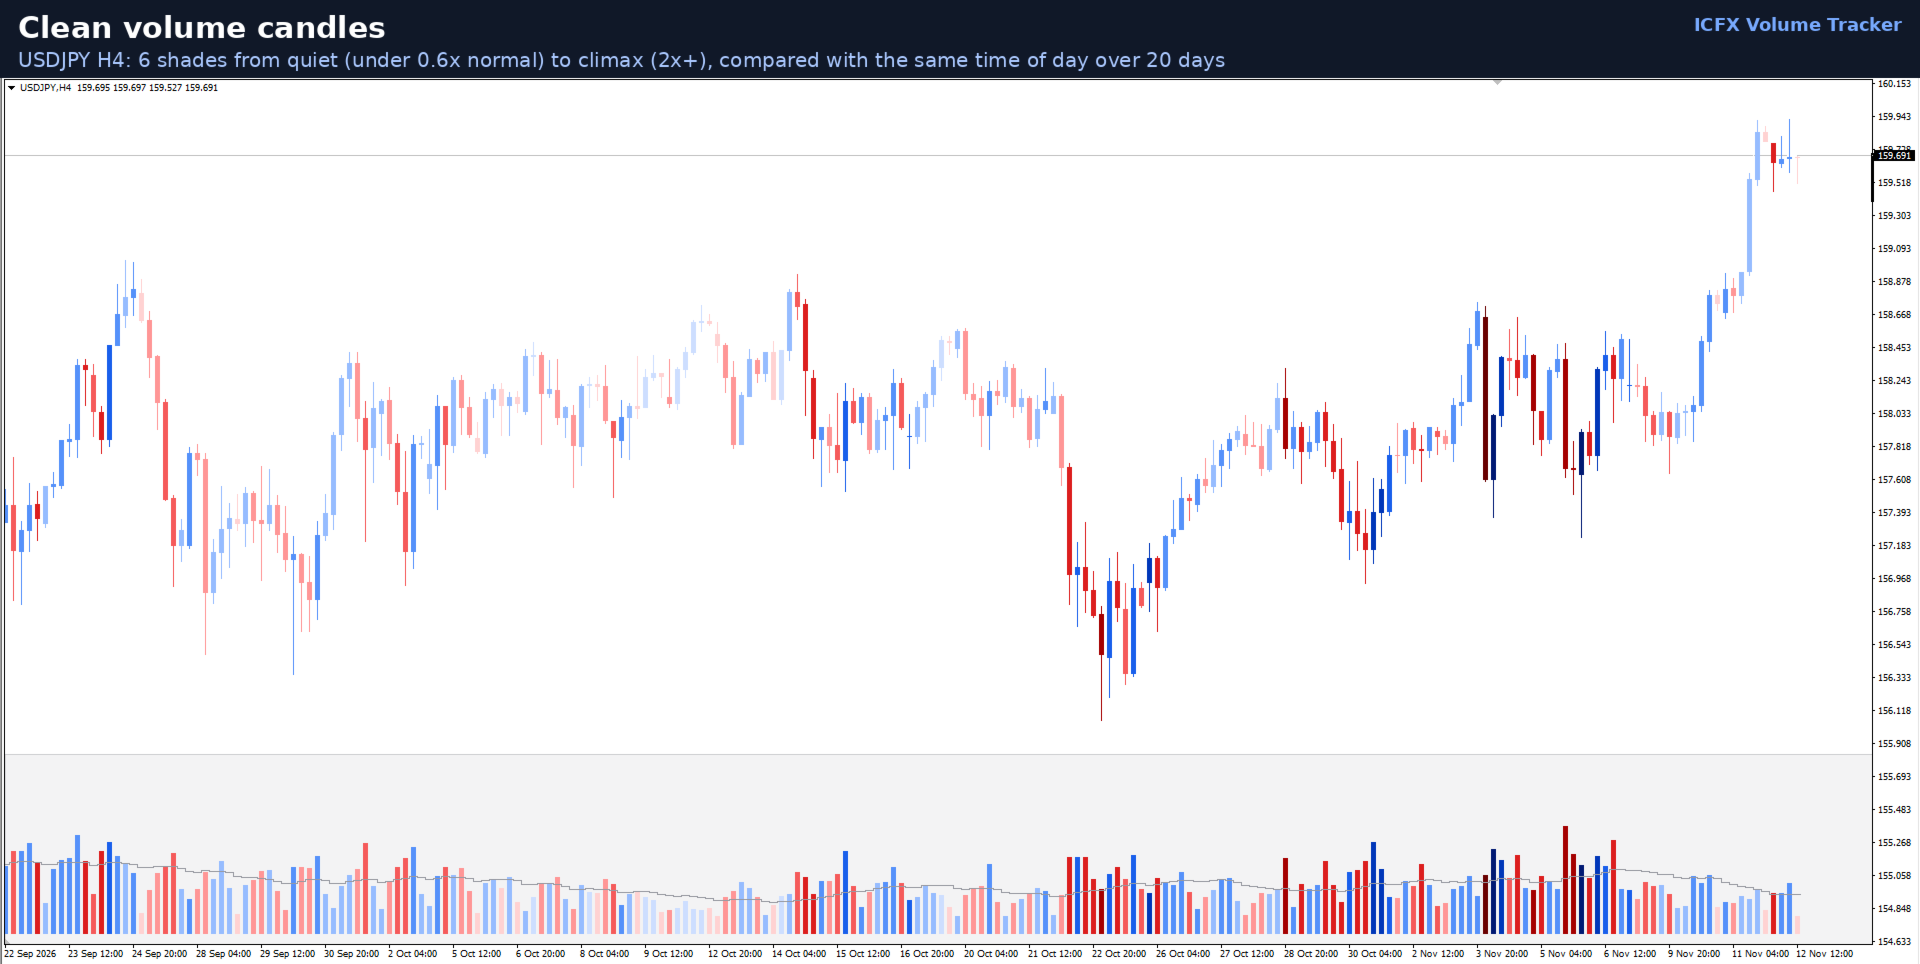
- Volume-coloured candles (6 shades). Each candle is shaded by relative volume, from quiet (under 0.6x normal) to climax (2x and more). On white charts the darkest shade is the most volume, on black charts the brightest - the more volume, the more the candle stands out.
- Fair volume comparison. Intraday volume is compared with the same time of day over the last 20 days, so the quiet Asian session is not mistaken for low volume and the London open is not mistaken for a climax.
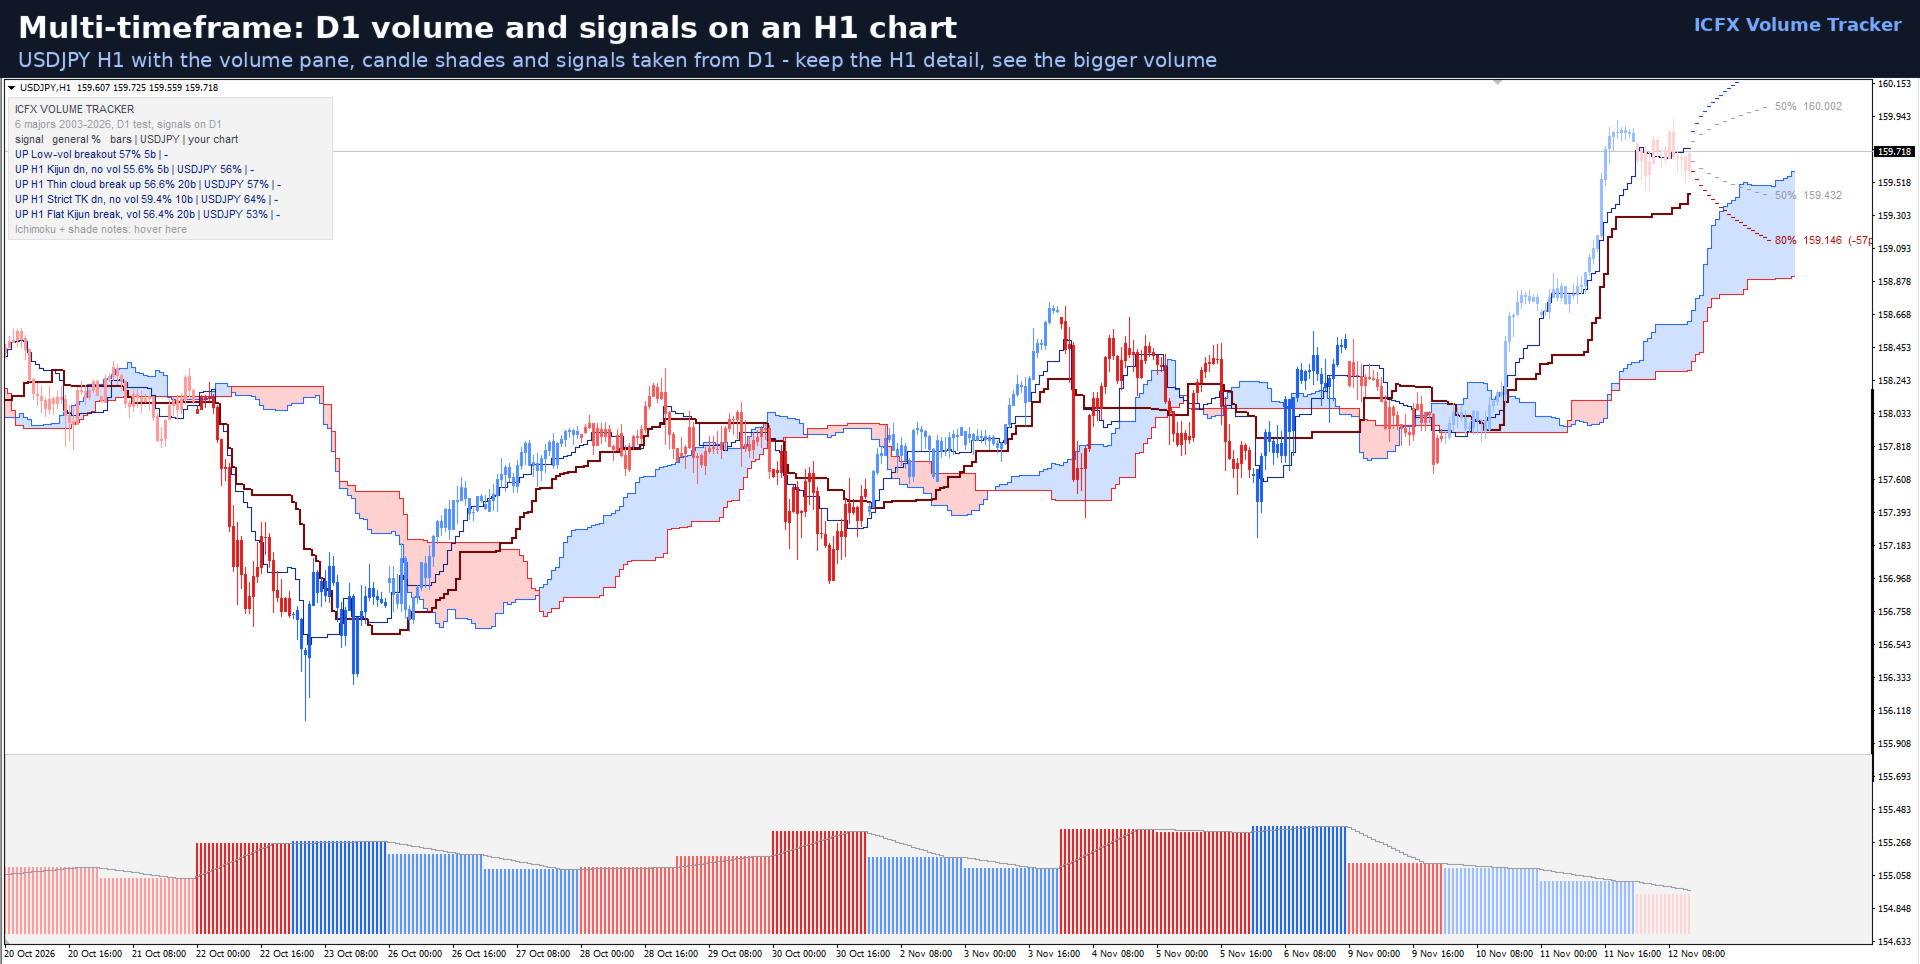
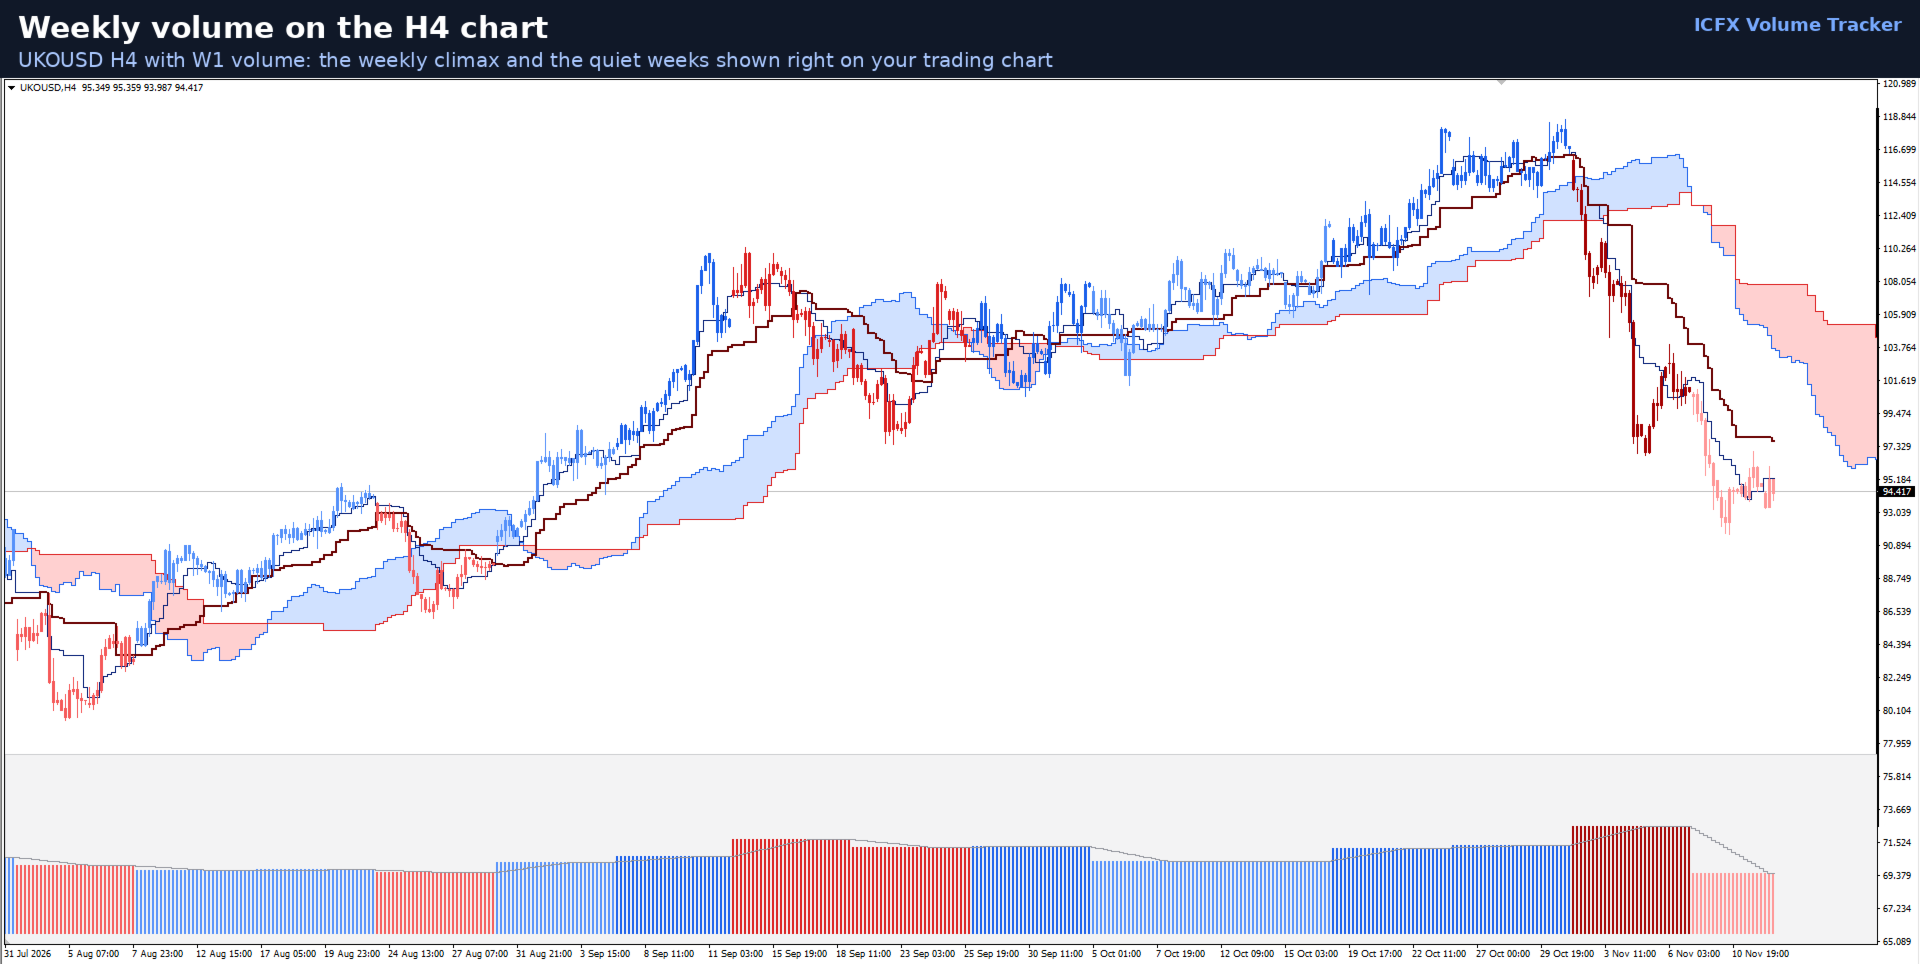
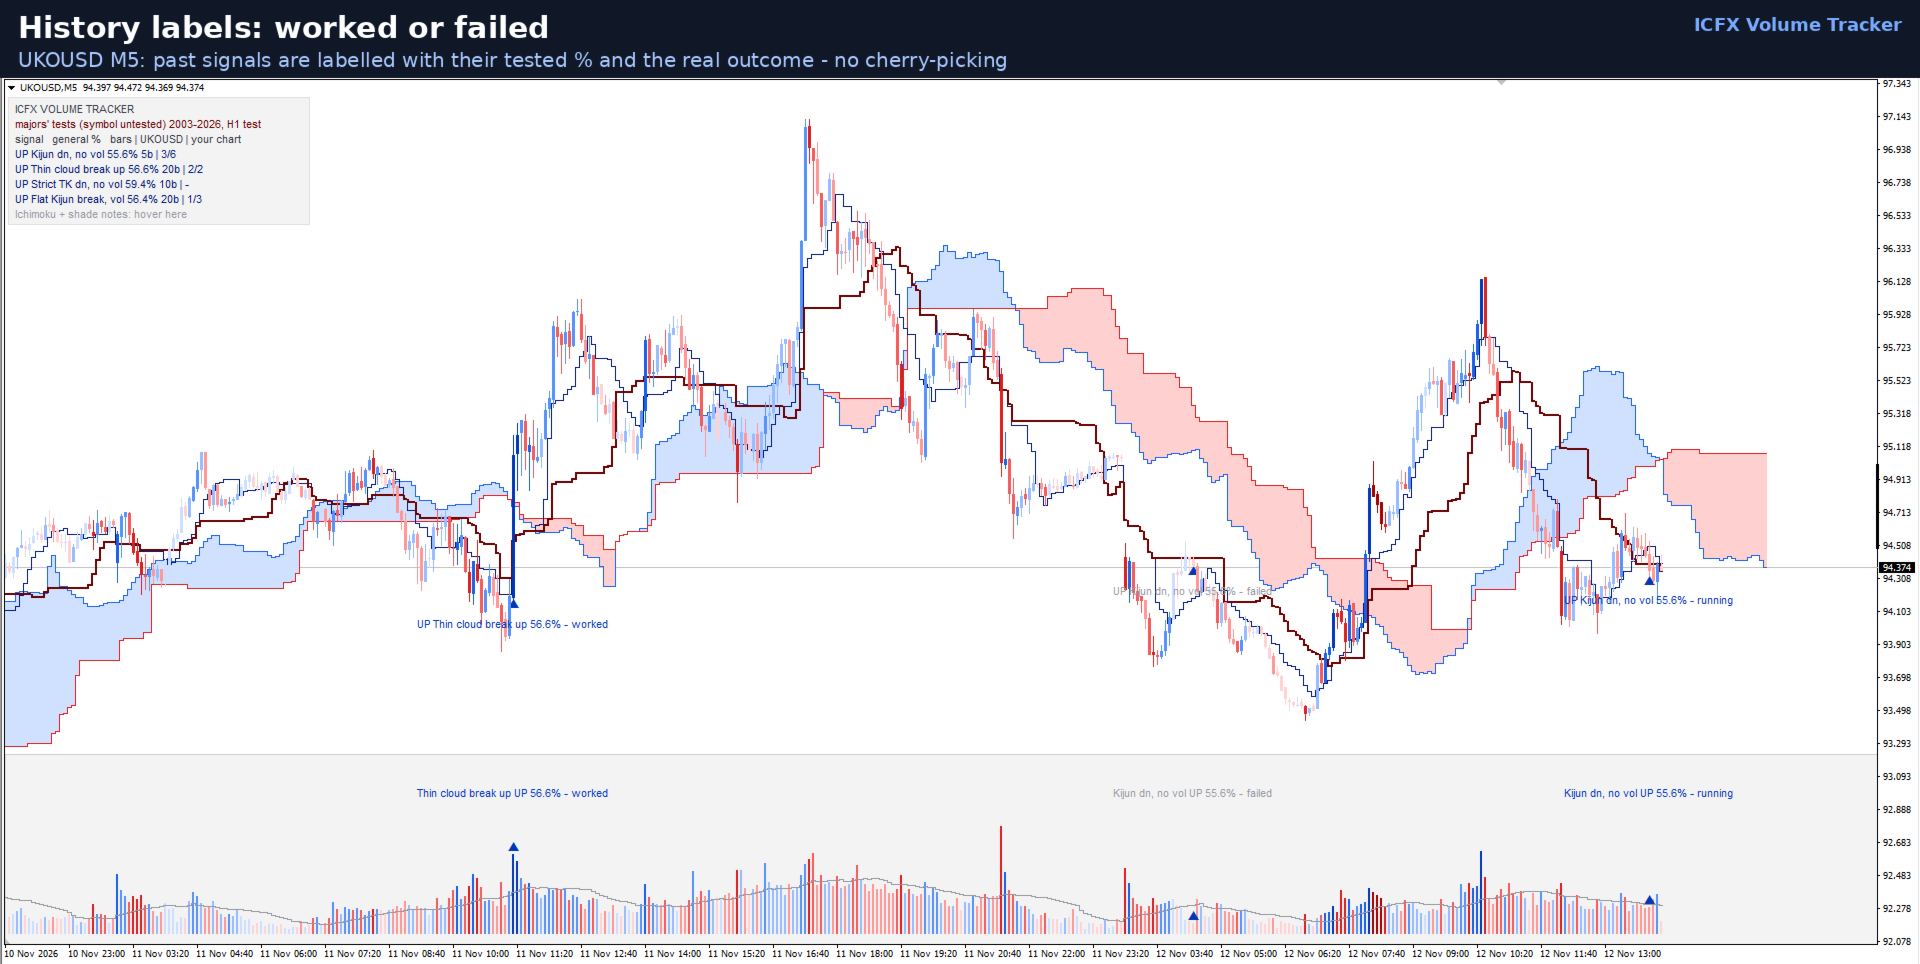
- Volume pane on the chart. 6-shade volume bars, average line, squeeze dots, signal arrows and labels along the bottom of the price chart. One switch removes it completely - no empty window.
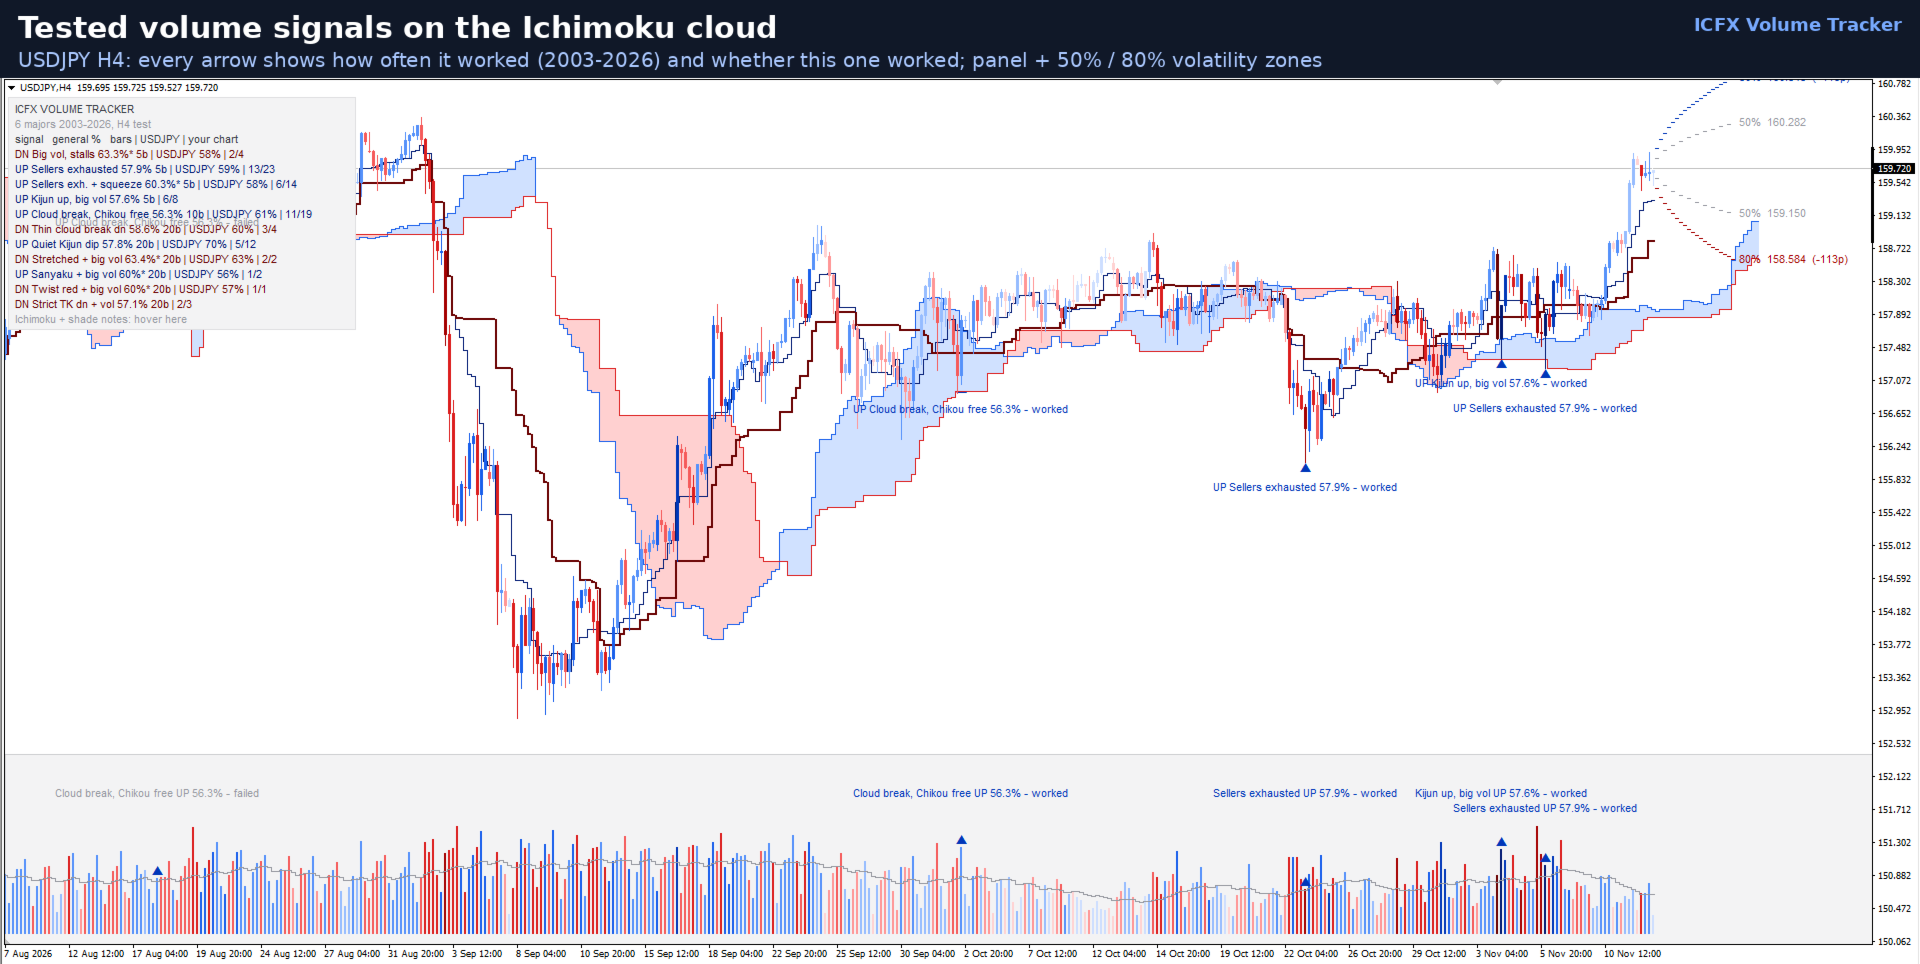
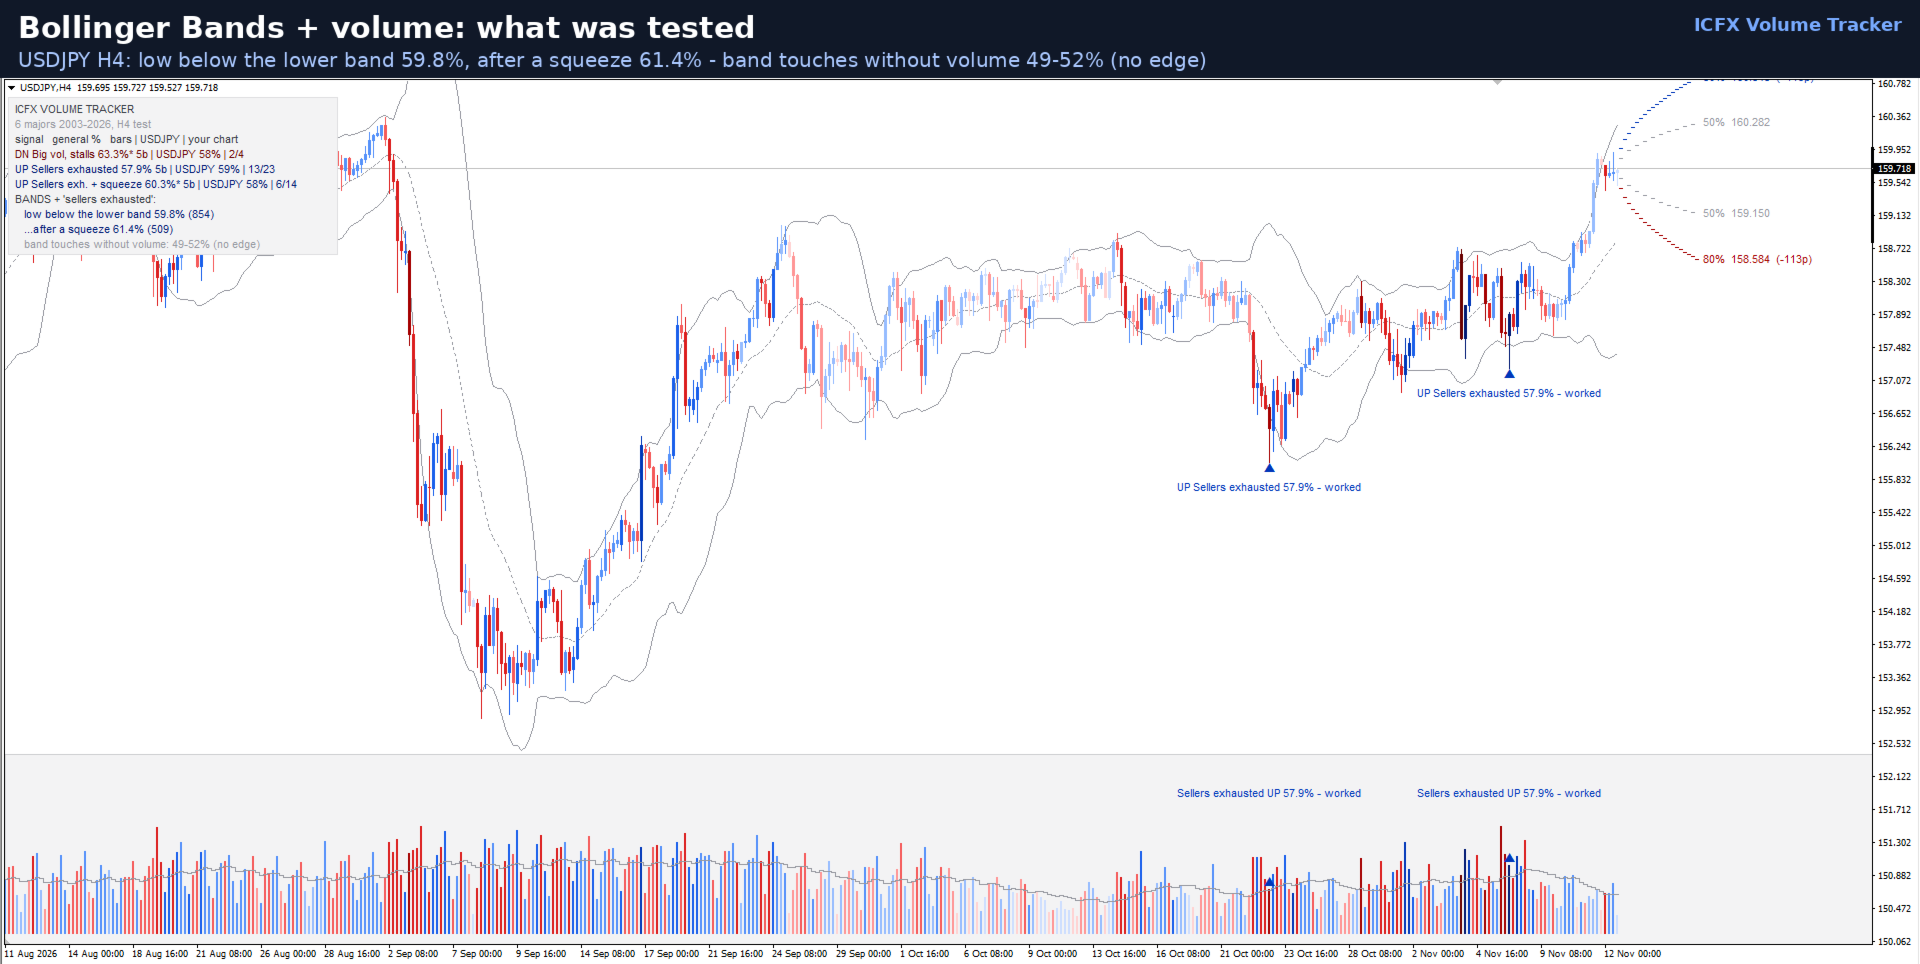
- Only tested signals. Sellers exhausted, big-volume stall, low-volume breakout fails, plus volume combined with Ichimoku (cloud, Kijun, Tenkan/Kijun, Sanyaku) and Bollinger Bands (squeeze, closes outside the band). A signal is shown only if it was right at least 55% of the time in BOTH halves of the history; 60%+ signals are marked strong (deepest shade and *).
- Plain-language labels. Every arrow says what happened and how often it worked, e.g. "UP Big vol stall 63%*". History arrows show whether each past signal worked or failed. Hover for the full test: cases, both periods, the result without the volume rule, and the result on your own symbol.
- Ichimoku or Bollinger on the chart. Soft, premium Ichimoku cloud by default (Chikou optional), or Bollinger Bands on 9 tested centre lines, including Exponential Bollinger.
- Multi-timeframe (MTF). Volume, signals and candle colours from H1, H4, D1 or W1 on any lower chart; Ichimoku and Bands stay on your chart's timeframe unless you switch them too.
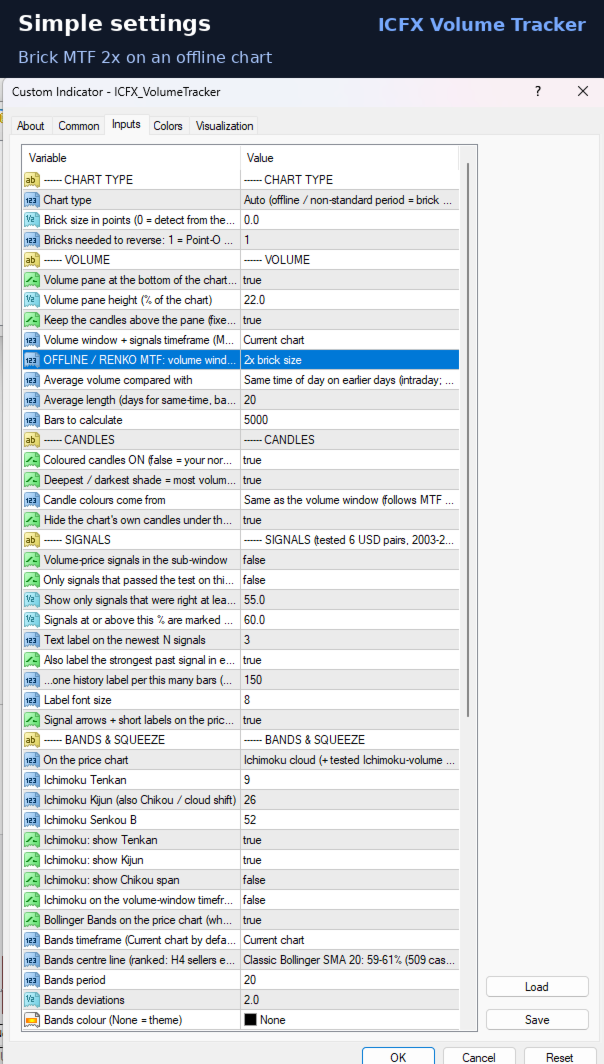
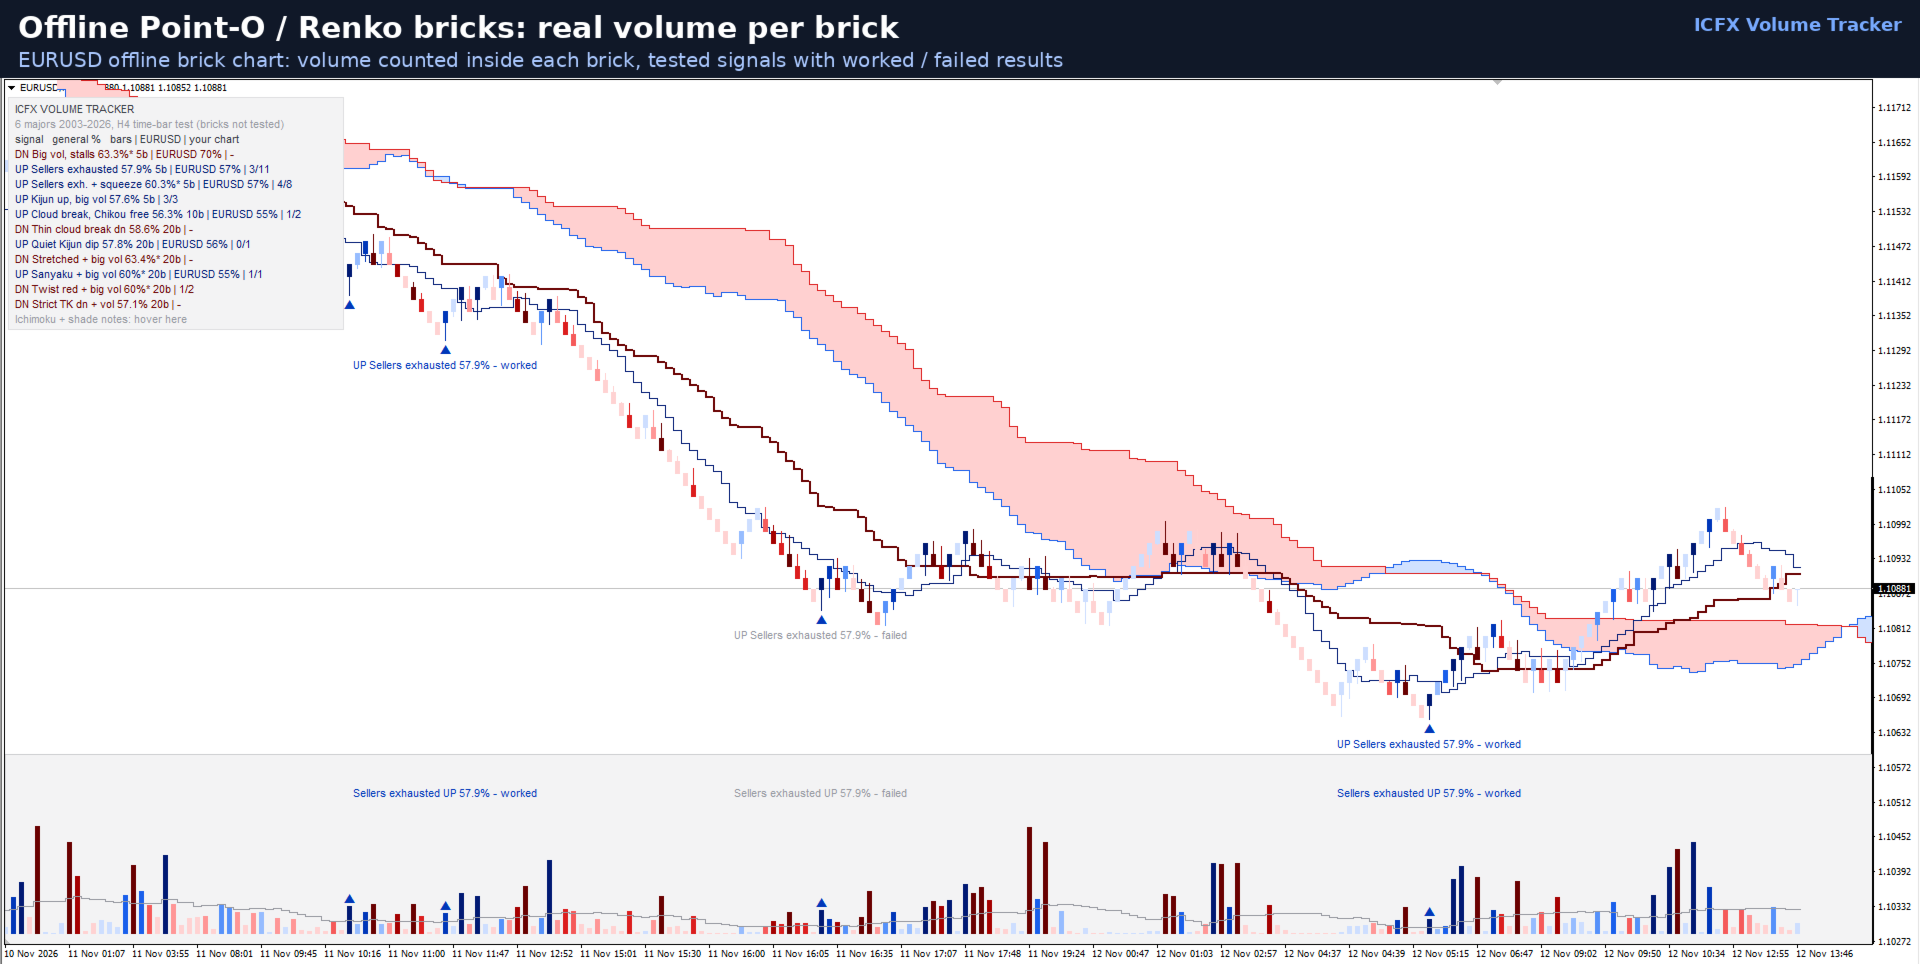
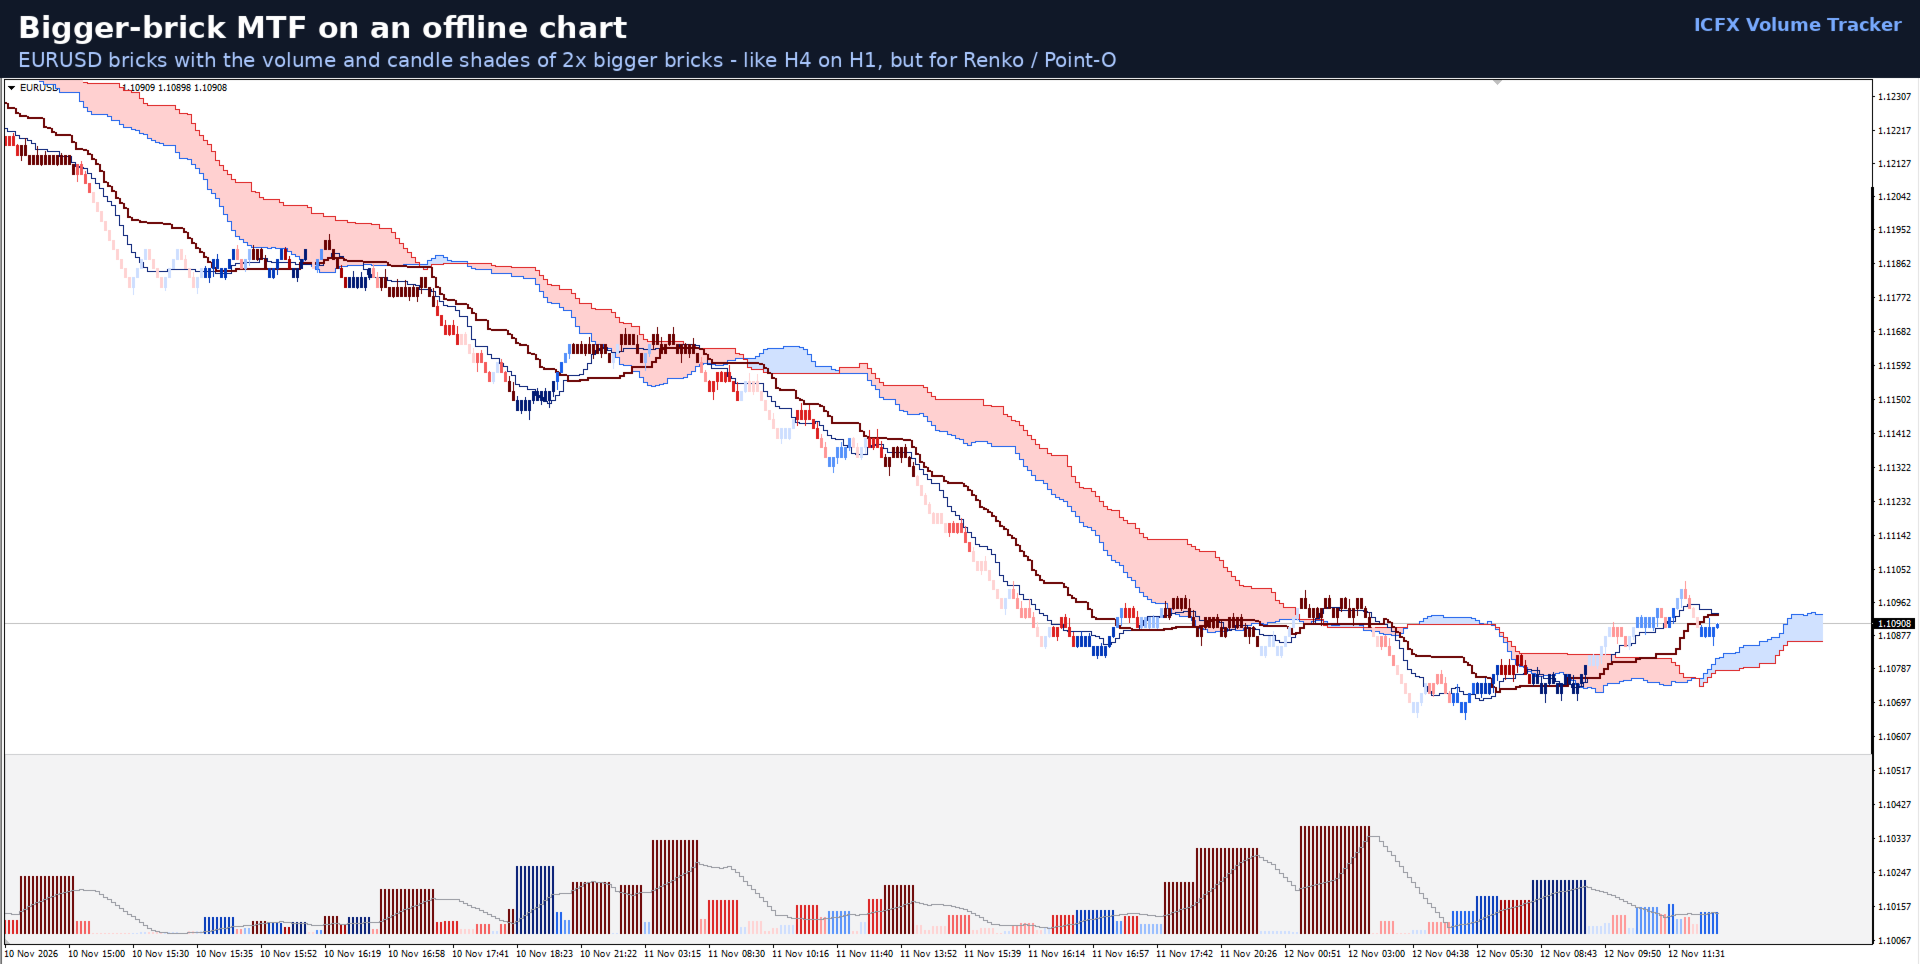
- Offline Point-O / Renko charts. Bricks are detected automatically, volume is counted correctly per brick, and bigger-brick MTF (2x to 10x) works just like a higher timeframe.
- Tested stop, TP1 and TP2. After a fresh signal the indicator draws the stop and two targets from the stop test (e.g. H4: stop 1.5-2 ATR, TP1 1.25 ATR, TP2 2.5 ATR) and warns when the stop is wider than your limit in pips.
- Volatility zones (optional). 50% and 80% ranges for the next 20 bars, ahead of price.
- Results panel. A compact, shaded panel lists the tested signals for your symbol and timeframe in plain words. Can be switched off.
- Colour schemes. 3 for white charts and 3 for black charts, plus your own gradient.
- Clean and safe. One file per platform, no DLL, no external files. Removes everything it drew when you take it off the chart.
How it works
- Relative volume. Each bar's tick volume is divided by its normal level (same time of day over 20 days, or the last 20 bars / bricks). The result sets the shade of the candle and the volume bar.
- Signals. Volume Price Analysis setups (in the spirit of Anna Coulling's VPA and Wyckoff) are checked on every closed bar, alone and together with Ichimoku or Bollinger Bands.
- The test behind each %. Every setup was tested on 2003-2026 data. Result = how often price was higher (UP signals) or lower (DOWN signals) a fixed number of bars later (5, 10 or 20). The history was split into two halves; a signal must reach the threshold in both, so a lucky period cannot carry it.
- Per group and per symbol. Majors and USD exotics have separate tables; where your own symbol did better, its number is shown next to the group result. Brent crude passed none of the signals, and the indicator says so instead of showing weak arrows.
- Levels. For signals that also passed the stop test, the tested stop and targets are drawn from the signal bar for a few bars, then removed.
The percentage on a label is the better of the two test halves; the tooltip shows both and the average.
Tested results (examples)
A few of the signals that passed, as the panel shows them (majors, 2003-2026; % = right after the stated number of bars, better test half).
| Signal | Timeframe | Tested % |
|---|---|---|
| Big-volume stall (effort without result) | H4 | up to 63% |
| Sellers exhausted + Bollinger squeeze | H4 | 59-60% |
| Late Kijun buy fails (volume) | D1 | 62% |
| Quiet flat-Kijun breakout | D1 | 61% |
| Kijun up, no volume | D1 | 60% |
| Strict Tenkan/Kijun cross down, no volume | H1 | 59% |
| Thin-cloud break up | H1 | 57% |
| Low-volume breakout fails (also on USD exotics) | H1-D1 | 55-57% |
The H4 majors signals also made money after realistic stops in the test (stop 1.5-2 ATR, TP1 1.25 ATR, TP2 2.5 ATR). What did NOT pass is not shown: plain volume spikes, volume profile lines, thick clouds alone, and most signals on Brent.
MTF and offline charts - the unique part
- Higher timeframe on a lower chart. Choose VolumeTF = H4 on an H1 chart: the volume bars, signals and candle shades come from H4 and update as each H4 bar builds, while you keep H1 detail. Every MTF label carries its timeframe (e.g. "H4 Big vol stall 63%").
- Ichimoku and Bands stay with your chart by default, so the cloud you see always matches the Ichimoku signals. One switch moves the cloud and its signals to the higher timeframe as well.
- Offline Point-O and Renko charts. The indicator recognises brick charts automatically and counts the real volume inside each brick. BrickMTF shows the volume and signals of 2x to 10x bigger bricks on your brick chart - like H4 on H1, but for bricks. Ichimoku can follow the bigger bricks too.
- Pixel-exact drawing. Candles, cloud and arrows are drawn so they line up exactly on time charts and on brick charts, at any zoom.
Settings and defaults
It starts clean and volume-first; everything else is one switch away.
| Setting | Default | What it does |
|---|---|---|
| ShowVolumeWindow | On | Volume pane along the bottom of the chart; off = gone completely |
| ColourCandles | On | 6-shade volume candles |
| MinHitRate / StrongHitRate | 55% / 60% | Show signals from 55%; mark 60%+ as strong. Set 60 for only the strongest |
| Overlay | Ichimoku | Ichimoku, Bollinger Bands or none |
| VolumeTF | Current | H1 / H4 / D1 / W1 volume and signals on a lower chart |
| BrickMTF | 1x | 2x-10x bigger bricks on offline Point-O / Renko charts |
| ShowTradeLevels | On | Tested stop / TP1 / TP2 after a fresh signal |
| MaxStopPips | 50 pips | Warns when a tested stop is wider |
| ShowProjection | Off | 50% / 80% volatility zones ahead of price |
| ShowChartPanel / PanelBackground | On / On | Results panel and its shaded box |
| VolColorTheme / DeepIsMost | Auto / Off | Colour scheme; how shades map to volume on black charts |
Good to know
- Works on MetaTrader 5 and MetaTrader 4 (separate products), any symbol and timeframe. Tested results exist for H1, H4 and D1; on other timeframes and untested symbols the panel says so and uses the closest tested table.
- Uses tick volume, as provided by your broker. Brokers differ a little, but relative volume (vs. normal) is very stable between brokers.
- Percentages describe the past; they are probabilities, not promises. Use them to choose and size trades, with your own risk management.
- Upgrading from the old Volume Tracker: remove the old copy from the chart, then attach the new one. If it is attached twice, the second copy shows a note instead of drawing everything twice.