QCL OrderFlow Footprint
- Indicadores
-
Shujah Amin
 My journey into algorithmic trading was born from the same frustration many traders face: the battle against emotions and the risks of human error. Determined to master the markets, I transitioned from manual trading to deep-level MQL5 development, focusing on the volatility of Gold (XAUUSD).
- Versão: 1.0
- Ativações: 10
QCL OrderFlow Footprint – See What Happens Inside Every Candle
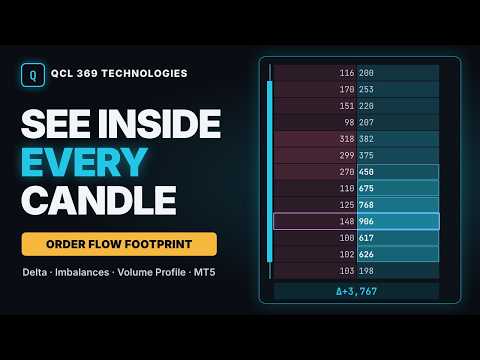
A normal candle shows only four prices: open, high, low and close. That is the result of a move, not its cause. QCL OrderFlow Footprint opens every candle and shows the volume traded at each price level, split into aggressive sellers and aggressive buyers. You can see who really drove the move and where it was decided – support, resistance, breakouts and reversals read from traded volume instead of guessed from the candle shape.
Built for traders who make their own decisions: scalpers and intraday traders on gold, indices, forex and crypto CFDs, and swing traders who want to check their entries at key levels. Beginners get a clear legend and plain-language settings. Experienced order-flow traders get full control – every layer can be switched on or off.
WHAT YOU SEE ON THE CHART
Footprint cells – every price row of a candle shows two numbers: volume sold at the bid (aggressive sellers, left) and volume bought at the ask (aggressive buyers, right). Stronger colour = more business at that price.
Delta – buyers minus sellers for every candle, shown as a badge under the bar. A gold edge marks a divergence: the candle colour and the delta disagree.
Diagonal imbalances – where one side was clearly stronger (default 3:1, adjustable), the cell is framed and bold. A minimum-volume filter stops tiny rows from counting.
Stacked imbalance zones – three or more imbalances in a row form a zone that is extended to the right. Zones show whether they have been tested and disappear once price closes through them.
Point of control – the busiest price of every candle is framed.
Absorption – heavy aggressive volume at a high or low that did not move price (large passive orders soaked it up) is marked with a ring.
Unfinished auctions – a high or low where both sides were still trading when the candle closed. A line stays on the chart until price returns.
FIVE FOOTPRINT STYLES (keys 1 – 5)
1 Bid/Ask – the classic two-column footprint
2 Delta – buyers minus sellers at every price
3 Impact – every row coloured by its delta strength
4 Cluster – a volume bar per price, split into buy and sell part
5 Profile – bid/ask numbers plus a mini volume profile per candle
CONTEXT TOOLS
- Volume profile of the visible candles with POC, value area high and low (70%)
- Daily VWAP with optional ±1 standard deviation bands
- Nearest support and resistance from H1, H4 and D1 with their state: fresh, first test, tested
- Volume strip with buy/sell split, average line and a frame on unusually high volume
- Cumulative delta (CVD) strip with a price line on top – when price and CVD move apart, the move may be losing fuel
SIDE PANEL
DOM tab – traded volume per price over 1, 5, 15 or 60 minutes, centred on the current price, with the busiest price marked and buy/sell pressure of the last 60 seconds.
FLOW tab – absorption monitor (effort versus result over the last minute), active zones nearest to price, recent absorption candles, open unfinished auctions and nearest levels.
EASY TO USE
- Basic, Plus and Full views – start quiet, switch on more when you are ready
- Settings window with one plain sentence per switch, saved per symbol
- Automatic row size keeps the numbers readable; Ctrl + mouse wheel to set it yourself
- Mouse wheel zooms, drag scrolls through history, R returns to the live candle
- Three colour themes: Neon, Mono and Light
- Focus mode hides everything except the footprint
- Press H for the full legend of colours and keys
KEYS
1-5 style | I imbalances | Z zones | P POC | B absorption | U unfinished auctions | G divergence | W VWAP | L levels | V profile | C strips | D side panel | N numbers | F focus | S settings | T theme | H help | R live
HONEST ABOUT THE DATA
Footprint data depends on your broker's feed. On forex and CFDs (gold, indices, crypto CFDs) brokers send price ticks, not real trades. The indicator then uses tick volume and estimates the buyer/seller side from price changes. The numbers show relative activity – very useful for reading pressure, absorption and imbalances, but they are not contracts. The chart says "TICK VOLUME" openly. On exchange instruments that deliver real trades with the aggressor side, the real volume is used and the chart says "REAL VOLUME".
TECHNICAL DETAILS
- MetaTrader 5 only, any symbol, any timeframe (best on M1 – H1)
- Uses your broker's tick history; no DLL, no internet connection
- The first start can take a moment while MetaTrader downloads ticks
- Marks are calculated on closed candles and do not repaint; the running candle updates live
- In the Strategy Tester choose "Every tick based on real ticks"
- This is an indicator: it never opens, manages or closes trades
INPUTS
Bars to load | Price row size in ticks (0 = auto) | Volume source | Imbalance ratio | Minimum volume for an imbalance | Rows for a stacked zone | Absorption factor | CVD reset (daily or running) | Footprint style | View preset | Colour theme | Buyer and seller colours | Starting candle width | Reset saved settings
RISK WARNING
Trading forex, CFDs and other leveraged products involves a high level of risk and may not be suitable for all investors. This indicator is a tool for analysis and decision support only. It does not give buy or sell signals and does not guarantee any result. Past market behaviour is no guarantee of future results. Always test on a demo account first and trade only with money you can afford to lose.
A normal candle shows only four prices: open, high, low and close. That is the result of a move, not its cause. QCL OrderFlow Footprint opens every candle and shows the volume traded at each price level, split into aggressive sellers and aggressive buyers. You can see who really drove the move and where it was decided – support, resistance, breakouts and reversals read from traded volume instead of guessed from the candle shape.
Built for traders who make their own decisions: scalpers and intraday traders on gold, indices, forex and crypto CFDs, and swing traders who want to check their entries at key levels. Beginners get a clear legend and plain-language settings. Experienced order-flow traders get full control – every layer can be switched on or off.
WHAT YOU SEE ON THE CHART
Footprint cells – every price row of a candle shows two numbers: volume sold at the bid (aggressive sellers, left) and volume bought at the ask (aggressive buyers, right). Stronger colour = more business at that price.
Delta – buyers minus sellers for every candle, shown as a badge under the bar. A gold edge marks a divergence: the candle colour and the delta disagree.
Diagonal imbalances – where one side was clearly stronger (default 3:1, adjustable), the cell is framed and bold. A minimum-volume filter stops tiny rows from counting.
Stacked imbalance zones – three or more imbalances in a row form a zone that is extended to the right. Zones show whether they have been tested and disappear once price closes through them.
Point of control – the busiest price of every candle is framed.
Absorption – heavy aggressive volume at a high or low that did not move price (large passive orders soaked it up) is marked with a ring.
Unfinished auctions – a high or low where both sides were still trading when the candle closed. A line stays on the chart until price returns.
FIVE FOOTPRINT STYLES (keys 1 – 5)
1 Bid/Ask – the classic two-column footprint
2 Delta – buyers minus sellers at every price
3 Impact – every row coloured by its delta strength
4 Cluster – a volume bar per price, split into buy and sell part
5 Profile – bid/ask numbers plus a mini volume profile per candle
CONTEXT TOOLS
- Volume profile of the visible candles with POC, value area high and low (70%)
- Daily VWAP with optional ±1 standard deviation bands
- Nearest support and resistance from H1, H4 and D1 with their state: fresh, first test, tested
- Volume strip with buy/sell split, average line and a frame on unusually high volume
- Cumulative delta (CVD) strip with a price line on top – when price and CVD move apart, the move may be losing fuel
SIDE PANEL
DOM tab – traded volume per price over 1, 5, 15 or 60 minutes, centred on the current price, with the busiest price marked and buy/sell pressure of the last 60 seconds.
FLOW tab – absorption monitor (effort versus result over the last minute), active zones nearest to price, recent absorption candles, open unfinished auctions and nearest levels.
EASY TO USE
- Basic, Plus and Full views – start quiet, switch on more when you are ready
- Settings window with one plain sentence per switch, saved per symbol
- Automatic row size keeps the numbers readable; Ctrl + mouse wheel to set it yourself
- Mouse wheel zooms, drag scrolls through history, R returns to the live candle
- Three colour themes: Neon, Mono and Light
- Focus mode hides everything except the footprint
- Press H for the full legend of colours and keys
KEYS
1-5 style | I imbalances | Z zones | P POC | B absorption | U unfinished auctions | G divergence | W VWAP | L levels | V profile | C strips | D side panel | N numbers | F focus | S settings | T theme | H help | R live
HONEST ABOUT THE DATA
Footprint data depends on your broker's feed. On forex and CFDs (gold, indices, crypto CFDs) brokers send price ticks, not real trades. The indicator then uses tick volume and estimates the buyer/seller side from price changes. The numbers show relative activity – very useful for reading pressure, absorption and imbalances, but they are not contracts. The chart says "TICK VOLUME" openly. On exchange instruments that deliver real trades with the aggressor side, the real volume is used and the chart says "REAL VOLUME".
TECHNICAL DETAILS
- MetaTrader 5 only, any symbol, any timeframe (best on M1 – H1)
- Uses your broker's tick history; no DLL, no internet connection
- The first start can take a moment while MetaTrader downloads ticks
- Marks are calculated on closed candles and do not repaint; the running candle updates live
- In the Strategy Tester choose "Every tick based on real ticks"
- This is an indicator: it never opens, manages or closes trades
INPUTS
Bars to load | Price row size in ticks (0 = auto) | Volume source | Imbalance ratio | Minimum volume for an imbalance | Rows for a stacked zone | Absorption factor | CVD reset (daily or running) | Footprint style | View preset | Colour theme | Buyer and seller colours | Starting candle width | Reset saved settings
RISK WARNING
Trading forex, CFDs and other leveraged products involves a high level of risk and may not be suitable for all investors. This indicator is a tool for analysis and decision support only. It does not give buy or sell signals and does not guarantee any result. Past market behaviour is no guarantee of future results. Always test on a demo account first and trade only with money you can afford to lose.