Obsidian Trend
- Indicadores
- Versão: 1.0
- Ativações: 10

Obsidian Trend: Trend Reversal Signals with a Live Dashboard
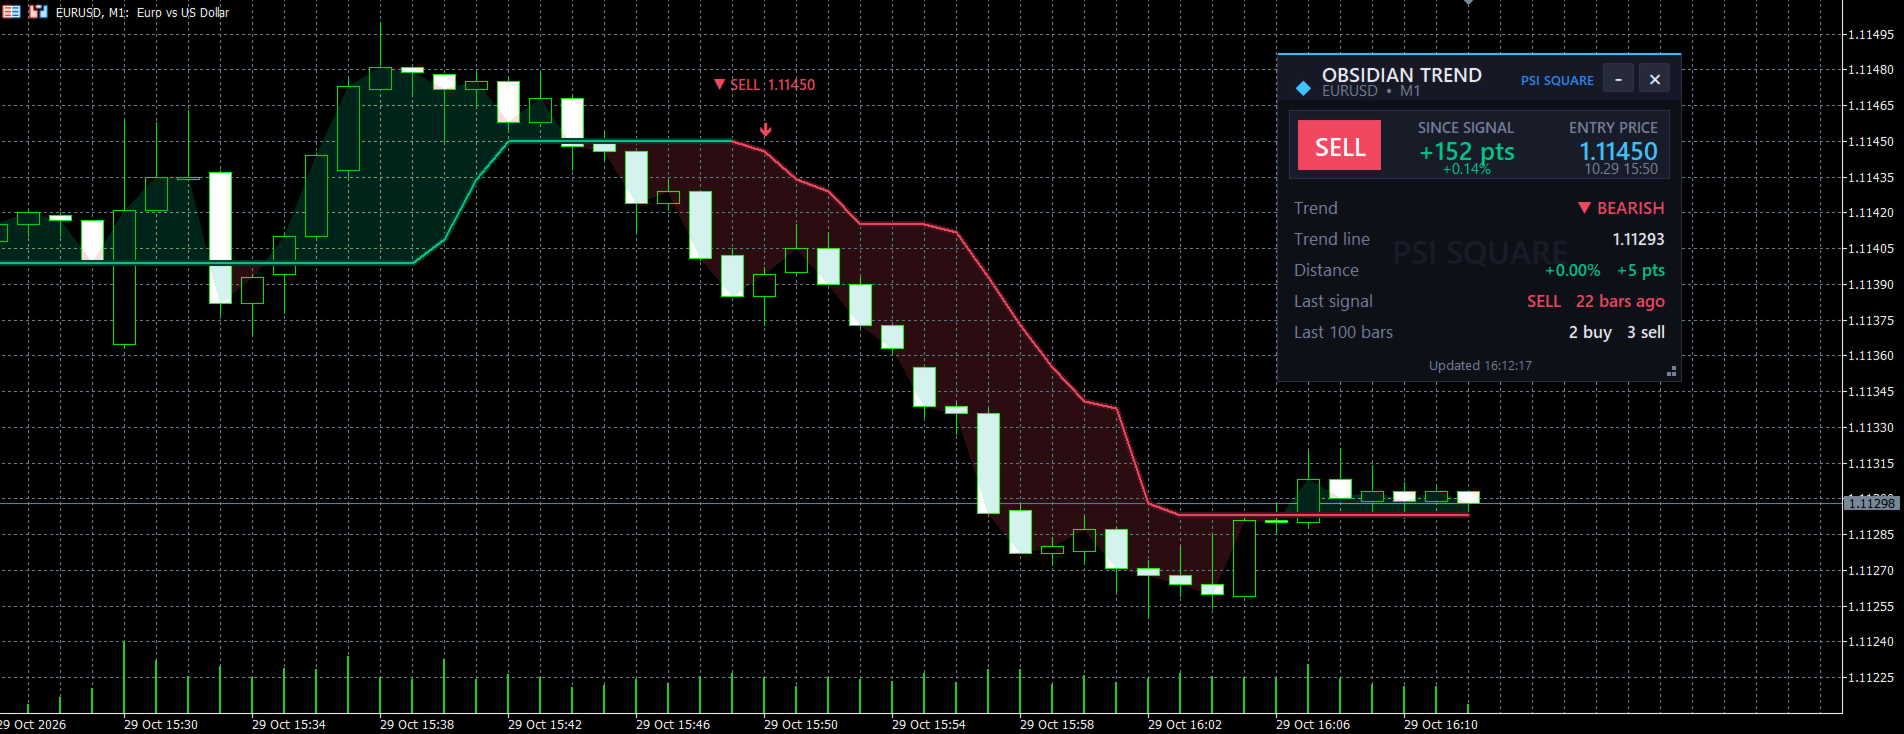
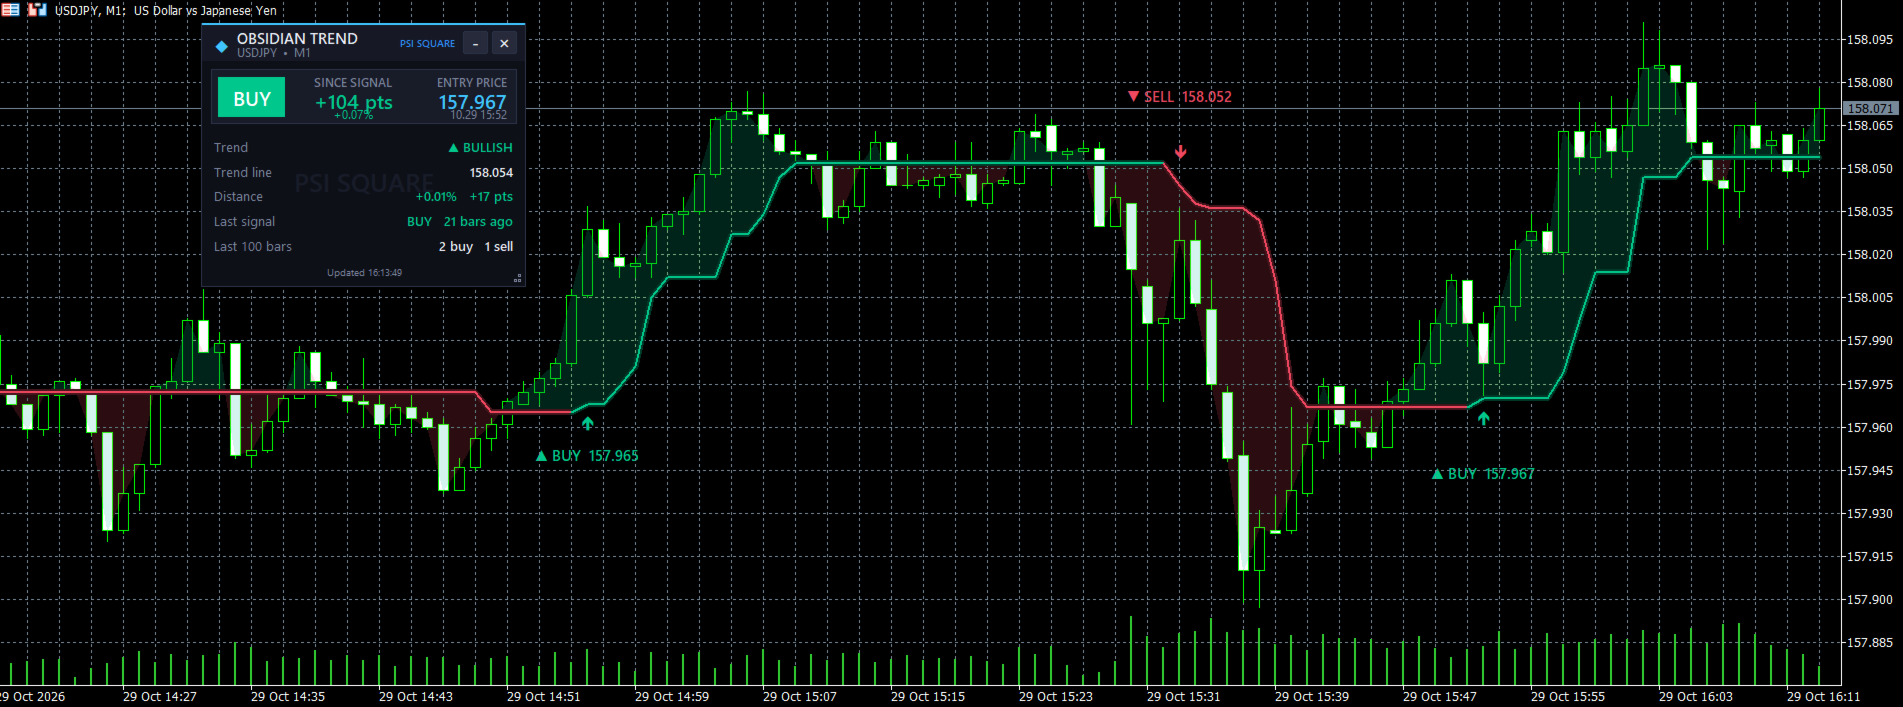
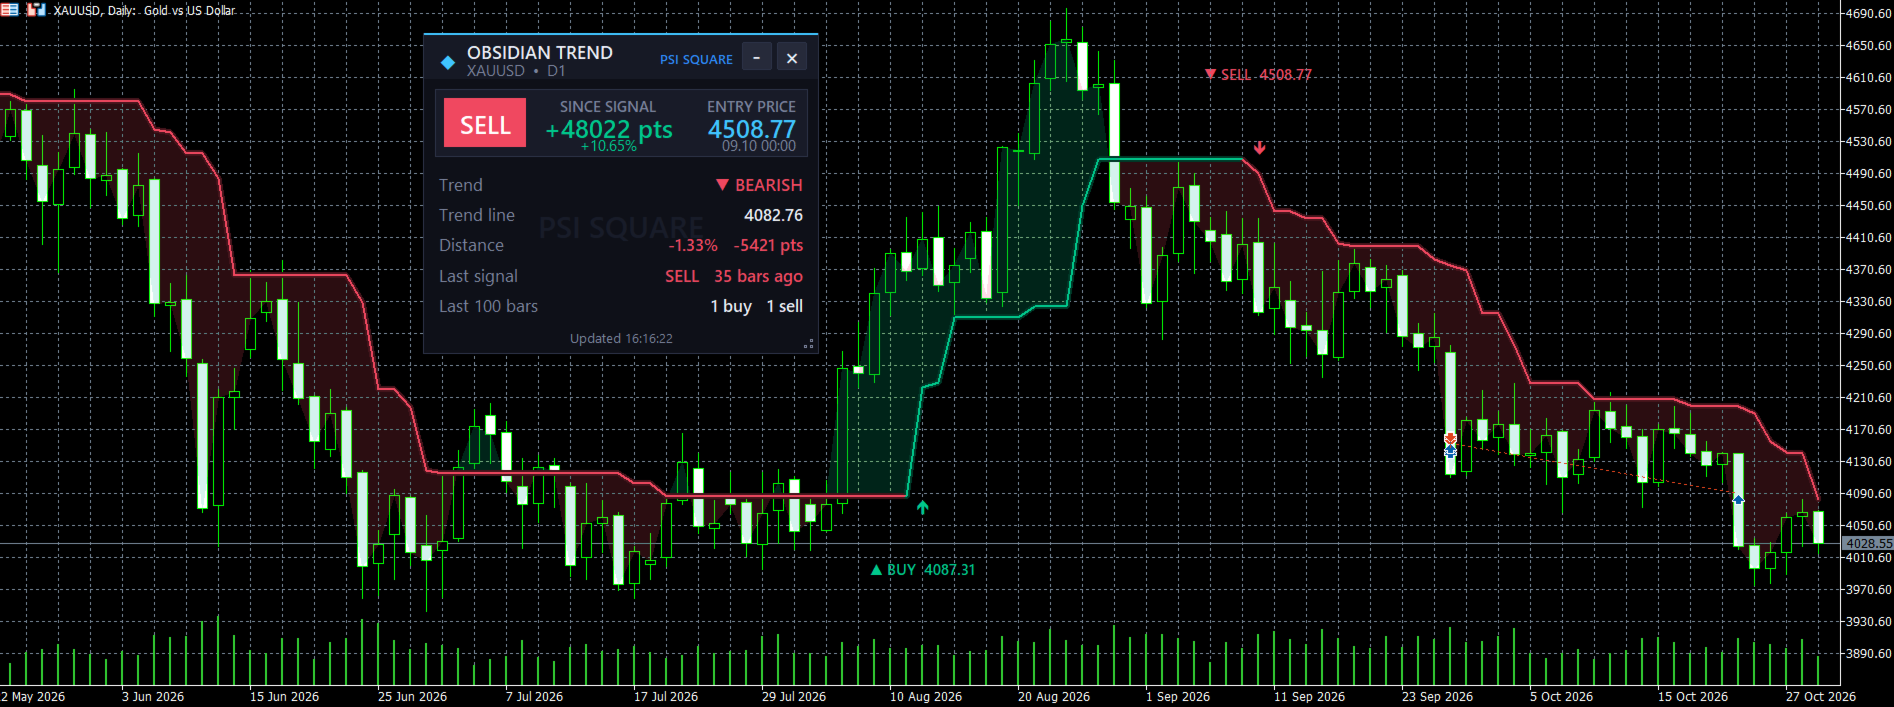
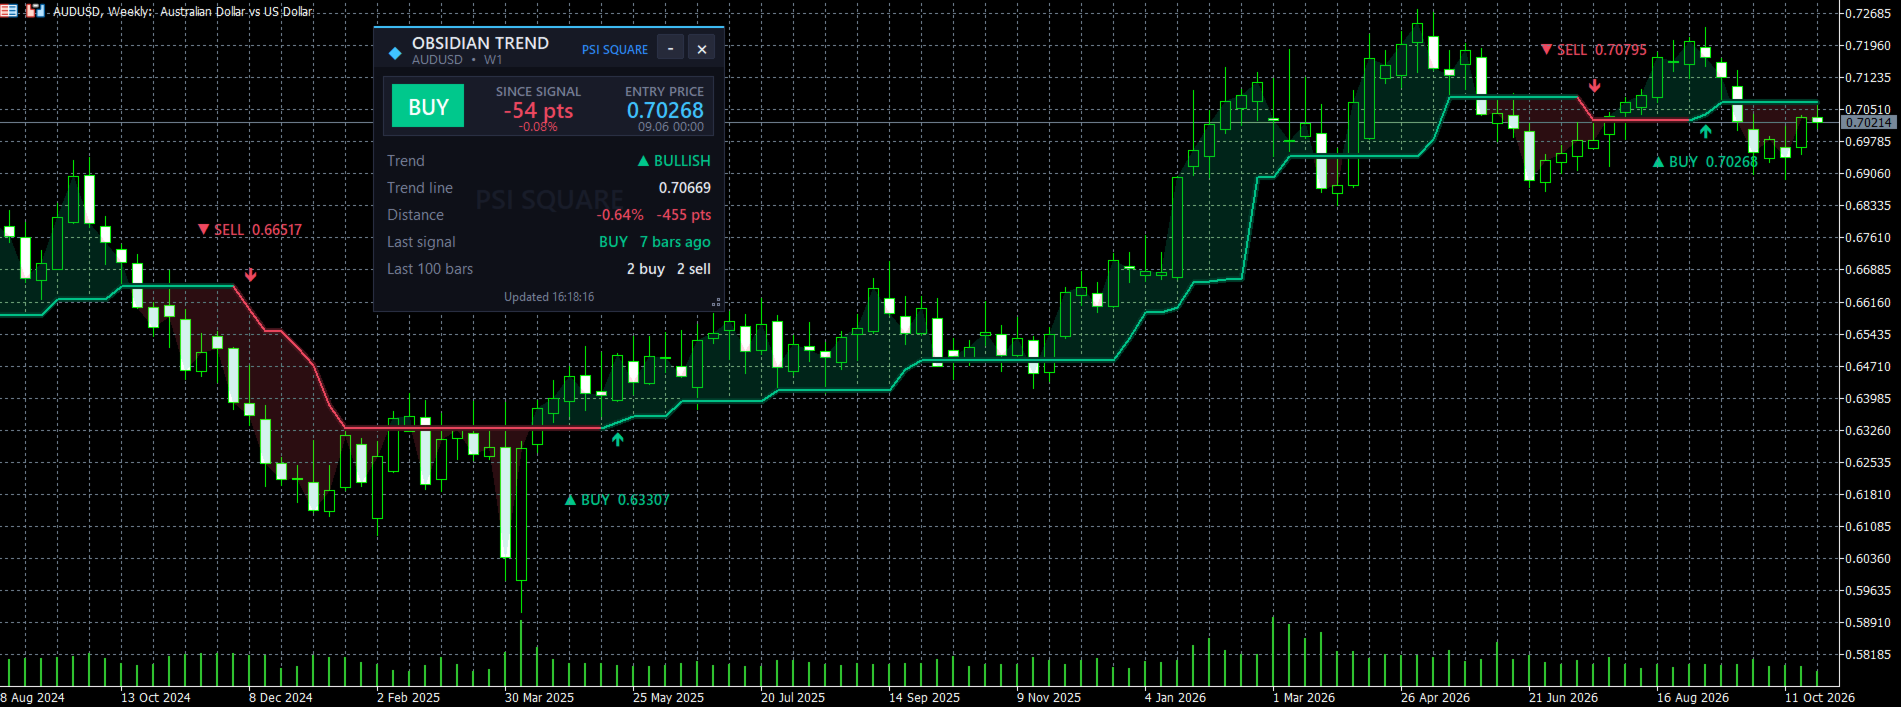
Obsidian Trend is a trend-following indicator that displays the market's direction as a single step-style trend line. When the trend reverses, it marks the change with an arrow and a BUY/SELL tag displaying the signal price. A live dashboard panel on the chart shows the current trend, the latest signal, and how price has moved since the signal appeared.
The trend line follows the market using recent highs and lows over an adjustable Amplitude, confirmed by short two-bar averages of price. In an uptrend, it trails below price, while in a downtrend, it trails above. When price breaks through the line, the line changes color and a signal appears at the reversal. A single Amplitude setting is all you need to adjust: lower values react faster, while higher values produce fewer, slower signals.
Key Features
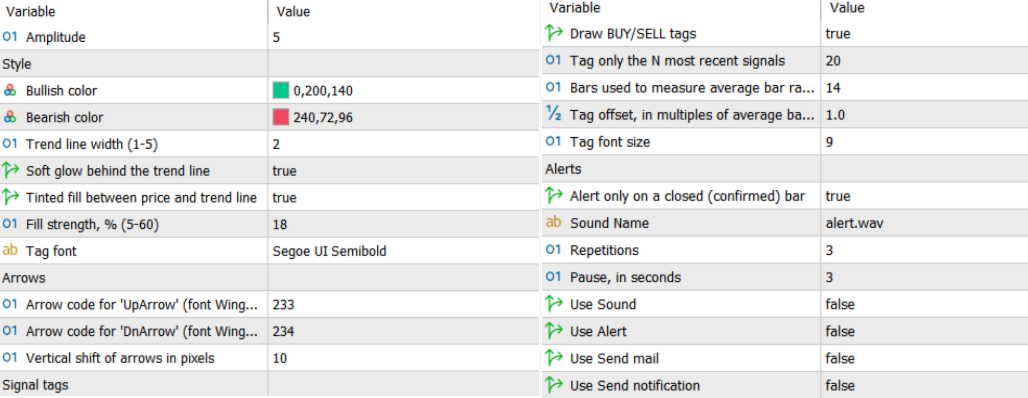
- Clear Buy/Sell Signals: Arrows and BUY/SELL tags appear exactly where the trend reverses. Each tag displays the signal price, and the tags are positioned away from the candles using the average bar range. You can choose how many recent signals to display, with a default of 20, keeping the chart clean and readable.
- Trend Line with Glow and Fill: The line changes color according to the trend direction. An optional soft glow appears behind it, while an optional tinted fill between price and the line provides a quick visual indication of market control. Bullish and bearish colors, line width, and fill strength are adjustable, and the shades adapt automatically to your chart background.
- Live Dashboard Panel: The dashboard displays the current trend direction, the trend line value, the distance of price from the line in percentage and points, the latest signal and how many bars ago it appeared, the signal's entry price, the price movement since the signal in points and percentage, and the number of buy and sell signals over the last 100 bars. You can drag the panel, resize it using the corner grip, minimize it to a small icon, or close it. Its position and size are remembered between sessions.
- Customizable Alerts: The indicator supports popup, sound, email, and mobile push notifications. You can configure the sound file, the number of repetitions, and the pause between them. By default, alerts trigger only after the signal bar closes, and no alert is triggered for an old signal when you attach or reload the indicator.
- Works on Any Symbol and Timeframe: Obsidian Trend can be used with forex, gold, indices, and cryptocurrencies across different timeframes, from scalping to swing trading.
Specifications
Alerts fire after the signal bar closes by default, helping ensure that confirmed signals do not repaint. The live bar can update until it closes, and you can switch to alerts on the live bar if you prefer. The indicator provides visual chart signals alongside sound, popup, email, and mobile push notifications. Trading involves risk, so always test the indicator on a demo account before using it in live trading.
Contact
If you have any questions or need help, contact me via Private Message.