Signal12
- Indicadores
- Versão: 1.0
- Ativações: 5

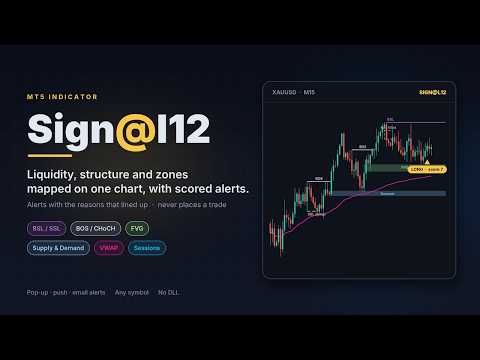
Sign@l12 puts the levels smart money traders usually mark by hand on one clean MT5 chart: liquidity, market structure, fair value gaps, supply and demand, sessions and VWAP. It keeps them on the chart while they matter, shows clearly when one is filled or swept, and alerts you when enough of them line up. Every signal can be switched on or off and fine tuned to the way you trade.
The default settings are built for scalpers and day traders (structure and zones are read on M15), but it works on any symbol and any timeframe.
One indicator instead of five: liquidity, structure, FVGs, zones, sessions and VWAP in one place.
A clean chart: one short label per item, and labels are moved apart automatically so they never overlap.
History you can read: filled FVGs, taken zones and swept levels turn into grey dashed outlines that stop at the candle that took them.
Nothing disappears over the weekend: everything stays for the number of trading days you choose, so Friday's levels are still there on Monday.
Alerts with reasons: every alert shows what lined up, so you can judge it in seconds.
WHAT IT DRAWS
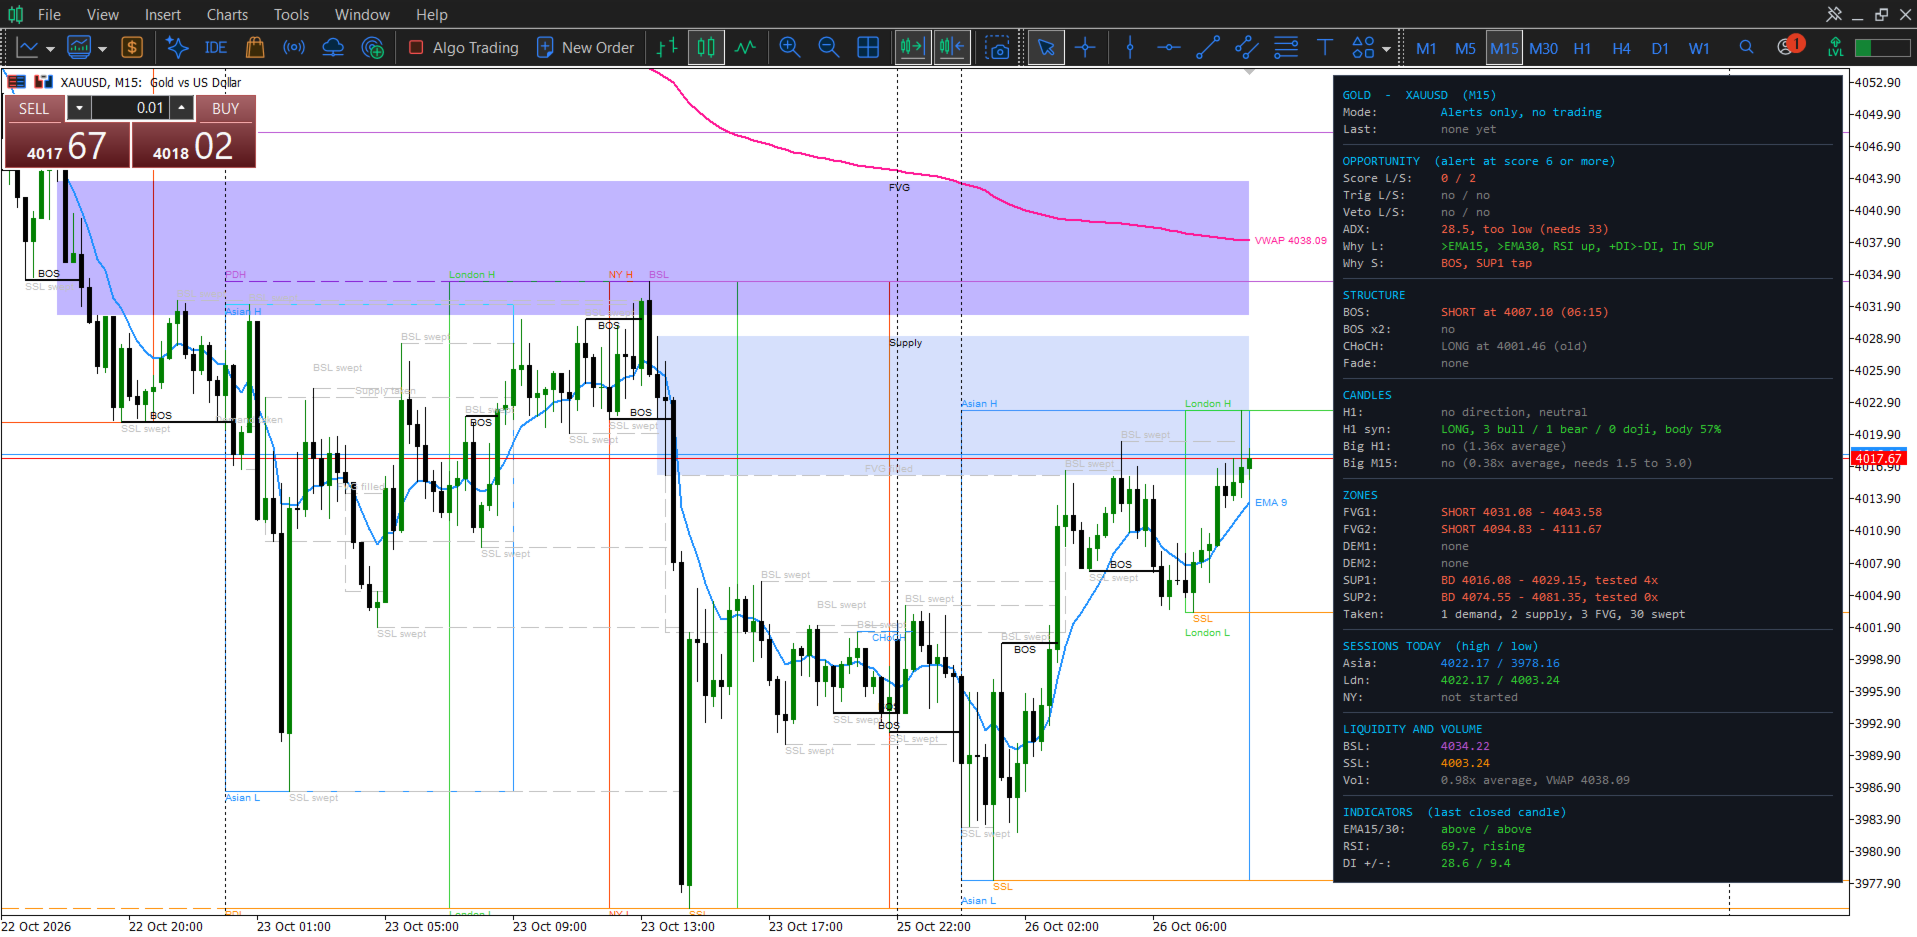
Liquidity: buy-side (BSL) and sell-side (SSL) levels at swing highs and lows, equal highs and lows (EQH / EQL), previous day high and low (PDH / PDL), previous week high and low, and the 6-week high and low. Swept levels turn grey.
Fair value gaps: nearby gaps in the same direction are merged into one, small gaps are skipped, and no new gap is drawn inside one that is still open.
Supply and demand: RBR, DBR, DBD and RBD zones.
Sessions: Asian, London and New York boxes with their high and low.
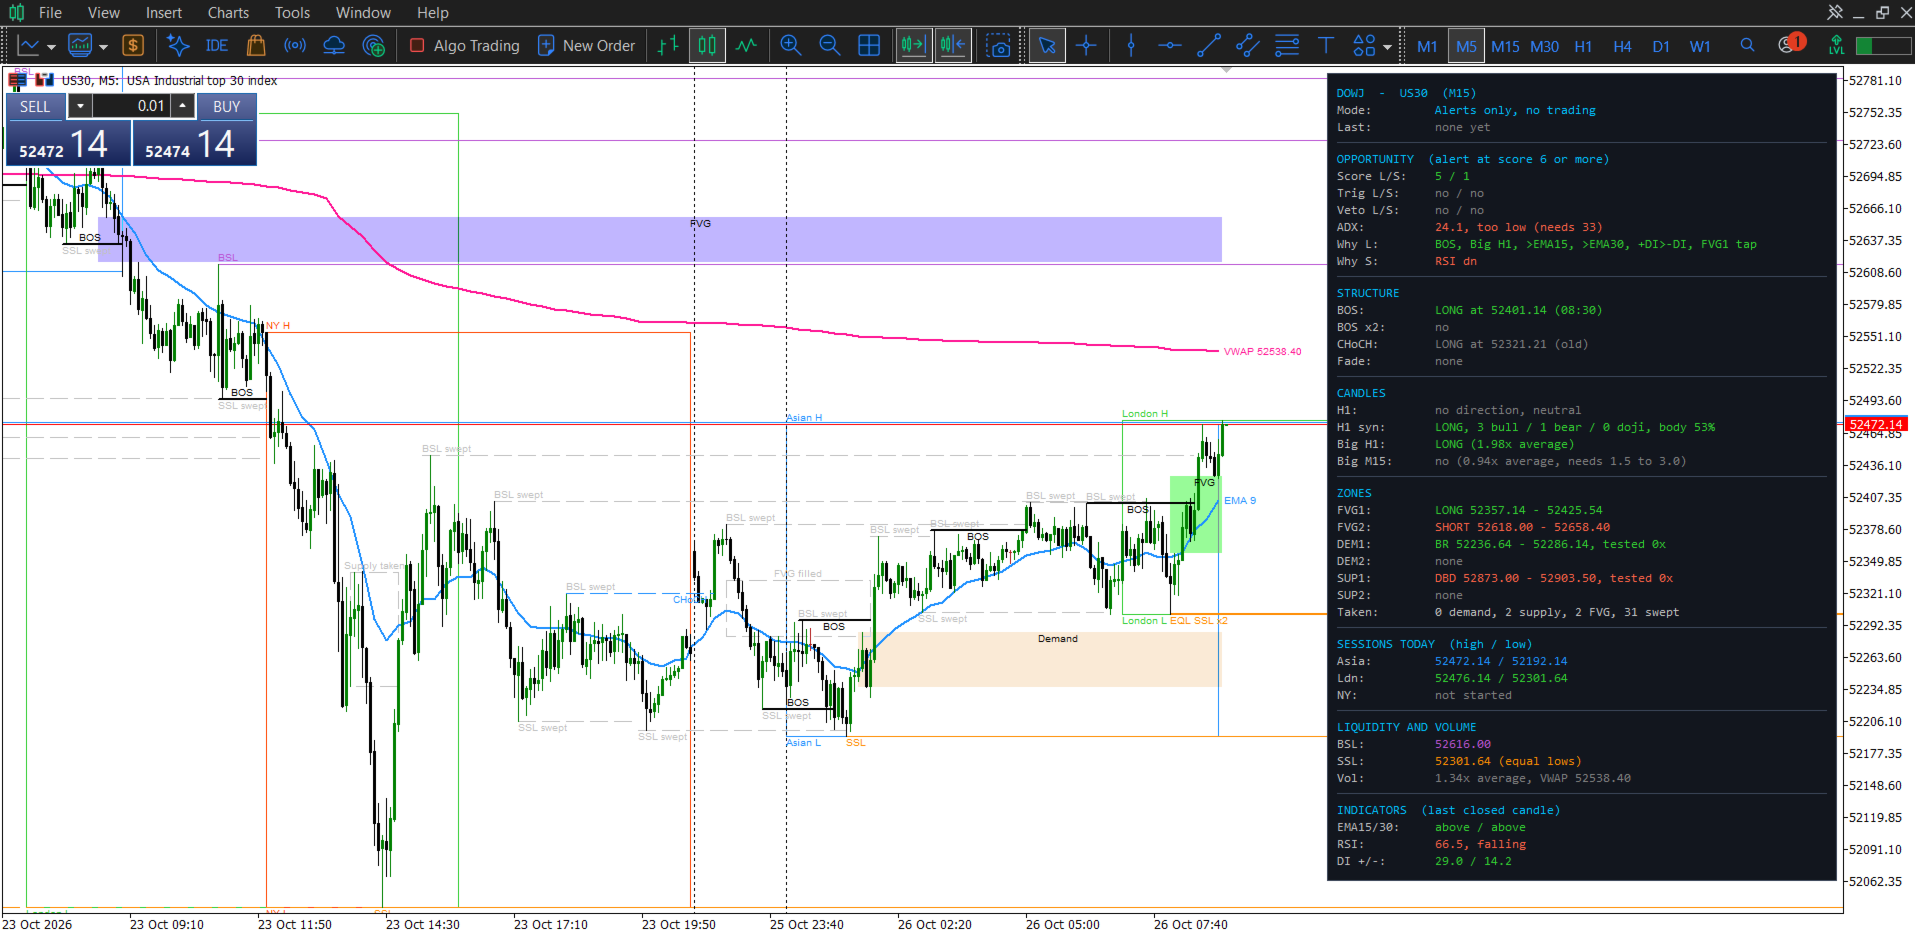
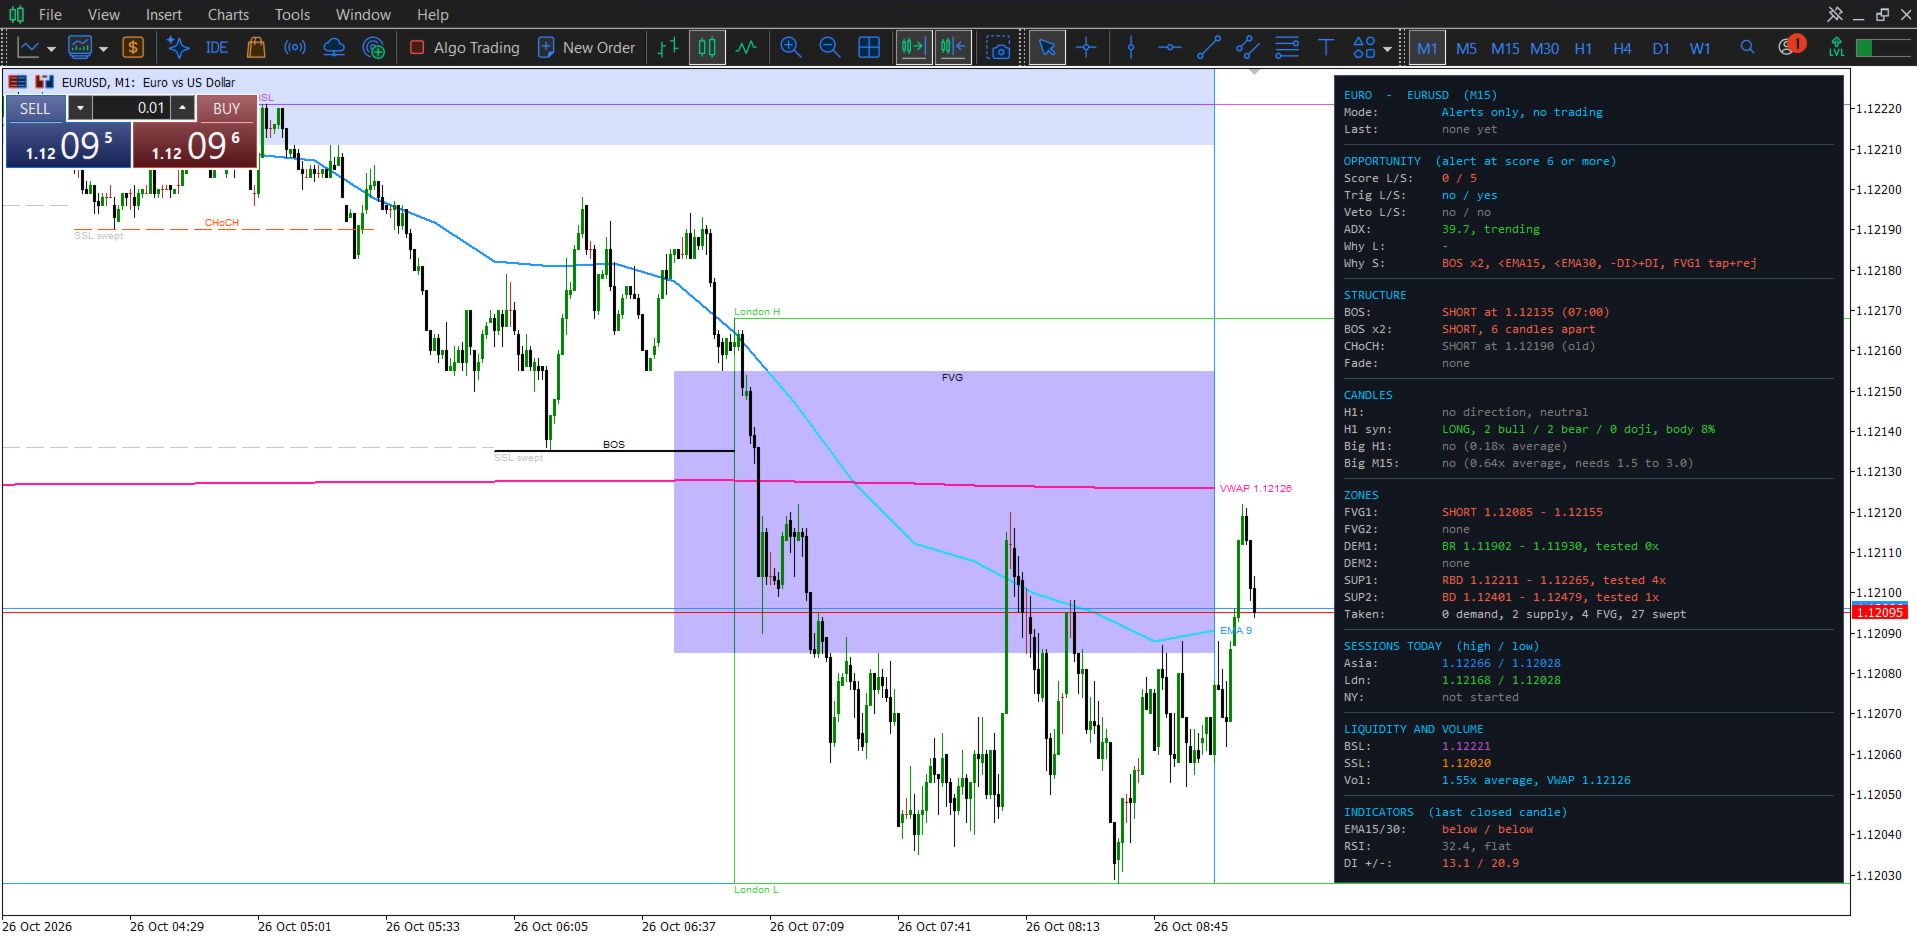
DASHBOARD
INPUT PARAMETERS
- General
Name: label used in alerts and on the dashboard
Write detailed calculation notes: writes extra notes to the Experts log (off by default).
Move labels apart so they never overlap: on by default.
- Alerts
Send OPPORTUNITY alerts: on/off.
Pop-up alert: pop-up window with sound.
Push notification: to the MT5 mobile app.
Email: to the address set in MT5.
Also alert BOS pairs / CHoCH / fade reversals / taken zones: extra structure alerts, each on/off.
- Dashboard
Show the dashboard: on/off.
Font size: 6 to 12.
Value column width: in characters. Longer text drops to the next line.
Background, border, label and title colours.
Chart text colour: for BOS and zone labels. None = the chart's foreground colour.
- Signal scoring
Score structure / H1 candles / big candles / fades / momentum / zones: each part of the score on/off.
Min score for an alert: default 6.
Min trend strength (ADX): alerts need at least this value (0 = off).
Momentum cap: the most points momentum can add (0 = no cap).
Max stretch from the EMA: skip alerts when price is too far from the EMA (0 = off).
ATR, ADX, EMA and RSI periods, RSI price and RSI slope buffer.
- Candle filters
Body average candles: how many candles make up the body size average.
Min H1 history: hours needed before the H1 average is used.
Big candle min and max size: as a multiple of the average body. The max filters news spikes.
Close zone %: a big candle must close in the top or bottom part of its range.
Fade valid hours: how long a fade warning waits for a reversal.
- Break of structure (BOS)
Enable BOS: on/off.
Timeframe: timeframe the structure is read on (default M15).
Lookback candles: how far back to search.
Swing size: candles on each side of a swing. Higher = bigger swings.
Max candles between 2 breaks: to count as a pair (0 = no limit).
Same direction only: whether both breaks of a pair must point the same way.
- Change of character (CHoCH)
Enable CHoCH: on/off.
Min BOS before a CHoCH: breaks needed in the old direction first.
Show all / newest only: which CHoCHs to draw.
Bullish and bearish colours.
- Fair value gaps (FVG)
Show FVGs: on/off.
Timeframe: timeframe the gaps are found on (default M15).
Lookback candles: how far back to search.
Merge within: nearby same-direction gaps up to this many candles apart become one FVG (0 = never).
Min candles apart: spacing between FVGs (0 = off).
Min size (ATR) and min size (points): skip small gaps (0 = off).
Show filled FVGs: keep them as grey dashed outlines.
Bullish, bearish and filled colours.
- Supply and demand zones
Show zones: on/off.
Timeframe and lookback candles.
Impulse size, base size and max base candles: what counts as a zone.
Max zone height: skip zones that are too tall (0 = off).
Leg-in candles and size: the move into the base.
Max tests: skip zones tested more often than this (-1 = no limit, 0 = fresh zones only).
Show taken zones: keep them as grey dashed outlines.
Min candles apart: spacing between zones on the same side (0 = off).
Demand, supply and taken colours.
- Sessions (broker server time)
Draw session boxes: on/off.
Earlier days too: also draw the sessions of earlier kept days.
Asian, London and New York start hour, end hour and colour.
- Liquidity levels
Show liquidity: on/off.
Timeframe, lookback candles and swing size.
Levels per side: nearest unswept levels grouped into equal highs / lows.
Equal highs / lows tolerance: as a fraction of ATR (0 = off).
Show swept levels: and their "swept" labels, each on/off.
Swept levels per scan: how many are picked up on each side.
PDH / PDL, previous week, 6-week high/low: each on/off.
- Volume and VWAP
Show volume / VWAP: on/off.
Volume band at the bottom of the chart: off by default.
Earlier days too: draw volume and VWAP for the earlier kept days.
Restart VWAP each day: off = one unbroken VWAP across the days kept.
Volume candles, average period, band height, high volume multiple, bar width.
Real volume: real volume for exchange symbols, otherwise tick volume.
Show VWAP: on/off.
Colours for normal and high volume bars, the average line and VWAP.
- EMA line
Show EMA: on/off.