Z score range boxes breakout
- Indicadores
-
Shipra Gupta
 Sou Shipra Gupta, trader e desenvolvedora de estratégias quantitativas com sólida formação em matemática, economia e sistemas de trading algorítmico. Ao longo dos anos, trabalhei amplamente nos mercados de forex, ouro, índices, commodities e criptomoedas, focando na construção de estratégias
 - Versão: 1.0
Z-Score Range Boxes Breakout
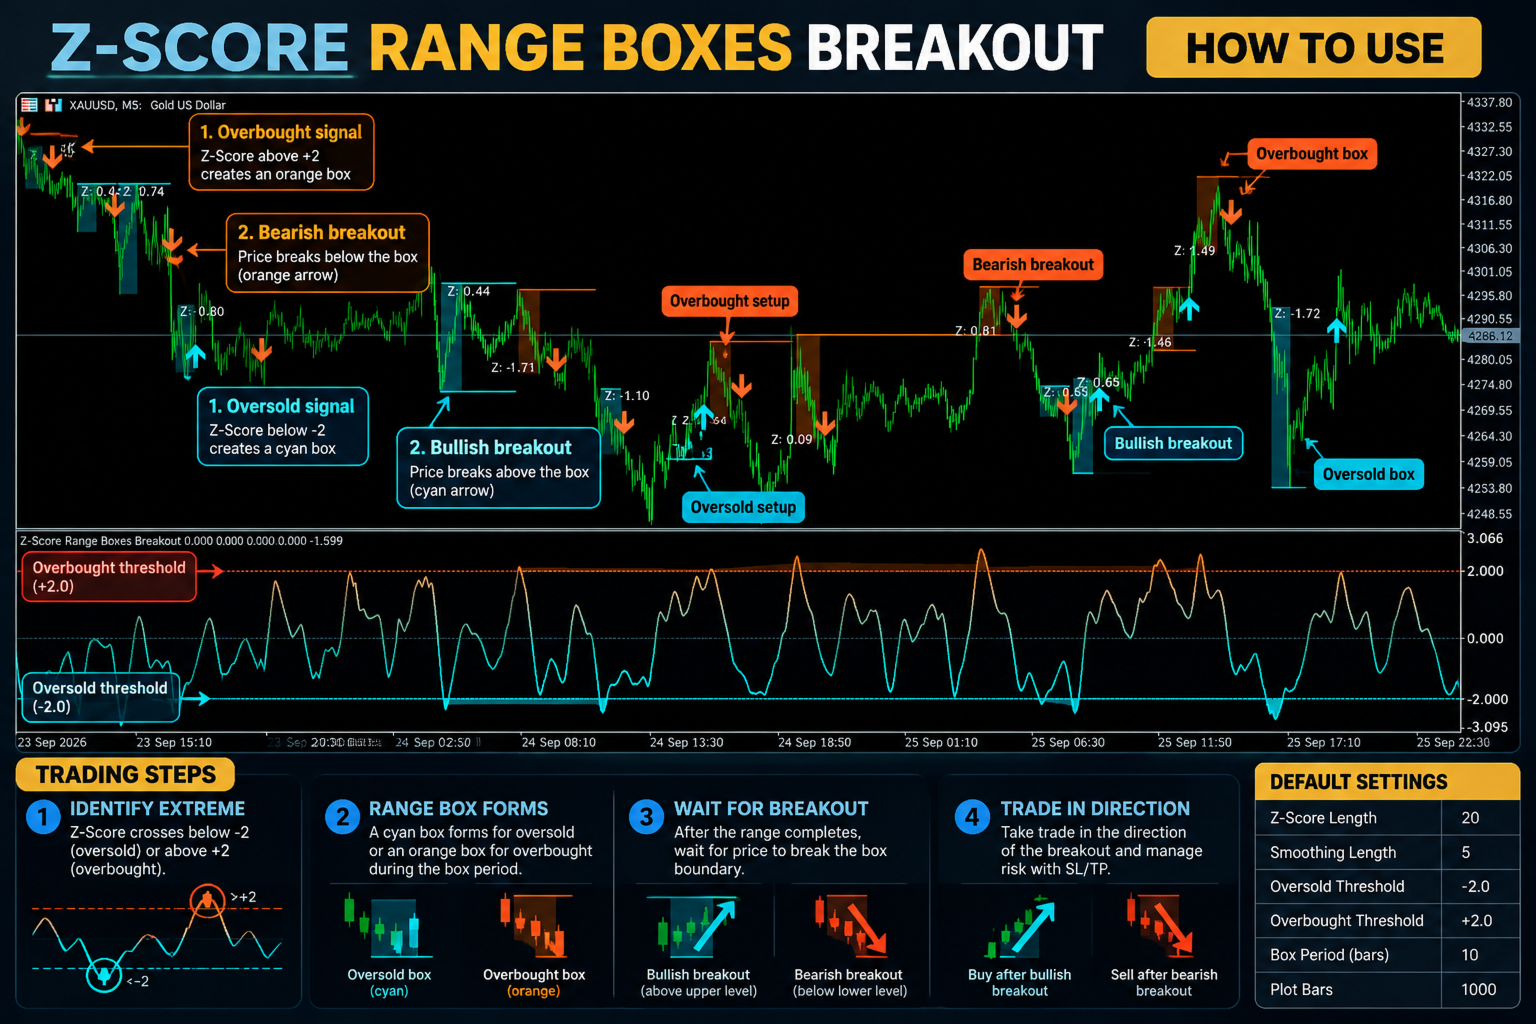
Z-Score Range Boxes Breakout is a statistical price-action indicator designed to identify potential reversal zones and subsequent breakouts using a smoothed Z-Score of price.
The indicator calculates how far the current price has moved from its recent mean relative to its standard deviation. When the smoothed Z-Score reaches statistically extreme levels, the indicator automatically creates a range box around the price action.
Key Features
-
Z-Score Analysis — Measures the current price deviation from its recent mean using standard deviation.
-
Smoothed Z-Score — Applies configurable smoothing to reduce short-term noise.
-
Oversold Zones — When the Z-Score falls below the oversold threshold, a bullish/oversold range is identified.
-
Overbought Zones — When the Z-Score rises above the overbought threshold, a bearish/overbought range is identified.
-
Dynamic Range Boxes — Each extreme zone is tracked over a configurable number of candles to establish its high and low boundaries.
-
Breakout Detection — A bullish signal is generated when price breaks above an established oversold range, while a bearish signal appears when price breaks below an overbought range.
-
Range Levels — Completed zones display upper, middle and lower reference levels that can be extended until a breakout occurs.
-
Gradient Z-Score Line — The oscillator uses a dynamic color gradient to visually represent the transition between bullish and bearish statistical extremes.
-
Main-Chart Signals — Breakout arrows and range structures are displayed directly on the price chart while the Z-Score oscillator operates in a separate window.
How It Works
The indicator first calculates the Z-Score over the selected lookback period and smooths the result. By default, values below -2.0 are treated as oversold conditions, while values above +2.0 represent overbought conditions.
When an extreme condition appears, the indicator constructs a price range using the high and low of the subsequent box period. Once the range is established, price breaking above the range's upper boundary produces a bullish breakout, while a break below the lower boundary produces a bearish breakout.
Main Inputs
| Parameter | Default | Purpose |
|---|---|---|
| Z-Score Length | 20 | Lookback period for statistical price deviation |
| Smoothing Length | 5 | Smooths the Z-Score |
| Oversold Threshold | -2.0 | Detects extreme downside conditions |
| Overbought Threshold | +2.0 | Detects extreme upside conditions |
| Box Period | 10 bars | Defines the range-building period |
| Plot Bars | 1000 | Controls the amount of historical data displayed |
Trading Concept
The indicator is designed around a simple sequence:
Statistical Extreme → Range Formation → Range Confirmation → Breakout
Oversold ranges can highlight areas where downside price expansion has become statistically extreme, while overbought ranges identify areas of statistically extended upside movement. A subsequent breakout of the established range provides the directional signal.
This makes the indicator useful for traders looking for mean-reversion zones combined with price-action breakout confirmation, rather than relying on the Z-Score extreme alone.
Note: The indicator is a technical analysis tool and does not guarantee profitable trading signals. Its signals should be evaluated alongside market structure, volatility, trend conditions and risk management.