• Visão global
  • Comentários (4)
  • Discussão (45)
  • O que há de novo

PZ Swing Trading MT5

5

Swing Trading é o primeiro indicador projetado para detectar oscilações na direção da tendência e possíveis oscilações de reversão. Ele usa a abordagem de negociação de linha de base, amplamente descrita na literatura de negociação. O indicador estuda vários vetores de preço e tempo para rastrear a direção da tendência agregada e detecta situações nas quais o mercado está sobrevendido ou sobrecomprado em excesso e pronto para corrigir.

[ Guia de instalação | Guia de atualização | Solução de problemas | FAQ | Todos os produtos ]

  • Lucro pelas oscilações do mercado sem ser destroçado
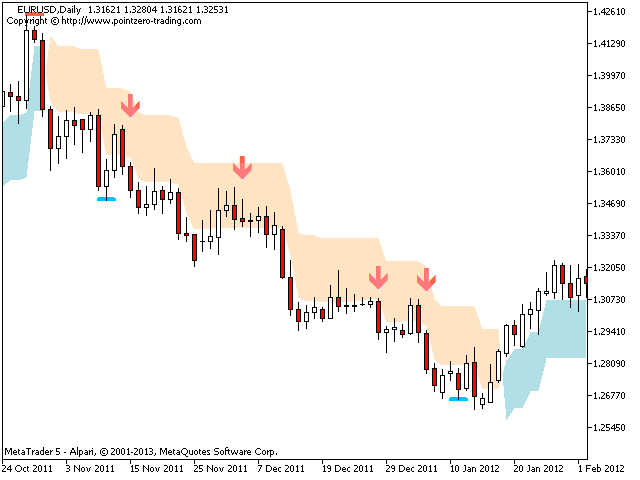
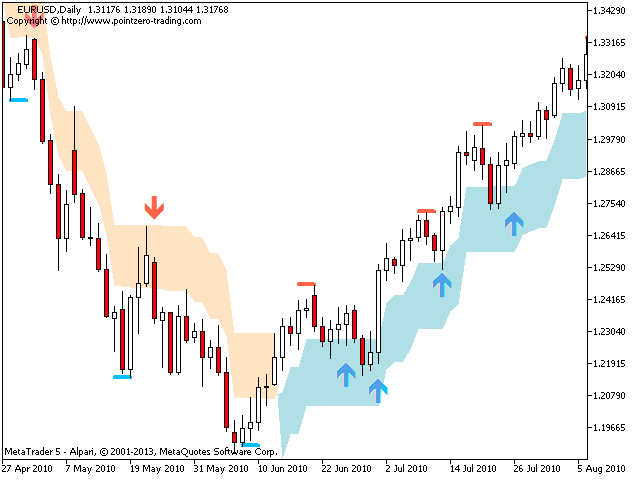
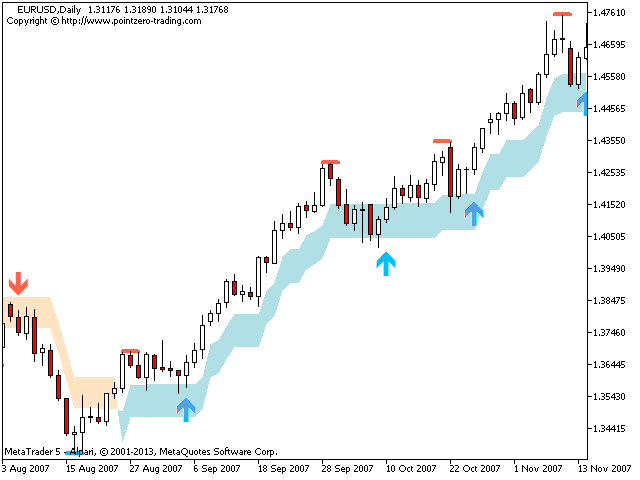
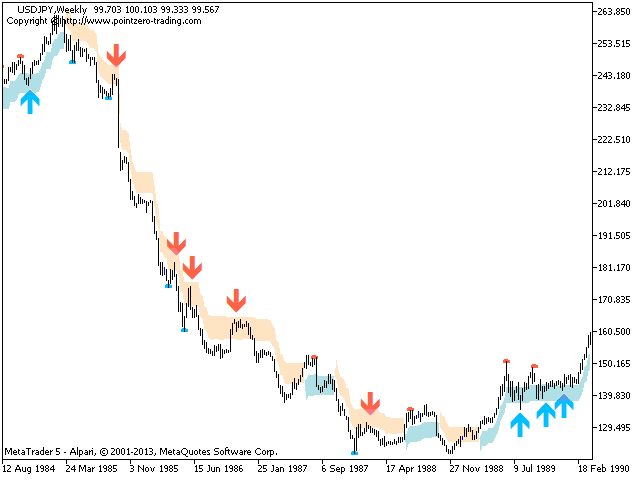
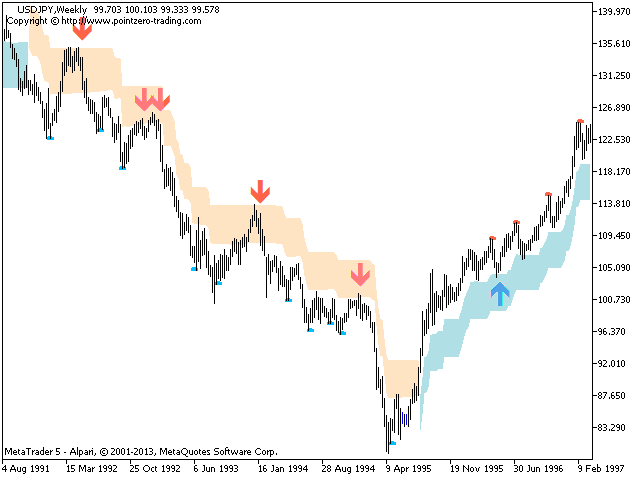
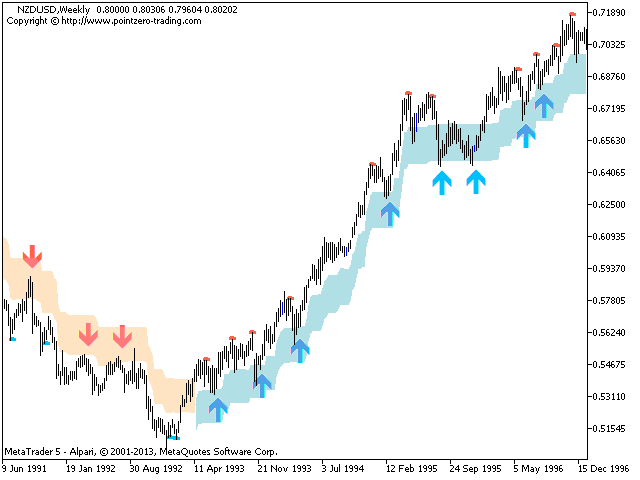
  • O indicador exibe a direção da tendência o tempo todo
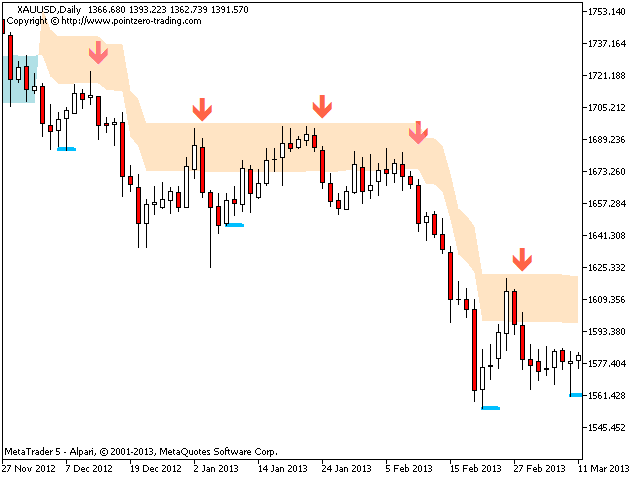
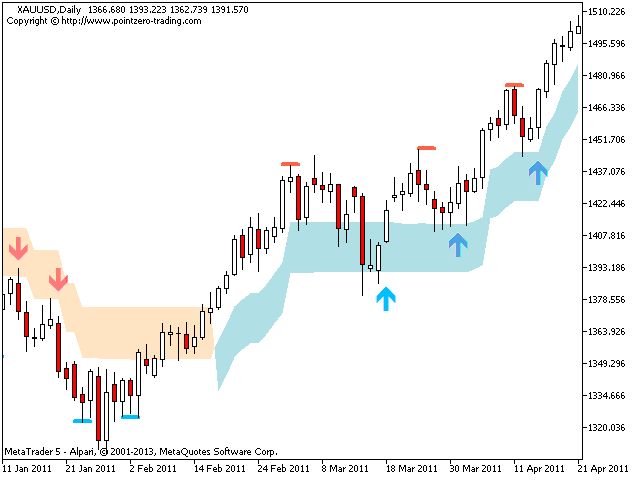
  • Uma faixa de preço colorida representa a linha de base da oportunidade
  • Traços coloridos representam possíveis oscilações de reversão
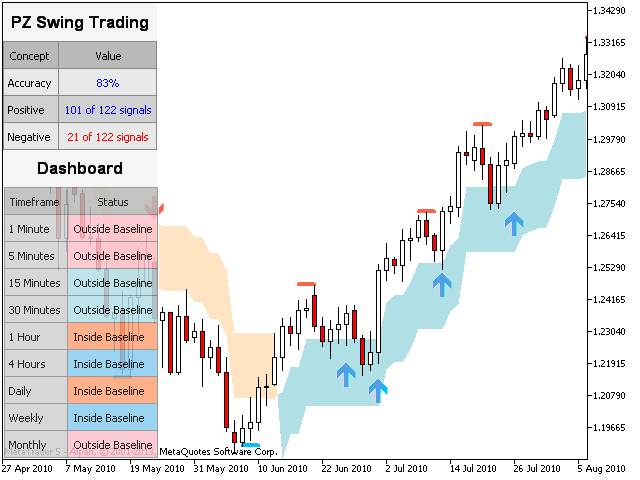
  • O indicador analisa sua própria qualidade e desempenho
  • Implementa um painel de vários períodos de tempo
  • Tendência personalizável e períodos de oscilação
  • Implementa alertas de email / som / push
  • O indicador não está repintando ou repintando

O que é Swing Trading

Swing Trading é um estilo de negociação que tenta capturar ganhos em um título dentro de um dia a uma semana, embora algumas negociações possam eventualmente ser mantidas vivas por mais tempo. Os traders de swing usam análise técnica para comprar fraqueza e força de venda, e têm paciência para esperar que essas oportunidades aconteçam, porque faz mais sentido comprar um título depois que uma onda de vendas ocorreu, em vez de ser pego em um sell-off


A linha de base da oportunidade

Muitas pesquisas sobre dados históricos provaram que os mercados adequados para negociação com oscilação tendem a negociar acima e abaixo de uma faixa de preço de linha de base, que é retratada no gráfico por uma faixa colorida, calculada usando a Faixa Média Verdadeira. A linha de base é usada pelo trader swing, cuja estratégia é comprar normalidade e vender mania ou reduzir a normalidade e cobrir a depressão. Na ausência de padrões de exaustão, o operador do balanço oscila muito na linha de base quando a ação está subindo e diminui na linha de base quando a ação está em queda.

Os traders de swing não querem atingir o home run com uma única operação, não estão preocupados com o momento perfeito para comprar uma ação exatamente no fundo e vender exatamente no topo. Em um ambiente de negociação perfeito, eles esperam que as ações atinjam sua linha de base e confirmem sua direção antes de fazerem seus movimentos.

A história fica mais complicada quando uma tendência de alta ou de alta tendência mais forte está em jogo no período atual ou mais alto: o comerciante pode paradoxalmente demorar muito quando as ações saltam abaixo da linha de base e esperar que as ações voltem a subir em uma tendência de alta ou ele pode encurtar uma ação que tenha apunhalado acima da linha de base e espere que ela caia se a tendência mais longa estiver em queda. Para esse efeito, o indicador exibe reversões como traços coloridos.


Parâmetros de entrada

  • Período de tendência - Este parâmetro controla a sensibilidade às mudanças de tendência. Um grande período de tendência levará à captura de tendências mais longas. Um pequeno período de tendência levará à captura de tendências mais curtas, mas um reconhecimento mais rápido das mudanças de tendência.
  • Período da linha de base - Este parâmetro controla a sensibilidade da linha de base. O período para a linha de base deve sempre estar abaixo do período da tendência. Aumente-o para negociar usando uma faixa de oportunidade maior e diminua-a para torná-la menor.
  • Exibir sinais de oscilação - ative esse parâmetro para exibir setas quando o preço voltar à linha de base e sair dela.
  • Exibir correções - ative esse parâmetro para exibir traços coloridos quando a tendência começar a corrigir.
  • Exibir o painel - ative esse parâmetro para ver o painel de vários períodos no gráfico.
  • Exibir estatísticas - ative esse parâmetro para exibir o painel de estatísticas no gráfico.
  • Configurações de desenho - Escolha suas próprias cores e tamanhos para setas e traços de reversão.
  • Alertas - Ative alertas de exibição / email / push / som para padrões.


Autor

Arturo López Pérez, investidor e especulador privado, engenheiro de software e fundador da Point Zero Trading Solutions.

Comentários 4
Devonish
2747
Devonish 2019.02.26 11:22 
 

I like it. I prefer it on longer time frames and as Arturo says, use an oscillator to verify signals; which will further improve the base line efficiency score (frequently in the region of 80%).

Note: This is the first review since the recent update Feb 2019.

26/04/21: Indicator has been updated. Appreciate the continued support for this product.

Ariel Agnoletto
928
Ariel Agnoletto 2014.10.31 22:26 
 

Nice! Not Dream, but real life.

Excellent work Arturo

mozola
322
mozola 2013.10.31 15:48 
 

Just because my faith and trust in Arturo, I was willing to switch to MT5 from MT4 to have Swing Trading - and it turned out, it is crazy good!! I`m still amazed of the efficiency of this piece of art, to see it`s clean surface and very accurate signals - something I`ve been looking for a long time. I`m a Price Action trader and Swing Trading fits into my environment absolutely perfectly. I paired up with PZ Oscillator and now it is more than enough for successful trading

(sure, some knowledge might be useful!) Me and my wife both love it, I wish for more similar products, so keep continue your excellent work, Arturo!

Zolie, USA

Produtos recomendados
Price Breakout pattern Scanner is the automatic scanner for traders and investors. It can detect following patterns automatically from your chart. Head and Shoulder - Common tradable pattern. Reverse Head and Shoulder - This pattern is the reverse formation of the Head and Shoulder. Double Top - When the price hits resistance level twice and decline toward the support level, the trader can anticipate sudden bearish breakout through the support level. Double Bottom - The double bottom pattern is
100 USD
Introduction to X3 Chart Pattern Scanner X3 Cherart Pattern Scanner is the non-repainting and non-lagging indicator detecting X3 chart patterns including Harmonic pattern, Elliott Wave pattern, X3 patterns, and Japanese Candlestick patterns. Historical patterns match with signal patterns. Hence, you can readily develop the solid trading strategy in your chart. More importantly, this superb pattern scanner can detect the optimal pattern of its kind. In addition, you can switch on and off individu
250 USD
PZ Trend Trading MT5
PZ TRADING SLU
3.67 (3)
O Trend Trading é um indicador projetado para lucrar o máximo possível com as tendências que ocorrem no mercado, cronometrando retrocessos e rupturas. Ele encontra oportunidades de negociação analisando o que o preço está fazendo durante as tendências estabelecidas. [ Guia de instalação | Guia de atualização | Solução de problemas | FAQ | Todos os produtos ] Negocie mercados financeiros com confiança e eficiência Lucre com as tendências estabelecidas sem ser chicoteado Reconhecer retrocesso
249 USD
All Harmonics 26
Alexey Isavnin
3.8 (5)
Harmonic patterns are characteristic series of price movements with respect to Fibonacci levels, which statistically precede price reversals. This indicator searches for harmonic patterns. It is capable of recognising 26 classical and non-classical harmonic patterns : Classical Gartley Butterfly Alternate Butterfly Bat Alternate Bat Crab Deep Crab Three Drives Non-classical Shark Alternate Shark Cypher 5-0 Anti Gartley Anti Butterfly Anti Alternate Butterfly Anti Bat Anti Alternate Bat Anti Crab
90 USD
Prices move for many reasons and these can vary from one operator to another: software, private and institutional traders simultaneously contribute to the formation of the price, making predictive art very difficult. However, there are measurable factors that bind the price to an underlying trend in line with the physical reality that the financial asset represents: these are the macroeconomic indicators. Large investors use this information wisely to set their strategies. Understanding these m
249 USD
Mean Reversion Supply Demand Indicator Mean Reversion Supply Demand is the indicator to detect the important supply demand zone in your chart. The concept of supply demand trading relies on the quantity mismatching between buying and selling volumes in the financial market. Typically, supply demand zone serves to predict the turning point. The wave pattern, for any supply demand zone to work as an successful trade, looks like the price must touch the base zone, move away and then return to zone
80 USD
KT Renko Patterns MT5
KEENBASE SOFTWARE SOLUTIONS
KT Renko Patterns scans the Renko chart brick by brick to find some famous chart patterns that are frequently used by traders across the various financial markets. Compared to the time-based charts, patterns based trading is easier and more evident on Renko charts due to their uncluttered appearance. KT Renko Patterns features multiple Renko patterns, and many of these patterns are extensively explained in the book titled Profitable Trading with Renko Charts by Prashant Shah. A 100% automate
145 USD
O nível Premium é um indicador único com mais de 80% de precisão nas previsões corretas! Este indicador foi testado pelos melhores Especialistas em Negociação por mais de dois meses! O indicador do autor você não encontrará em nenhum outro lugar! A partir das imagens você pode ver por si mesmo a precisão desta ferramenta! 1 é ótimo para negociar opções binárias com um tempo de expiração de 1 vela. 2 funciona em todos os pares de moedas, ações, commodities, criptomoedas Instruções:
1 100 USD
Fractal 358 Plus
Renato Fridschtein
Fractal 358 Plus é um indicador preditivo que oferece uma visão clara das movimentações do preços. Agregando padrões gráficos como Caixote , Pivot e Inside Candle , mostra pontos interessantes para entradas e saídas, além de mostrar ameaças às operações no mercado financeiro. Já vem configurado para o mini índice (série WIN) e basta só ajustar os parâmetros para usar com qualquer ativo e tempo gráfico.  O Fractal 358 desvenda o movimento do preço Baseada na sequência de Fibonacci, Fractal 358 é
75 USD
here is a link to back test results https://youtu.be/9BYDwS9aaqM https://youtu.be/iLxh43HV91Y However, the difficult task here for traders is to understand and select the indicator or tool that can help them with their trading plan and benefit their trading style. Traders want a tool that requires minimal effort and provides as much support as it can. There are multiple reasons for which traders need an indicator. One such reason is to determine the buy-sell signals in the market. Th
500 USD
Point Black
Ignacio Agustin Mene Franco
Black Card Pack indicator 5/1 point black It has the strategy of professional bollingers where each arrow gives you a different entry signal. It is used to operate in m1 and in d1 It is used for scalping and intraday, modified for forex markets ! suitable for all pairs modified for synthetic index markets suitable for all pairs! Ideal for volatility and jumps!
50 USD
Noize Absorption Index - is the manual trading system that measures the difference of pressure between bears forces and bulls forces. Green line - is a noize free index that showing curent situation. Zero value of index shows totally choppy/flat market.Values above zero level shows how powerfull bullish wave is and values below zero measures bearish forces.Up arrow appears on bearish market when it's ready to reverse, dn arrow appears on weak bullish market, as a result of reverse expectation.
199 USD
The indicator works for all timeframes & all styles. You can display ATR for multiple symbols & multiple timeframes one at time. Benefit: Dashboard Shows ATR Data from monthly to minute time frame across 5 different instruments (customizable) at the same time. User can select maximum of 2-time frames (customizable) to scan across 5 instruments simultaneously. ATR data helps to check volatility across different instruments & different time frames (with customizable ATR periods for individual tim
149 USD
O 123 Pattern é um dos padrões de gráficos mais populares, poderosos e flexíveis. O padrão é composto por três pontos de preço: fundo, pico ou vale e retração de Fibonacci entre 38,2% e 71,8%. Um padrão é considerado válido quando as quebras de preços além do último pico ou vale, momento em que o indicador traça uma flecha, sobe um alerta, e o comércio pode ser colocado. [ Guia de instalação | Guia de atualização | Solução de problemas | FAQ | Todos os produtos ] Sinais de negociação claros
75 USD
The Market Profile Indicator for MT5 displays the price levels and zones where increased trading activity happens. These zones with substantial forex trading activity provide the forex traders with the best entry levels, support, and resistance levels. Moreover, price levels indicate the best reversal zones. As a result, forex traders can identify BULLISH and BEARISH market trends and BUY and SELL entry points as well as the best reversal points. The indicator works well in all intraday timefram
299 USD
The   Supply and Demand Zones indicator   is one of the best tools we have ever made. This great tool automatically draws supply and demand zones, the best places for opening and closing positions. It has many advanced features such as multi timeframe zones support, displaying the width of zones, alert notifications for retouched zones, and much more. Because of market fractality, this indicator can be used for any kind of trading. Whether you are a positional, swing, or intraday trader does no
99 USD
Rainbow EA MT5
Jamal El Alama
Description : Rainbow EA MT5 is a simple Expert advisor based on   Rainbow MT5 indicator witch is based on Moving average with period 34. The indicator is incorporated in the EA, therefore, it is not required for the EA to operate, but if you wish, you can download it from   my product page . The Expert Advisor settings are as follows : Suitable for Timeframes up to H1 The parameters below can be set according to your trading rules. StopLoss ( Stop Loss in pips) TakeProfit ( Take Profit in pi
59 USD
O indicador calcula e traça automaticamente os níveis de suporte e resistência de Fibonacci - uma das ferramentas mais eficazes para análise de mercado. O cálculo usa os dados de preço médio para o período e intervalo de tempo selecionados. O mínimo e o máximo para este período são considerados o início e o fim do movimento. Os níveis de Fibonacci permitem que você veja os pontos de referência potenciais, em torno dos quais o movimento do preço pode desacelerar ou reverter, ou seja, eles são usa
30 USD
Introduction to Chart Pattern MT Chart Pattern MT is a chart pattern scanner to detect the triangle pattern, falling wedge pattern, rising wedge pattern, channel pattern and so on. Chart Pattern MT uses highly sophisticated chart pattern detection algorithm. However, we have designed it in the easy to use with intuitive user interface. Chart Pattern MT will show all the patterns in your chart in the most efficient format for your trading. You do not have to do tedious manual pattern detection an
180 USD
Cumulative delta indicator As most traders believe, the price moves under the pressure of market buying or selling. When someone redeems an offer standing in the cup, the deal is a "buy". If someone pours into the bid standing in the cup - the deal goes with the direction of "sale". The delta is the difference between purchases and sales. A cumulative delta - the difference between the cumulative sum of purchases and sales for a certain period of time. It allows you to see who is currently contr
50 USD
Cansado de traçar linhas de suporte e resistência? A Resistência de suporte é um indicador de período múltiplo que detecta e plota automaticamente linhas de suporte e resistência no gráfico com um toque muito interessante: conforme os níveis de preços são testados ao longo do tempo e sua importância aumenta, as linhas se tornam mais espessas e mais escuras. [ Guia de instalação | Guia de atualização | Solução de problemas | FAQ | Todos os produtos ] Melhore sua análise técnica da noite para o d
149 USD
Was: $249    Now: $149   Market Profile defines a number of day types that can help the trader to determine market behaviour. A key feature is the Value Area, representing the range of price action where 70% of trading took place. Understanding the Value Area can give traders valuable insight into market direction and establish the higher odds trade. It is an excellent addition to any system you may be using. Blahtech Limited presents their Market Profile indicator for the MetaTrader community.
149 USD
This EA trades an engulfing pattern in a manually input price range designed to help trade harmonic patterns like gartey,bat,butterfly ect. Cannot be backtested because only  ONE  trade is opened every time EA is attached to chart. This EA takes long trades only for bullish patterns. Trades on an engulfing pattern that close price is between the manual input price range manually input upper and lower price in which the engulfing bar can form identify a bullish harmonic pattern using another in
FREE
This indicator is the same as the popular Heiken Ashi Smoothed. The Heikin Ashi indicator for MetaTrader 5 already exists, but it has two disadvantages: It paints the candles not accurate. It's not possible to change the candle width. See also Heikin Ashi in MQL5 Code Base . In this version there are no such disadvantages.
30 USD
Your Trend Friend
Luigi Nunes Labigalini
A tendência é sua amiga! Veja a cor do indicador e faça suas operações nessa direção. Ele não repinta. Ou seja, depois que cada candle se fecha, a cor dele é definitiva e não irá se alterar. Você pode focar em movimentos mais curtos e rápidos ou tendências mais longas, basta testar o que melhor se encaixa no seu operacional de acordo com o ativo e tempo gráfico usado. Altere o parâmetro de entrada "Length" e o indicador irá se adaptar automaticamente (quanto maior ele for, maior a tendência a
99 USD
Accelerator Oscillator by Bill Williams   with the ability to fine-tune and replace the averaging algorithms of the indicator, which significantly expands the possibilities of using this oscillator in algorithmic trading and brings it closer in its properties to such an indicator as MACD. To reduce price noise, the final indicator is processed with an additional Smooth averaging.  The indicator has the ability to give alerts, send mail messages and push signals when the direction of movement
40 USD
Você, assim como eu, gosta de operar a favor da tendência? Então este indicador vai te ajudar! Rainbow Trend é um indicador de tendência, no qual utiliza várias Médias Móveis junto do gráfico. Ela mede diferentes zonas de força da tendência para diferentes prazos: muito curto, curto, médio, longo e muito longo. Cada zona tem sua cor, e é possível ter alertas sonoros quando o preço sai de uma zona e entra em outra. Sua configuração é muito simples. Se encontrou alguma falha ou tem alguma suges
30 USD
Money Mind BTC
Antonio Simon Del Vecchio
4.69 (13)
Money Mind BTC is a Bitcoin trading robot that combines three essential elements: Price Action, money management, and a customized indicator perfected over the years. Our algorithm constantly analyzes the market, makes buying or selling decisions based on conditions, and adjusts positions according to the ever-changing market dynamics. Visit my other bots and indicators In Money Mind BTC, you can choose from five different strategies , each with varying levels of risk, ranging from the most con
125.27 USD
Awesome Oscillator by Bill Williams with the ability to fine-tune and replace the averaging algorithms of the indicator, which significantly expands the possibilities of using this oscillator in algorithmic trading and brings it closer in its properties to such an indicator as the MACD. To reduce price noise, the final indicator is processed with an additional Smooth averaging. The indicator has the ability to give alerts, send mail messages and push signals when the direction of movement of th
40 USD
Os compradores deste produto também adquirem
IVISTscalp5
Vadym Zhukovskyi
5 (1)
Apresentamos a você o indicador iVISTscalp5, que não é apenas único, mas também eficaz em operações de negociação. Este indicador é baseado em dados de tempo e é o resultado de muitos anos de experiência e análise aprofundada dos mercados financeiros. O indicador iVISTscalp5 é uma excelente ferramenta para negociação manual. Conveniência, simplicidade e visualização - toda a complexidade está escondida dentro dele. Simplificamos as configurações e o uso do indicador iVISTscalp5 ao máximo. O indi
500 USD
Este é sem dúvida o indicador de reconhecimento automático de formação de preço harmônico mais completo que você pode encontrar para a MetaTrader Platform. Ele detecta 19 padrões diferentes, leva as projeções de Fibonacci tão a sério quanto você, exibe a Zona de Reversão Potencial (PRZ) e encontra níveis adequados de stop loss e take-profit. [ Guia de instalação | Guia de atualização | Solução de problemas | FAQ | Todos os produtos ] Detecta 19 formações harmônicas de preços diferentes Tr
299 USD
The Volume by Price Indicator for MetaTrader 5 features Volume Profile and Market Profile TPO (Time Price Opportunity). Get valuable insights out of currencies, equities and commodities data. Gain an edge trading financial markets. Volume and TPO histogram bar, line and metric charts. TPO letter and block marker charts including split structures. Positioning and styling options to suit the user's needs and context. Volume Profile and Market Profile TPO Point of Control (VPOC and TPOC), Imbalanc
259 USD
Description Very precise patterns to detect: entry signals as well as breakout, support and resistance reversal patterns. It points out zones in which, with a high probability, institutional orders with the potential to change the price’s direction and keep moving towards it, have been placed. Support:   We create great tools for the entire trading community. Most of them are free. If you believe in what we do  Support Us Here.   KEY LINKS:   Indicator Manual  -  All Products  How is this ind
280 USD
VTrende Pro
Andrii Diachenko
VTrende Pro - MTF indicator for trend trading with a display panel for MT5 *** Videos can be translated into any language using subtitles (video language - Russian) Although the signals of the VTrende Pro indicator can be used as signals of a full-fledged trading system, it is recommended to use them in conjunction with the Bill Williams TS. VTrende Pro is an extended version of the VTrende indicator. Difference between Pro version and VTrende: - Time zones - Signal V - signal 1-2 waves
697 USD
Apresentamos o revolucionário indicador MT5, Traffic Signal - seu portal definitivo para o mundo do trading bem-sucedido! Projetado com precisão e expertise, o Traffic Signal opera com uma estratégia especial que aproveita o poder de indicadores técnicos avançados - RSI, Stochastics, CCI e Tendências - em todos os intervalos de tempo. Prepare-se para uma experiência de trading extraordinária, pois este indicador de última geração oferece os sinais mais precisos para entrada, permitindo que você
450 USD
Weis Wave with Alert MT5
Trade The Volume Waves Single Member P.C.
4.93 (14)
Get 30% Discount until 30/9/20203 on Lifetime package 420$ from 599$. Rental/Lifetime Package Options and Privileges  * For optimum results the yearly or lifetime package is suggested due to live training and Discord  channel trading with the  creator! Rent Monthly Six Months   Yearly/Lifetime Weis Wave with Speed with Alert+Speed Index x x x Manual  x x x Quick Set up Video x x x Blog x x x Lifetime Updates x x x Setup and Training Material x x Free Rectangle Break Alert Tool      x Discord
420 USD
Mafia Spikes
Bonginkosi Innocent Khumalo
MAFIA Spikes Mafia is an indicator that is made to detect spikes before they occur , a signal will be given few minutes before a spike. An outstanding Boom & Crash strategy is coded into this indicator system to perfectly give amazing signals for spikes. When using this indicator system you gonna feel like you are a MAFIA of spikes, king of spikes.   This indicator is made for trading  Boom and Crash indices only, on a 1 minute timeframe only. Mafia Spikes can also sand signals to your smartphon
1 900 USD
"Piranha" - an autonomous trading system that determines overbought and oversold levels on the chart. Red and blue zones represent overbought and oversold levels respectively. Entry points are marked with arrows: a downward arrow in the red zone for "sell" and an upward arrow in the blue zone for "buy". The Take profit level is indicated by the green moving average. Key features: Adjusting the Take profit level as the green moving average changes position. Averaging ability when a new market e
300 USD
Little Hanzel
Bonginkosi Innocent Khumalo
Little Hanzel is  t he best spike Detector,  the  indicator is  made for trading Boom and Crash using the 1 min timeframe.It use levels on the 1 min timeframe to detect spikes.A horizontal line(order level) will appear on all the buying levels for on Boom and selling level, horizontal line will also appear on Crash. Join mql5 Little Hanzel channel  https://www.mql5.com/en/channels/littlehanzel Input section: Choose Boom for the Boom indices (Boom 1000, Boom 500,and  Boom 300 ) Choose Crash for t
1 999 USD
INTRODUCING WORLD'S FIRST MT5 "AUTO SCALE" Naveen Geometric Square with Circle To Analyze Markets Geometric Relationship. Naveen's Geometric Square  has some of the most impressive features you will ever find in Gann & Geometric Analysis world. The Naveen's Geometric Square  is a Powerful method of squaring TIME AND PRICE .It is a free-hand drawing tool giving you control of the size of the box. The internal diagonals, grid-lines and angles can be Enabled/ Disabled. All square diagonals lik
1 299 USD
Incinerat8
Paulos Ngwenya
This algorithm uses real time data to generate signals with an accuracy rate of 80%. It shows entries and where you should place both the stoploss and the take profit for each trade. It determines trend! It can even help you to become a signal provider! And it can generate up to 8 signals a day! You get access to a free forex trading community  Operates on any broker compatible to synthetic indices and forex   if you need any assistance whatsapp +2774 35 35 744 or telegram link @pipsempire01
400 USD
Volume Confluence
Mussadiq Abdul Rahim
Atenção! Antes de utilizar nosso produto, é importante ler atentamente o aviso legal em inglês. Nosso produto é projetado para fornecer informações sobre possíveis tendências do mercado e movimentos de preços. No entanto, não podemos garantir a obtenção de lucros ou resultados específicos na negociação. A negociação nos mercados financeiros envolve riscos, e não nos responsabilizamos por possíveis perdas. Todas as informações adicionais podem ser encontradas no aviso legal em inglês.
1 000 USD
EQ Cutrim Theory
Marco Aurelio Santos Costa
O Ronal Cutrim há 14 anos é um matemático dedicado e com mais de 10 anos de experiência no mercado financeiro. O conceito da teoria é simples, encontrar desequilíbrio entre compradores e vendedores. O que faz muito sentido, pois nada sobe para sempre, nada cai para sempre. Quando você encontra um ativo com probabilidade matemática de equilíbrio desequilibrado, é uma otima forma de entrar no trading, TUTORIAL  veja o video com atenção
799 USD
Seconds Charts
Aleksandr Goryachev
Micro  ******************* Секундные графики MT5 ********************** Более точного инструмента для входа в сделку вы не найдёте. Входные параметры: Timeframe, sek - период построения графика, секунды Displayed bars - отображаемые бары Step of price levels, pp, 0-off - шаг отрисовки ценовых уровней, пункты Scale points per bar, 0-off - масштаб в пунктах на бар Show lines - отображение текущих уровней Show comment - отображение комментария Standard color scheme - стандартная цветовая сх
1 500 USD
The latest most requested Binary Options arrow indicator in the Garuda Signals product line is now on MT5! Binary options signal based on multiple time frame cross over analysis. Gets confirmation from the most consistent signals known to man; Ichimoku, SMA, Bollinger Bands; and also uses the 1 Hour time frame as trend confirmation , so you don't have to open up multiple chart and waste time. - Can be used for all time frames up to 1 hour, but is most POWERFUL for 1 and 5 min options. - Place yo
300 USD
Naked Forex Kangaroo Tail Pro Indicator Kangaroo Tail Pro Indicator is a pattern recognition indicator for Forex, Stocks, Indices, Futures, Commodities and Cryptos. The Kangaroo Tail is a multi-bar pattern. The Kangaroo Tail pattern is very effective and is very simple to trade. The strategy that comes with the Kangaroo Tail is based on price action. The indicator does what it was designed for: displaying Kangaroo Tail patterns.     Don't expect to follow the up and down arrows and make
299 USD
How to use Pair Trading Station Pair Trading Station is recommended for H1 time frame and you can use it for any currency pairs. To generate buy and sell signal, follow few steps below to apply Pair Trading Station to your MetaTrader terminal. When you load Pair Trading Station on your chart, Pair Trading station will assess available historical data in your MetaTrader platforms for each currency pair. On your chart, the amount of historical data available will be displayed for each currency pai
280 USD
Smooth price for Monarch
Konstantin Gruzdev
5 (1)
The Smooth Price technical indicator is used for plotting a smoothed line as close to the price of the financial instrument as possible, and serves to eliminate its noise components. The indicator is part of the Monarch trading system, but here it is presented as an independent technical analysis tool. The indicator is based on the cluster digital filter , which, unlike the ClusterSMA , is applied directly to the price time series. Smooth Price does not redraw (except the very last, zero bar) an
999 USD
BookMap HeatMap
Roberto Spadim
1 (3)
This Indicator creates a heatmap based on depth of market of the current symbol or another symbol. Other symbol is useful when you trade futures market and a contract has 'mini' and 'full' split. For example, in Brazil (B3 - BMF&Bovespa), WDO and DOL are future Forex contract of BRL/USD (where 1 DOL = 5 WDO) and big banks work mostly with DOL (where liquidity is important). Please use with M1 timeframe , objects are too small to be displayed at higher timeframes (MT5 limit). The number of level
250 USD
Классификатор силы тренда. Показания на истории не меняет. Изменяется классификация только незакрытого бара. По идее подобен полной системе ASCTrend, сигнальный модуль которой, точнее его аппроксимация в несколько "урезанном" виде, есть в свободном доступе, а также в терминале как сигнальный индикатор SilverTrend . Точной копией системы ASCTrend не является. Работает на всех инструментах и всех временных диапазонах. Индикатор использует несколько некоррелируемых между собой алгоритмов для класси
6 250 USD
Currency Index Watcher is a simple and user-friendly tool for whoever wish to trade Forex using currencies indexes. Currency Index Watcher is configurable and usable directly from the panel. Indexes of 8 custom currencies EUR, USD, GBP, JPY, CHF, AUD, CAD, NZD (default) Any 3-chars symbol from your market watch could be used (BTC = bitcoin, RUB = ruble, CNH = yuan etc ...) : double click the symbol label  Ability to select which currencies and made-of pairs will be analyzed : check/uncheck want
360 USD
SmartTrendMt5
Andrey Spiridonov
The SmartTrendMt5 trend indicator generates signals based on the principle of combined analysis of calculated reference points within the Keltner channel. The indicator plots the Keltner channel in a separate window (by default, red lines and a blue line - the middle of the channel), and also draws the histogram of calculated reference points for each candle (by default, the histogram bars are yellow). The should be attached to a chart of any timeframe and any trading symbol in the usual way.
450 USD
If there is only one MT5 indicator you ever buy for trading forex – this has to be it. Your success as a forex trader depends on being able to identify when a currency or currency pair is oversold or overbought. If it is strong or weak. It is this concept which lies at the heart of forex trading. Without the Quantum Currency Strength indicator, it is almost impossible. There are simply too many currencies and too many pairs to do this quickly and easily yourself. You need help! The Quantum C
279 USD
Forex Relative Performance indicator This indicator calculates the relative strength of major currencies against the US dollar. The basic idea behind this indicator is "to buy strong currency and to sell weak currency". This indicator allows you to quickly identify the best forex pair to trade according to your trading style (Intraday, Scalping, Swing, or Long Term)
324 USD
SuavizadorDePrecio
Cesar Juan Flores Navarro
Funciona identificando picos de máximos y mínimos, para luego eliminarlos haciendo una linea o curva, pudiendo el usuario ingresar el valor de que tanto puede suavizar. Nos facilita poder ver la tendencia así como ver el cruce que puede hacer con otros indicadores, mostrando a simple vista los inicios y salidas de una tendencia u operación. Así también facilita la visualización de subidas y bajadas.
300 USD
Pendiente de Precio
Cesar Juan Flores Navarro
Indicador en base a la pendiente de la linea de precio, dibuja una línea de color cuando sube a base de los precios que previamente has sido procesados o linealizados, y cuando baja la pendiente la linea linealizada toma otro color. En este caso se a considerado 6 lineas de diferentes procesos desde pendientes largas hacia las cortas, observándose que cuando coincidan las pendientes se produce un máximo o mínimo, lo que a simple vista nos permitirá hacer una COMPRA O VENTA.
1 000 USD
WanaScalper
Isaac Wanasolo
1 (1)
A scalping indicator based on mathematical patterns, which on average gives signals with relatively small SL, and also occasionally helps to catch big moves in the markets (more information in the video) This indicator has three main types of notifications: The first type warns of a possible/upcoming signal on the next bar The second type indicates the presence of a ready signal to enter the market/open a position The third type is for SL and TP levels - you will be notified every time price r
1 350 USD
Индикатор Coefficient Of Determination (COD) представляет собой значение коэффициента детерминации или квадрат коэффициента корреляции между зависимой переменной — ценой и объясняющей переменной — тиковым объемом. Что это дает нам на практике? COD отлично распознает кульминацию трендовых движений, что позволяет подбирать оптимальные точки и ловить развороты рынка. Как использовать индикатор: Наиболее популярная торговая стратегия строится совместно с трендовым индикатором Moving Average (MA), пе
600 USD
Fibonacci Multiple 12
Cesar Juan Flores Navarro
Fibonacci Múltiple 12, utiliza la serie fibonacci plasmado en el indicador fibonacci, aumentadolo 12 veces según su secuencia. El indicador fibonacci normalmente muestra una vez, el presente indicador se mostrara 12 veces empezando el numero que le indique siguiendo la secuencia. Se puede utilizar para ver la tendencia en periodos cortos y largos, de minutos a meses, solo aumentado el numero MULTIPLICA.
1 000 USD
Mais do autor
Este é sem dúvida o indicador de reconhecimento automático de formação de preço harmônico mais completo que você pode encontrar para a MetaTrader Platform. Ele detecta 19 padrões diferentes, leva as projeções de Fibonacci tão a sério quanto você, exibe a Zona de Reversão Potencial (PRZ) e encontra níveis adequados de stop loss e take-profit. [ Guia de instalação | Guia de atualização | Solução de problemas | FAQ | Todos os produtos ] Detecta 19 formações harmônicas de preços diferentes Tr
299 USD
Cansado de traçar linhas de suporte e resistência? A Resistência de suporte é um indicador de período múltiplo que detecta e plota automaticamente linhas de suporte e resistência no gráfico com um toque muito interessante: conforme os níveis de preços são testados ao longo do tempo e sua importância aumenta, as linhas se tornam mais espessas e mais escuras. [ Guia de instalação | Guia de atualização | Solução de problemas | FAQ | Todos os produtos ] Melhore sua análise técnica da noite para o d
149 USD
PZ ABCD Retracement
PZ TRADING SLU
4 (5)
Este indicador encontra os padrões de retração AB = CD. O padrão AB = CD Retracement é uma estrutura de preço de 4 pontos em que o segmento de preço inicial é parcialmente retraído e seguido por um movimento equidistante da conclusão da retirada, e é a base básica para todos os padrões harmônicos. [ Guia de instalação | Guia de atualização | Solução de problemas | FAQ | Todos os produtos ] Tamanhos de padrão personalizáveis Proporções AC e BD personalizáveis Períodos de interrupção person
75 USD
PZ Goldfinch Scalper EA MT5
PZ TRADING SLU
3.54 (37)
Esta é a iteração mais recente do meu famoso scalper, Goldfinch EA, publicado pela primeira vez há quase uma década. Ele amplia o mercado em expansões súbitas de volatilidade que ocorrem em curtos períodos de tempo: assume e tenta capitalizar a inércia no movimento dos preços após uma súbita aceleração dos preços. Esta nova versão foi simplificada para permitir que o profissional use o recurso de otimização do testador facilmente para encontrar os melhores parâmetros de negociação. [ Guia de ins
FREE
Este indicador reconhece mais de 30 padrões de candlestick japoneses e os destaca maravilhosamente no gráfico. É simplesmente um daqueles indicadores que os operadores de ação de preços não podem viver sem. Melhore sua análise técnica da noite para o dia Detectar padrões de velas japonesas facilmente Negocie padrões de reversão confiáveis e universais Entre nas tendências estabelecidas com segurança usando padrões de continuação O indicador não repinta e implementa alertas O indicador implement
99 USD
PZ Reversal Fractals MT5
PZ TRADING SLU
4.48 (31)
This is the latest iteration of my famous indicator, Reversal Fractals, published for the first time almost a decade ago. It examines the price structure of fractals to determine possible reversal points in the market, providing timing to positional traders that already have a fundamental or technical valuation model. [ Installation Guide | Update Guide | Troubleshooting | FAQ | All Products ] Reversal fractals can start long trends The indicator is non repainting It implements alerts of all k
FREE
PZ Harmonacci Patterns
PZ TRADING SLU
3.43 (7)
Este é sem dúvida o indicador de reconhecimento automático de formação de preço harmônico mais completo que você pode encontrar para a MetaTrader Platform. Ele detecta 19 padrões diferentes, leva as projeções de Fibonacci tão a sério quanto você, exibe a Zona de Reversão Potencial (PRZ) e encontra níveis adequados de stop loss e take-profit. [ Guia de instalação | Guia de atualização | Solução de problemas | FAQ | Todos os produtos ] Detecta 19 formações harmônicas de preços diferentes Tr
299 USD
PZ Goldfinch Scalper EA
PZ TRADING SLU
2.63 (41)
Esta é a iteração mais recente do meu famoso scalper, Goldfinch EA, publicado pela primeira vez há quase uma década. Ele amplia o mercado em expansões súbitas de volatilidade que ocorrem em curtos períodos de tempo: assume e tenta capitalizar a inércia no movimento dos preços após uma súbita aceleração dos preços. Esta nova versão foi simplificada para permitir que o profissional use o recurso de otimização do testador facilmente para encontrar os melhores parâmetros de negociação. [ Guia de ins
FREE
PZ Trend Trading
PZ TRADING SLU
4.75 (4)
O Trend Trading é um indicador projetado para lucrar o máximo possível com as tendências que ocorrem no mercado, cronometrando retrocessos e rupturas. Ele encontra oportunidades de negociação analisando o que o preço está fazendo durante as tendências estabelecidas. [ Guia de instalação | Guia de atualização | Solução de problemas | FAQ | Todos os produtos ] Negocie mercados financeiros com confiança e eficiência Lucre com as tendências estabelecidas sem ser chicoteado Reconhecer retrocesso
249 USD
PZ Pivot Points MT5
PZ TRADING SLU
4.95 (21)
This indicator displays pivot points in the chart, including historical vales, and supports many calculation modes for Pivot Points and S/R levels. [ Installation Guide | Update Guide | Troubleshooting | FAQ | All Products ] It plots historical levels for backtesting purposes It allows you to select the reference timeframe It implements different Pivot Point calculation modes It implements different SR calculation modes It implements customizable colors and sizes Calculation Modes The indi
FREE
PZ Trendlines MT5
PZ TRADING SLU
4.8 (5)
Tired of plotting trendlines? The PZ TrendLines MT5 indicator applies a mechanical approach to the construction of trend lines for you!  [ Installation Guide | Update Guide | Troubleshooting | FAQ | All Products ] It can draw up to 18 trendlines Trendlines can be optionally based on fractals Each line represents a breakout level Each trendline can be broken or rejected Configurable amount of lines Configurable colors Support I am happy to provide free products but given my limited time, they com
FREE
PZ Binary Options MT5
PZ TRADING SLU
4.25 (12)
This indicator analyzes price action patterns and helps you to make positive equity decisions in the binary options market. [ Installation Guide | Update Guide | Troubleshooting | FAQ | All Products ] Easy to trade Trade both call and put options No crystal ball and no predictions The indicator is non-repainting The only strategy suitable for binary options is applying a mathematical approach, like professional gamblers do. It is based on the following principles: Every binary option represents
FREE
PZ Trend Trading MT5
PZ TRADING SLU
3.67 (3)
O Trend Trading é um indicador projetado para lucrar o máximo possível com as tendências que ocorrem no mercado, cronometrando retrocessos e rupturas. Ele encontra oportunidades de negociação analisando o que o preço está fazendo durante as tendências estabelecidas. [ Guia de instalação | Guia de atualização | Solução de problemas | FAQ | Todos os produtos ] Negocie mercados financeiros com confiança e eficiência Lucre com as tendências estabelecidas sem ser chicoteado Reconhecer retrocesso
249 USD
PZ Turtle Trading MT5
PZ TRADING SLU
4.43 (7)
The Turtle Trading Indicator implements the original Dennis Richards and Bill Eckhart trading system, commonly known as The Turtle Trader. This trend following system relies on breakouts of historical highs and lows to take and close trades: it is the complete opposite to the "buy low and sell high" approach. The main rule is "Trade an N-day breakout and take profits when an M-day high or low is breached (N must me above M)".  [ Installation Guide | Update Guide | Troubleshooting | FAQ | All Pr
FREE
PZ Inside Bars MT5
PZ TRADING SLU
4.56 (9)
This indicator detects inside bars of several ranges, making it very easy for price action traders to spot and act on inside bar breakouts. [ Installation Guide | Update Guide | Troubleshooting | FAQ | All Products ] Easy to use and understand Customizable color selections The indicator implements visual/mail/push/sound alerts The indicator does not repaint or backpaint An inside bar is a bar or series of bars which is/are completely contained within the range of the preceding bar. A blue box is
FREE
PZ Trendlines
PZ TRADING SLU
4.6 (10)
Tired of plotting trendlines? The PZ TrendLines indicator applies a mechanical approach to the construction of trend lines for you!  [ Installation Guide | Update Guide | Troubleshooting | FAQ | All Products ] It can draw up to 18 trendlines Trendlines can be optionally based on fractals Each line represents a breakout level Each trendline can be broken or rejected Configurable amount of lines Configurable colors Support I am happy to provide free products but given my limited time, they come
FREE
PZ Market Profile
PZ TRADING SLU
4.2 (10)
The market profile indicator provides with an X-Ray vision into market activity, outlining the most important price levels, value area and control value of the daily trading session. [ Installation Guide | Update Guide | Troubleshooting | FAQ | All Products ] Easy to understand and use Understand market dynamics easily Automatic timeframe selection Identify zones of trading value and discard others It is useful in all market conditions Effective for any trading strategy It implements three color
FREE
PZ Day Trading
PZ TRADING SLU
3.67 (3)
Este indicador detecta reversões de preços em zigue-zague, usando apenas análise de ação de preços e um canal donchiano. Ele foi projetado especificamente para negociações de curto prazo, sem repintar ou retroceder. É uma ferramenta fantástica para traders astutos, com o objetivo de aumentar o tempo de suas operações. [ Guia de instalação | Guia de atualização | Solução de problemas | FAQ | Todos os produtos ] Surpreendentemente fácil de negociar Fornece valor em cada período de tempo Imple
249 USD
PZ Day Trading MT5
PZ TRADING SLU
2.6 (5)
Este indicador detecta reversões de preços em zigue-zague, usando apenas análise de ação de preços e um canal donchiano. Ele foi projetado especificamente para negociações de curto prazo, sem repintar ou retroceder. É uma ferramenta fantástica para traders astutos, com o objetivo de aumentar o tempo de suas operações. [ Guia de instalação | Guia de atualização | Solução de problemas | FAQ | Todos os produtos ] Surpreendentemente fácil de negociar Fornece valor em cada período de tempo Imple
249 USD
PZ Support Resistance
PZ TRADING SLU
3.33 (3)
Cansado de traçar linhas de suporte e resistência? A Resistência de suporte é um indicador de período múltiplo que detecta e plota automaticamente linhas de suporte e resistência no gráfico com um toque muito interessante: conforme os níveis de preços são testados ao longo do tempo e sua importância aumenta, as linhas se tornam mais espessas e mais escuras. [ Guia de instalação | Guia de atualização | Solução de problemas | FAQ | Todos os produtos ] Melhore sua análise técnica da noite para o d
149 USD
PZ Chart Overlay MT5
PZ TRADING SLU
4.5 (2)
O indicador Overlay do gráfico exibe a ação do preço de vários instrumentos no mesmo gráfico, permitindo avaliar como os pares de moedas diferem entre si. [ Guia de instalação | Guia de atualização | Solução de problemas | FAQ | Todos os produtos ] Encontre pares de moedas sobrecomprados ou sobrevendidos facilmente Plote até seis pares de moedas sobrepostos no mesmo gráfico Exibir símbolos invertidos, se necessário Adapte-se ao tamanho, zoom e prazo do gráfico Cálculo automático do nível de
49 USD
PZ Swing Trading
PZ TRADING SLU
5 (4)
Swing Trading é o primeiro indicador projetado para detectar oscilações na direção da tendência e possíveis oscilações de reversão. Ele usa a abordagem de negociação de linha de base, amplamente descrita na literatura de negociação. O indicador estuda vários vetores de preço e tempo para rastrear a direção da tendência agregada e detecta situações nas quais o mercado está sobrevendido ou sobrecomprado em excesso e pronto para corrigir. [ Guia de instalação | Guia de atualização | Solução de prob
249 USD
PZ Three Drives
PZ TRADING SLU
4 (3)
This indicator finds Three Drives patterns. The Three Drives pattern is a 6-point reversal pattern characterised by a series of higher highs or lower lows that complete at a 127% or 161.8% Fibonacci extension. It signals that the market is exhausted and a reversal can happen. [ Installation Guide | Update Guide | Troubleshooting | FAQ | All Products ] Customizable pattern sizes Customizable colors and sizes Customizable breakout periods Customizable 1-2-3 and 0-A-B ratios It implements visua
FREE
PZ Sandwich Bars MT5
PZ TRADING SLU
5 (2)
This indicator detects Sandwich Bars of several ranges, an extremely reliable breakout pattern. A sandwich setup consists on a single bar that engulfs several past bars, breaking and rejecting the complete price range. [ Installation Guide | Update Guide | Troubleshooting | FAQ | All Products ] Easy and effective usage Customizable bar ranges Customizable color selections The indicator implements visual/mail/push/sound alerts The indicator does not repaint or backpaint The indicator could not b
FREE
PZ Binary Options
PZ TRADING SLU
4 (2)
This indicator analyzes price action patterns and helps you to make positive equity decisions in the binary options market. [ Installation Guide | Update Guide | Troubleshooting | FAQ | All Products ] Easy to trade Trade both call and put options No crystal ball and no predictions The indicator is non-repainting The only strategy suitable for binary options is applying a mathematical approach, like professional gamblers do. It is based on the following principles: Every binary option represents
FREE
Wolfe Waves são padrões de negociação naturais presentes em todos os mercados financeiros e representam uma luta por um preço de equilíbrio. Esses padrões podem se desenvolver em prazos de curto e longo prazo e são um dos padrões de reversão preditiva mais confiáveis existentes, normalmente precedendo movimentos de preços fortes e longos. [ Guia de instalação | Guia de atualização | Solução de problemas | FAQ | Todos os produtos ] Sinais de negociação claros Surpreendentemente fácil de negociar
249 USD
PZ Pivot Points
PZ TRADING SLU
4.62 (13)
This indicator displays pivot points in the chart, including historical vales, and supports many calculation modes for Pivot Points and S/R levels.  [ Installation Guide | Update Guide | Troubleshooting | FAQ | All Products ] It plots historical levels for backtesting purposes It allows you to select the reference timeframe It implements different Pivot Point calculation modes It implements different SR calculation modes It implements customizable colors and sizes Calculation Modes The indi
FREE
PZ Turtle Trading
PZ TRADING SLU
3.77 (13)
The Turtle Trading Indicator implements the original Dennis Richards and Bill Eckhart trading system, commonly known as The Turtle Trader. This trend following system relies on breakouts of historical highs and lows to take and close trades: it is the complete opposite to the "buy low and sell high" approach. The main rule is "Trade an N-day breakout and take profits when an M-day high or low is breached (N must me above M)". [ Installation Guide | Update Guide | Troubleshooting | FAQ | All Prod
FREE
Esse consultor especialista implementa o sistema de negociação Dennis e Eckhardt original, comumente conhecido como The Turtle Trader. É negociado exatamente como as tartarugas originais, e pode ser usado por traders experientes para capturar tendências nos mercados de alta ou baixa. [ Guia de instalação | Guia de atualização | Solução de problemas | FAQ | Todos os produtos ] Fácil de usar e supervisionar Configurações de estratégia totalmente configuráveis Configurações de negociação totalment
49 USD
PZ Oscillator MT5
PZ TRADING SLU
4 (7)
O Pz Oscillator é um acelerômetro muito suave e sensível que fornece uma série de informações úteis e detecta automaticamente as divergências . É uma grande confirmação de negociação e pode ser usado para identificar a direção e força da tendência. Ele foi projetado como um complemento para as nossas ferramentas de negociação. Direção de tendência O oscilador plota duas médias móveis para mostrar a direção da tendência. Se a média móvel rápida está acima da média móvel lenta, o mercado está em
FREE
Filtro:
Devonish
2747
Devonish 2019.02.26 11:22 
 

I like it. I prefer it on longer time frames and as Arturo says, use an oscillator to verify signals; which will further improve the base line efficiency score (frequently in the region of 80%).

Note: This is the first review since the recent update Feb 2019.

26/04/21: Indicator has been updated. Appreciate the continued support for this product.

laugrozav
31
laugrozav 2016.06.13 19:19 
 

O usuário não deixou nenhum comentário para sua avaliação

Ariel Agnoletto
928
Ariel Agnoletto 2014.10.31 22:26 
 

Nice! Not Dream, but real life.

Excellent work Arturo

mozola
322
mozola 2013.10.31 15:48 
 

Just because my faith and trust in Arturo, I was willing to switch to MT5 from MT4 to have Swing Trading - and it turned out, it is crazy good!! I`m still amazed of the efficiency of this piece of art, to see it`s clean surface and very accurate signals - something I`ve been looking for a long time. I`m a Price Action trader and Swing Trading fits into my environment absolutely perfectly. I paired up with PZ Oscillator and now it is more than enough for successful trading

(sure, some knowledge might be useful!) Me and my wife both love it, I wish for more similar products, so keep continue your excellent work, Arturo!

Zolie, USA

Responder ao comentário
Versão 6.2 2021.04.27
- Minor changes
Versão 6.0 2021.04.26
- Improved display
- Improved arrows
Versão 4.0 2019.02.18
- Added stats
- Added dashboard
- Added alerts
Versão 1.1 2013.10.14
Important recursion bug fix.