• Visão global
  • Comentários (3)
  • Discussão
  • O que há de novo

Colored Dynamic Momentum Index DMI

5
Se você é (ou foi) um fã do indicador RSI, vai adorar o indicador Dynamic Momentum Index de Tushar Chande, que, em termos simples, é um RSI de comprimento variável dinâmico, tornando-o mais poderoso. O indicador DMI usa internamente um número variável de barras em seus cálculos, levando em consideração os níveis de volatilidade do mercado atual que você está analisando. Dessa forma, o indicador DMI usará mais barras conforme a volatilidade diminui e menos barras quando a volatilidade aumenta, proporcionando uma análise mais poderosa sobre as etapas de Sobrecompra e Sobrevenda do ativo sendo analisado.

Se você deseja se aprofundar mais neste assunto, por favor, leia o livro "The New Technical Trader" de Tushar Chande & Stanley Kroll, da Wiley Finance.


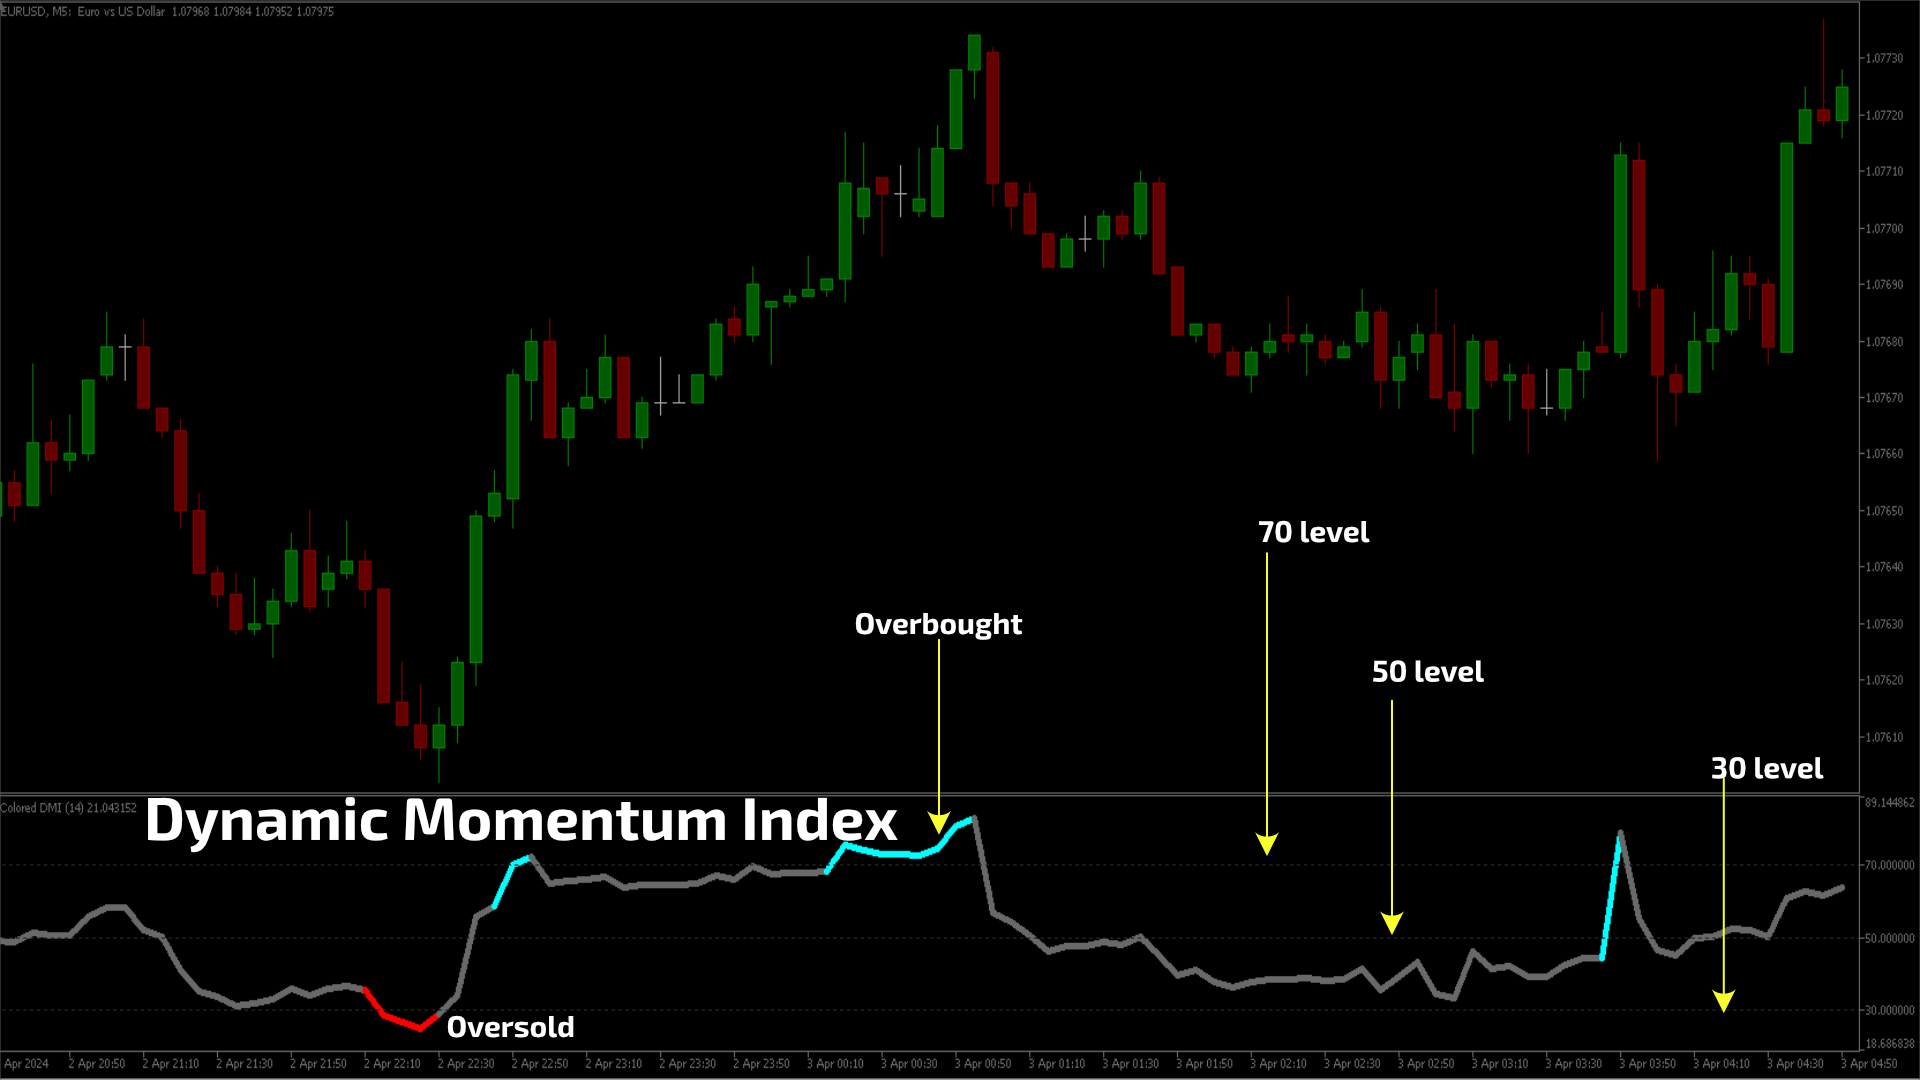
Como "LER" o Colored Dynamic Momentum Index (DMI)

  • Leia como um indicador RSI, com níveis tradicionais definidos em 30 e 70. Claro, ajustar as configurações lhe dará mais precisão na análise do seu ativo favorito. Então, experimente!
  • Leituras abaixo de 30 indicam um estado de Sobrevenda, e acima de 70, um estado de Sobrecompra.
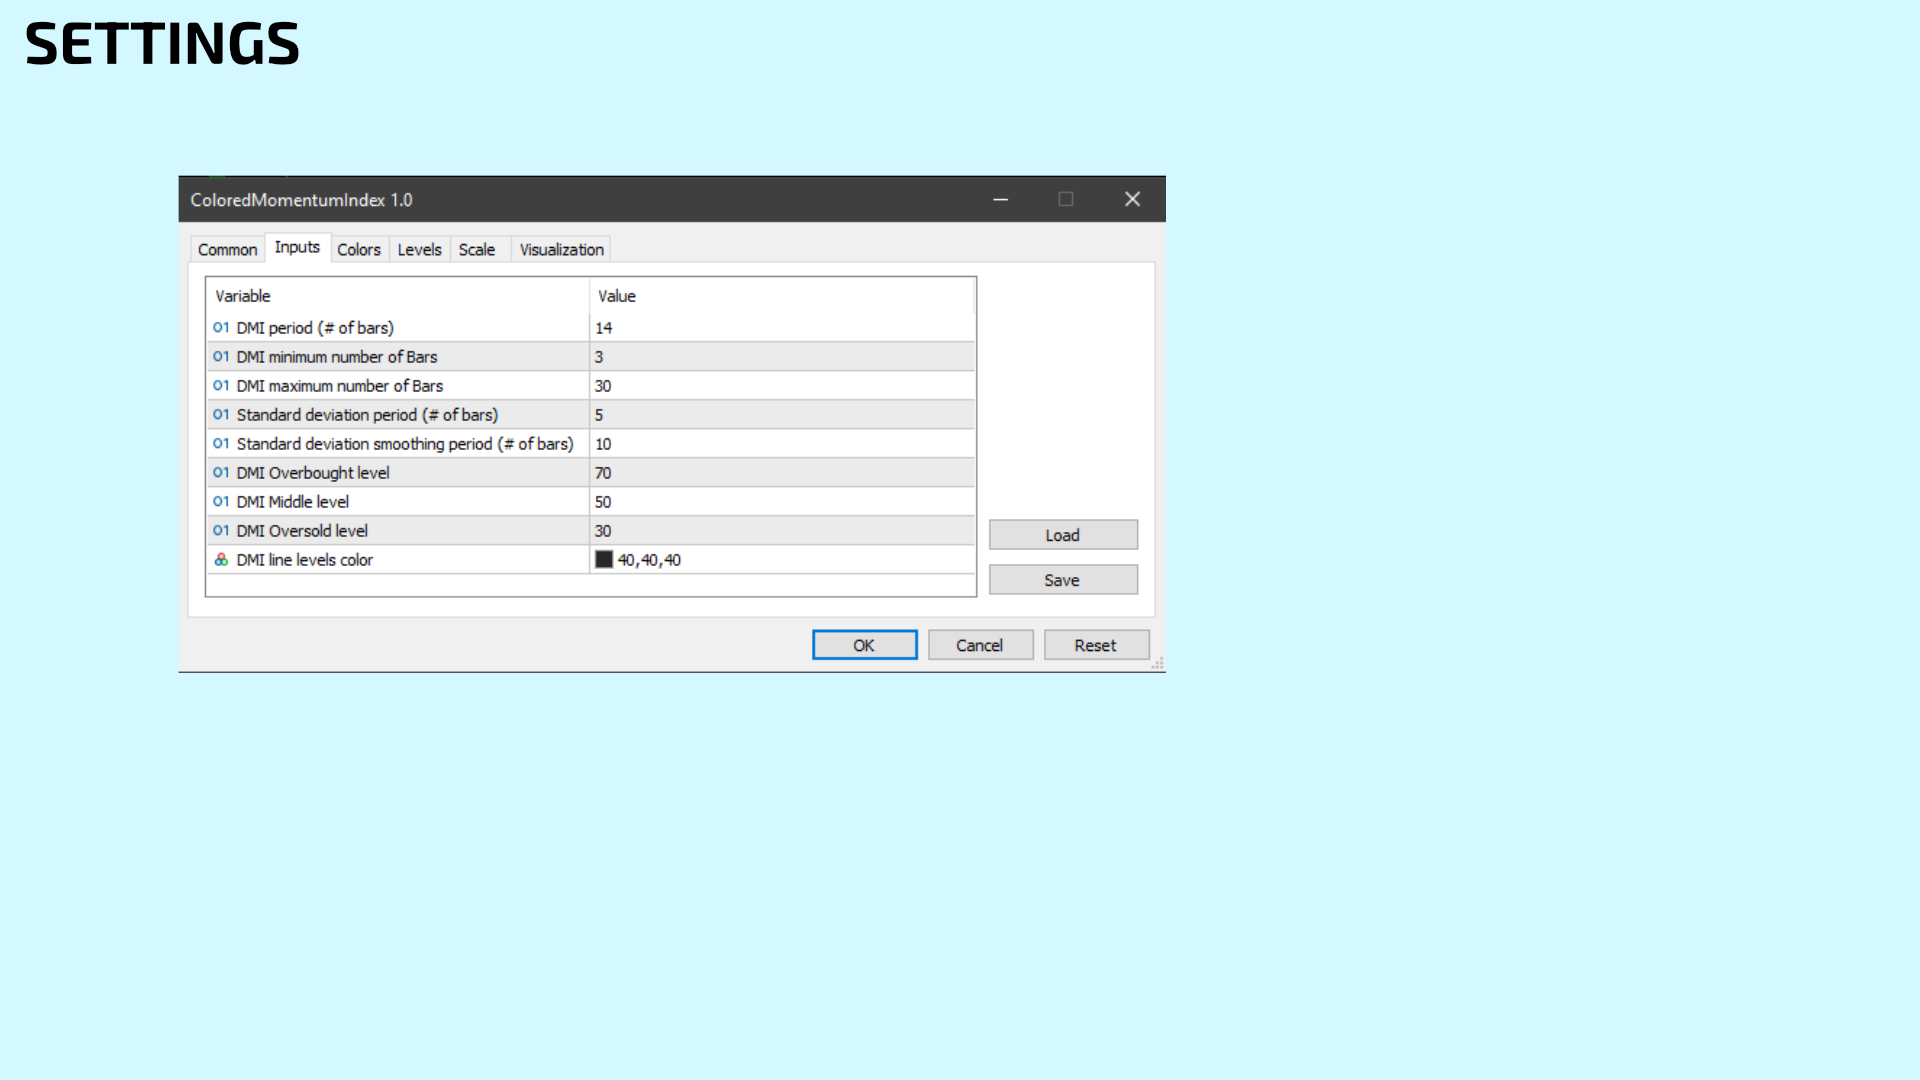
CONFIGURAÇÕES

    • Período do DMI (número de barras a serem analisadas)
    • Número mínimo de barras do DMI a serem analisadas. Padrão/Clássico: 3 barras (dias, se estiver usando gráficos diários)
    • Número máximo de barras do DMI a serem analisadas. Padrão/Clássico: 30 barras (dias, se estiver usando gráficos diários)
    • Período de Desvio Padrão (número de barras). Padrão/Clássico: 5 barras (dias, se estiver usando gráficos diários)
    • Período de suavização do desvio padrão (barras). Padrão/Clássico: 10 barras (dias, se estiver usando gráficos diários)
    • Níveis de Sobrecompra/Sobrevenda.


    Se você gostou deste indicador, tudo o que peço é um pequeno Review (não um Comentário, mas um REVIEW!)...   

    Isso significará MUITO para mim... E dessa forma posso continuar oferecendo Coisas Legais, e de Graça...

    Sem Pegadinhas! Nunca!


    Live Long and Prosper!

    ;)


    Comentários 3
    Detleff Böhmer
    2572
    Detleff Böhmer 2024.04.18 09:39 
     

    Ein weiterer und sehr hilfreicher Indikator von Flavio, ich liebe Deine Indikatoren, DANKE!!!

    heiko v.piechowski
    1472
    heiko v.piechowski 2024.04.17 11:32 
     

    Super and helpful tool, thank you

    Findolin
    955
    Findolin 2024.04.08 21:56 
     

    Very good and helpful indicator. Thank you very much!

    Produtos recomendados
    Bollinger Bands B
    Flavio Javier Jarabeck
    5 (3)
    John Bollinger created this indicator in 2010 as a way to read the original indicator (Bollinger Bands) in a more "technical" way, shown as an oscillator. The typical range of the Bollinger Bands %B is 0 - 0.5 - 1.0, where "0" represents the lower band, the "0.5" the middle band, and "1" the upper band. The line on the indicator represents the Closing prices. As simple as that. SETTINGS Bollinger Bands period of analysis Standard Deviation multiplier Shift Price type to be analyzed If you
    FREE
    RFOC Mini Chart
    Ronaldo Franco De Oliveira Cardoso
    O RFOC Mini Chart foi criado para projetar uma visão macro do mercado, que além de ter a opção de selecionar o timeframe de interesse diferente do gráfico principal, é possível incluir 2 indicadores: 1 - Canal de média móvel No mini gráfico será criado a média móvel baseada nos preços do time frame selecionado para o RFOC Mini Chart. O período da média móvel deve ser selecionado no painel de configurações do indicador. 2 - Banda de Boillinger No mini gráfico será criado banda de boillinger b
    FREE
    Follow The Line MT5
    Oliver Gideon Amofa Appiah
    4.4 (30)
    This indicator obeys the popular maxim that: "THE TREND IS YOUR FRIEND" It paints a GREEN line for BUY and also paints a RED line for SELL. (you can change the colors). It gives alarms and alerts of all kinds. IT DOES NOT REPAINT and can be used for all currency pairs and timeframes. Yes, as easy and simple as that. Even a newbie can use it to make great and reliable trades. NB: For best results, get my other premium indicators for more powerful and reliable signals. Get them here: https://www.m
    FREE
    MIDAS Super VWAP
    Flavio Javier Jarabeck
    4.29 (14)
    Imagine VWAP, MVWAP and MIDAS in one place... Well, you found it! Now you can track the movement of Big Players in various ways, as they in general pursue the benchmarks related to this measuring, gauging if they had good execution or poor execution on their orders. Traders and analysts use the VWAP to eliminate the noise that occurs throughout the day, so they can measure what prices buyers and sellers are really trading. VWAP gives traders insight into how a stock trades for that day and deter
    FREE
    Tabajara V5
    Flavio Javier Jarabeck
    4.87 (38)
    Metatrader 5 version of the famous Andre Machado's Tabajara indicator. If you don't know Andre Machado's Technical Analysis work you don't need this indicator... For those who need it and for those several friend traders who asked this porting from other platforms, here it is... FEATURES 8-period Moving Average 20-period Moving Average 50-period Moving Average 200-period Moving Average Colored candles according to the inflexion of the 20-period MA SETTINGS You can change the Period of all M
    FREE
    Money Flow Index EA Friendly
    Flavio Javier Jarabeck
    4.25 (4)
    O indicador tradicional Money Flow Index, desta vez, compatível com EAs . Existem 3 buffers expostos que podem ser usados por EAs para analisar automaticamente as condições de sobrecompra e sobrevenda da cotação. Basta usar a função tradicional iCustom() para obter esses sinais. Este cálculo do Money Flow Index é baseado no indicador MFI tradicional da Metaquote. CONFIGURAÇÕES Período do MFI Tipo de volume para analisar (Volume Real ou Ticks) Início da região de sobrecompra Início da região d
    FREE
    Value Chart Candlesticks
    Flavio Javier Jarabeck
    4.67 (9)
    The idea of a Value Chart indicator was presented in the very good book I read back in 2020 , " Dynamic Trading Indicators: Winning with Value Charts and Price Action Profile ", from the authors Mark Helweg and David Stendahl. The idea is simple and the result is pure genius: Present candlestick Price analysis in a detrended way! HOW TO READ THIS INDICATOR Look for Overbought and Oversold levels. Of course, you will need to test the settings a lot to find the "correct" one for your approach.
    FREE
    RFOC Mini Chart Simple
    Ronaldo Franco De Oliveira Cardoso
    O RFOC Mini Chart Simple foi criado para projetar uma visão macro do mercado, que além de ter a opção de selecionar o timeframe de interesse diferente do gráfico principal. Na versão completa é possível incluir 2 indicadores: 1 - Canal de média móvel No mini gráfico será criado a média móvel baseada nos preços do time frame selecionado para o RFOC Mini Chart. O período da média móvel deve ser selecionado no painel de configurações do indicador. 2 - Banda de Boillinger No mini gráfico será
    FREE
    LT Donchian Channel
    Thiago Duarte
    4.75 (4)
    Donchian Channel (ou canal de Donchian) é um indicador criado por  Richard Donchian. Ele é  formado tomando a máxima mais alta e a mais baixa mais baixa do último período especificado em velas. A área entre alta e baixa é o canal para o período escolhido. Sua configuração é simples. É possível ter a média entre a linha superior e inferior além de alertas quando o preço atinge um dos lados. Se tiver alguma dúvida ou encontrar alguma falha, me contate. Faça bom uso!
    FREE
    Donchian Pro
    Paulo Henrique Faquineli Garcia
    5 (2)
    O Canal Donchian Os canais são uma das ferramentas de análise técnica mais populares porque transmitem intuitivamente aos analistas as restrições que tendem a ocorrer na maioria das mudanças de preço. Os usuários do canal sabem que informações valiosas podem ser obtidas a qualquer momento, independentemente de o preço estar no centro de uma faixa ou próximo a uma das fronteiras. Uma das técnicas mais famosas para explorar esses conceitos são as bandas de Bollinger. No entanto, John Bollinger não
    FREE
    Free automatic Fibonacci is an indicator that automatically plots a Fibonacci retracement based on the number of bars you select on the BarsToScan setting in the indicator. The Fibonacci is automatically updated in real time as new highest and lowest values appears amongst the selected bars. You can select which level values to be displayed in the indicator settings. You can also select the color of the levels thus enabling the trader to be able to attach the indicator several times with differe
    FREE
    Multi-timeframe trend indicator based on the ADX / ADXWilder indicator with Fibonacci levels The indicator shows trend areas using ADX or ADXWilder indicator data from multiple timeframes. The impulse mode of the indicator allows you to catch the beginning of a trend, and several "Screens" with different timeframes allow you to filter out market noise. Fibonacci levels are added to the price chart, which have flexible settings. How the indicator works: if PDI is greater than NDI, then   it`
    FREE
    Wave Box Market Frenquency
    Jean Jacques Huve Ribeiro
    4.83 (6)
    Totally linked to the result of a movement and the duration he had. Its height records how many ticks the asset walked during a given movement, its width shows us the duration that movement had. Its configuration must be in line with the Weis Wave Indicator configuration to observe the movement force and can indicate a possible accumulation or distribution of the movement;
    FREE
    Indicador Regressão Linear – Par de Ativos - INTRADAY Indicador é um oscilador que faz o plot do Resíduo resultado da regressão linear entre os dois ativos inseridos como input do indicador, representado pela fórmula: Y = aX + b + R Onde Y é o valor do ativo dependente, X é o valor do ativo independente, a é a inclinação da reta entre os dois ativos, b é a intersecção da reta e R é o resíduo. O resíduo representa a quantidade da variabilidade que Y que o modelo ajustado não consegue explicar. E
    FREE
    Cybertrade Keltner Channels
    Emanuel Andriato
    4.67 (3)
    Cybertrade Keltner Channels - MT5 Criado por Chester Keltner, esse é um indicador de volatilidade utilizado pela análise técnica. É possível seguir a tendência dos preços de ativos financeiros e gerar padrões de suporte e resistência. Além disso, os envelopes são uma forma de acompanhar a volatilidade, a fim de identificar oportunidades de compra e venda desses ativos. Funciona em períodos maiores do que o período visível no gráfico. Todos os valores estão disponíveis em forma de buffers para
    FREE
    Spike Catch Pro
    Amani Fungo
    4 (5)
    Spike Catch Pro 22:03 release updates Advanced engine for searching trade entries in all Boom and Crash pairs (300,500 and 1000) Programmed strategies improvements Mx_Spikes (to combine Mxd,Mxc and Mxe), Tx_Spikes,   RegularSpikes,   Litho_System,   Dx_System,   Md_System,   MaCross,   Omx_Entry(OP),  Atx1_Spikes(OP),   Oxc_Retracement (AT),M_PullBack(AT) we have added an arrow on strategy identification, this will help also in the visual manual backtesting of the included strategies and see h
    FREE
    Are you tired of drawing trendlines every time you're analyzing charts? Or perhaps you would like more consistency in your technical analysis. Then this is for you. This indicator will draw trend lines automatically when dropped on a chart. How it works Works similar to standard deviation channel found on mt4 and mt5. It has 2 parameters: 1. Starting Bar 2. Number of bars for calculation The   starting bar   is the bar which drawing of the trend lines will begin, while the   number of bars for c
    FREE
    This is a regression tree indicator for MT4/MT5. This indicator classificate nodes on the time period so that the deviation becomes smaller, and displays regression line and channel for each node. It's free! Attached CartDemo.ex4 and CartDemo.ex5 is a Demo version and has the following limitations: Method is RandomForest only Maximum number of bars is 200 Maximum number of trees is 2 Maximum tree depth is 2 Calculated waste lines are shown Not display correlation coefficients Fu
    FREE
    Forex Indicator Arrows
    NGUYEN NGHIEM DUY
    1 (1)
    Forex Indicator Arrows is an arrow Indicator used as an assistant tool for your trading strategy. The indicator analyzes the standard deviation of bar close for a given period and generates a buy or sell signals if the deviation increases. It good to combo with Martingale EA to follow Trend and Sellect Buy Only/Sell Only for EA work Semi-Automatic. You can use this  Indicator with any EAs in my Products.
    FREE
    The custom Bollinger Bands Height indicator measures and displays the current state of the Bollinger Bands indicator, showing whether the bands are widening (moving away from each other) or narrowing (starting to converge). Contraction, indicated by the narrowing of the bands, suggests that the current market movement is losing momentum and hints at the potential start of a new strong movement. This can be a signal to look for an opportune moment to enter a position, as a sharp price change ma
    FREE
    RSI with alerts BDA
    Laron Demetris Burrows
    4.25 (16)
    Este algoritmo prevê mudanças de curto prazo no preço com uma precisão de 86%*. Quando há um grande movimento conforme determinado pelo ATR, durante uma condição de sobrecompra ou sobrevenda, o indicador irá alertá-lo. Prevê se o preço será maior ou menor do que a vela de sinal. Perfeito para negociação de reversão média, opções binárias ou contratos futuros em prazos maiores. O indicador foi testado em 5 anos de dados e tem uma precisão de 90% para prever reversões de preços ao longo do tempo.
    FREE
    Bollinger Bands Percentage
    Emanuel Cavalcante Amorim Filho
    Bollinger Bands %  or Bollinger Bands Percentage is one of the indicators used in the Sapphire Strat Maker - EA Builder . It is calculated using the following formula: Perc = (CLOSE_PRICE - LOWER_BOLLINGER) / (UPPER_BOLLINGER - LOWER_BOLLINGER) * 100 Thus, by taking the difference between closing price to the lower band and dividing it by the difference of the upper and the lower price levels of a Bollinger Bands indicator, we can calculate this indicator. It shows how far the price is f
    FREE
    Supports And Resistances Lines
    Francisco Gomes Da Silva
    4.78 (40)
    Níveis de Suportes e resistências Conheça e teste nosso indicador com a função Multi Time frame onde você pode usar todos os timeframes dentro do gráfico atual como identificar suportes e resistências automaticamente Este indicador de suporte e resistências cria linhas de suporte e linhas de resistência usando o indicador "Fractals" com base Como criar linhas de suporte O Indicador cria linhas de suporte automaticamente toda vez que o “Fractals” cria um fundo automaticamente ou faz um novo fund
    FREE
    What is this indicator? This indicator is the MACD (Moving Average Convergence/Divergence) supporting Virtual Trading mode of  Knots Compositor . When the mode is turned on, the indicator will be recalculated based on the displayed candlesticks. When the mode is turned off, the indicator will be recalculated based on the original chart candlesticks. Types of the applied price - Close - Open - High - Low - Median Price (HL/2) - Typical Price (HLC/3) - Weighted Price (HLCC/4) KC-Indicators
    FREE
    Easy GOLD MT5
    Franck Martin
    5 (9)
    Easy Gold is the latest addition to the BotGPT family. It is surprising and very powerful. It is ideal for beginners due to its simplicity.  There is absolutely nothing to do, it's 100% automated, simply indicate the percentage of risk you want to take per trade and the EA is ready. Whatever your capital, the EA takes care of everything. Optimized on (XAUUSD).  Unleash all the power with the professional version (AGI Gold) and its connection to the neural network, available in my store. My othe
    FREE
    O indicador identifica quando ocorre uma divergência entre o preço e um indicador ou oscilador. Ele identifica divergências regulares e ocultas. Combinado com suas próprias regras e técnicas, este indicador permitirá que você crie (ou aprimore) seu próprio sistema poderoso. Recursos Pode detectar divergências para os seguintes osciladores / indicadores:       MACD, OsMA, Stochastics, RSI, CCI, RVI, Awesome, ADX, ATR, OBV, Índice composto, MFI e Momentum. Apenas um oscilador / indicador pode se
    FREE
    Description. The basis for the formation of the Renko chart is the price range. If the price goes beyond its limits, the chart shows a box above or below the previous one. As a result, we see price movement without additional "noise" and important support and resistance levels. Features. For use in conjunction with the Expert Advisor, an additional buffer is implemented-a box counter. For convenience and to increase the speed of testing, the user can use the "new box" event, which the indicato
    FREE
    Mitimom
    Danil Poletavkin
    The indicator is based on Robert Miner's methodology described in his book "High probability trading strategies" and displays signals along with momentum of 2 timeframes. A Stochastic oscillator is used as a momentum indicator. The settings speak for themselves period_1 is the current timeframe, 'current' period_2 is indicated - the senior timeframe is 4 or 5 times larger than the current one. For example, if the current one is 5 minutes, then the older one will be 20 minutes The rest of the
    FREE
    Round Level MT5
    Szymon Palczynski
    5 (1)
    The fact that round number levels have a significant influence on the market cannot be denied and should not be overlooked. These psychological levels are used by both retail Forex traders and major banks that deal in Forex.  Very simple and effective indicator and most importantly free. ////////////////////////////////////////////////////////////////////////////////////////////////////////////////////////////////////////////////////////////// The program does not work in the strategy tester.
    FREE
    VWAP and MVWAP
    Flavio Javier Jarabeck
    4.17 (6)
    Volume Weighted Average Price (VWAP) is a trading benchmark commonly used by Big Players that gives the average price a Symbol has traded throughout the day. It is based on both Volume and price. Additionally we put in this indicator the MVWAP (Moving Volume Weighted Average Price). For those who do not know the usage and the importance od this indicator I recommend a great article about this subject at Investopedia ( https://www.investopedia.com/articles/trading/11/trading-with-vwap-mvwap.asp )
    FREE
    Os compradores deste produto também adquirem
    Primeiramente, vale ressaltar que este Sistema de Trading é um Indicador Não Repintado, Não Redesenho e Não Atrasado, o que o torna ideal tanto para o trading manual quanto para o automatizado. O "Sistema de Trading Inteligente MT5" é uma solução completa de trading projetada para traders novos e experientes. Ele combina mais de 10 indicadores premium e apresenta mais de 7 estratégias de trading robustas, tornando-o uma escolha versátil para diversas condições de mercado. Estratégia de Seguime
    Atomic Analyst MT5
    Issam Kassas
    5 (11)
    Primeiramente, vale ressaltar que este Indicador de Negociação não repinta, não redesenha e não apresenta atrasos, tornando-o ideal tanto para negociação manual quanto automatizada. O Analista Atômico é um Indicador de Ação de Preço PA que utiliza a força e o momentum do preço para encontrar uma vantagem melhor no mercado. Equipado com filtros avançados que ajudam a remover ruídos e sinais falsos, e aumentam o potencial de negociação. Utilizando múltiplas camadas de indicadores complexos, o A
    Quantum Trend Sniper
    Bogdan Ion Puscasu
    5 (37)
    Apresentando       Quantum Trend Sniper Indicator   , o inovador Indicador MQL5 que está transformando a maneira como você identifica e negocia as reversões de tendência! Desenvolvido por uma equipe de traders experientes com experiência comercial de mais de 13 anos,       Indicador de Atirador de Tendência Quântica       foi projetado para impulsionar sua jornada de negociação a novos patamares com sua forma inovadora de identificar reversões de tendência com precisão extremamente alta. ***C
    FX Volume MT5
    Daniel Stein
    4.94 (17)
    Receba a sua atualização diária do mercado com detalhes e screenshots através do nosso Morning Briefing aqui no mql5 e no Telegram ! O Volume FX é o PRIMEIRO e ÚNICO indicador de volume que fornece uma visão REAL do sentimento do mercado do ponto de vista de um corretor. Ele fornece uma visão incrível de como os participantes do mercado institucional, como corretores, estão posicionados no mercado Forex, muito mais rápido do que os relatórios COT. Ver essas informações diretamente no seu gráfi
    Gold Stuff mt5
    Vasiliy Strukov
    4.89 (166)
    Gold Stuff mt5-um indicador de tendência projetado especificamente para o ouro, também pode ser usado em qualquer instrumento financeiro. O indicador não é redesenhado ou atrasado. O timeframe recomendado é H1. Importante! Entre em contato comigo imediatamente após a compra para obter instruções e bônus! PARÂMETRO Draw Arrow-incl.desligado. desenhar setas no gráfico. Alertas-ligado.desligado.alertas sonoros. E-mail notification-incl.desligado. notificações por e-mail. Puch-notification-at
    Trend Screener Pro MT5
    STE S.S.COMPANY
    4.89 (61)
    Desbloqueie o poder da negociação de tendências com o indicador Trend Screener: sua solução definitiva de negociação de tendências, alimentada por lógica difusa e sistema de múltiplas moedas! Eleve sua negociação de tendências com o Trend Screener, o revolucionário indicador de tendências alimentado por lógica difusa. É um poderoso indicador de acompanhamento de tendências que combina mais de 13 ferramentas e recursos premium e 3 estratégias de negociação, tornando-o uma escolha versátil para to
    Este é um indicador para MT5 que fornece sinais precisos para entrar em uma negociação sem redesenhar. Ele pode ser aplicado a qualquer ativo financeiro: forex, criptomoedas, metais, ações, índices. Ele fornecerá estimativas bastante precisas e informará quando é melhor abrir e fechar um negócio. Assista o vídeo (6:22) com um exemplo de processamento de apenas um sinal que compensou o indicador! A maioria dos traders melhora seus resultados de negociação durante a primeira semana de negociação c
    FX Power MT5 NG
    Daniel Stein
    5 (4)
    Receba a sua atualização diária do mercado com detalhes e screenshots através do nosso Morning Briefing aqui no mql5 e no Telegram ! O FX Power MT5 NG é a próxima geração do nosso medidor de força de moeda muito popular de longa data, o FX Power. E o que é que este medidor de força da próxima geração oferece? Tudo o que adorou no FX Power original MAIS Análise de força GOLD/XAU Resultados de cálculo ainda mais precisos Períodos de análise configuráveis individualmente Limite de cálculo personal
    Antes de tudo, vale ressaltar que esta Ferramenta de Negociação é um Indicador Não Repintante, Não Redesenhante e Não Atrasado, o que a torna ideal para negociação profissional. O Indicador de Conceitos de Ação de Preço Inteligente é uma ferramenta muito poderosa tanto para traders novos quanto experientes. Ele combina mais de 20 indicadores úteis em um único, combinando ideias avançadas de negociação como Análise do Trader do Círculo Interno e Estratégias de Negociação de Conceitos de Dinhei
    RelicusRoad Pro MT5
    Relicus LLC
    4.82 (22)
    Agora US $ 147 (aumentando para US $ 499 após algumas atualizações) - Contas ilimitadas (PCs ou Macs) Manual do usuário do RelicusRoad + vídeos de treinamento + acesso ao grupo de discórdia privado + status VIP UMA NOVA FORMA DE OLHAR PARA O MERCADO O RelicusRoad é o indicador de negociação mais poderoso do mundo para forex, futuros, criptomoedas, ações e índices, oferecendo aos traders todas as informações e ferramentas necessárias para se manterem rentáveis. Fornecemos análises técnica
    Auto Order Block with break of structure based on ICT and Smart Money Concepts Futures Break of Structure ( BoS )             Order block ( OB )            Higher time frame Order block / Point of Interest ( POI )    shown on current chart           Fair value Gap ( FVG ) / Imbalance   ,  MTF      ( Multi Time Frame )    Volume Imbalance     ,  MTF          vIMB Gap’s Equal High / Low’s     ,  MTF             EQH / EQL Liquidity               Current Day High / Low           HOD /
    Advanced Supply Demand MT5
    Bernhard Schweigert
    4.53 (15)
    Atualmente com 33% de desconto! A melhor solução para qualquer Trader Novato ou especialista! Este indicador é uma ferramenta de negociação exclusiva, de alta qualidade e acessível porque incorporamos uma série de recursos proprietários e uma nova fórmula. Com esta atualização, você poderá mostrar fusos horários duplos. Você não só será capaz de mostrar um TF mais alto, mas também mostrar ambos, o TF do gráfico, MAIS o TF mais alto: MOSTRANDO ZONAS ANINHADAS. Todos os traders de Oferta e Demanda
    AW Trend Predictor MT5
    AW Trading Software Limited
    4.76 (55)
    A combinação de níveis de tendência e quebra em um sistema. Um algoritmo de indicador avançado filtra o ruído do mercado, determina a tendência, os pontos de entrada e os possíveis níveis de saída. Os sinais indicadores são registrados em um módulo estatístico, que permite selecionar as ferramentas mais adequadas, mostrando a eficácia do histórico do sinal. O indicador calcula as marcas Take Profit e Stop Loss. Manual e instruções ->   AQUI   / versão MT4 ->   AQUI Como negociar com o indicador
    TPSpro TRENDPRO  - is a trend indicator that automatically analyzes the market and provides information about the trend and each of its changes, as well as giving signals for entering trades without redrawing! The indicator uses each candle, analyzing them separately. referring to different impulses - up or down impulse. Exact entry points into transactions for currencies, crypto, metals, stocks, indices!  -  Version MT4                  DETAILED DESCRIPTION        /       TRADING SETUPS       
    A key element in trading is zones or levels from which decisions to buy or sell a trading instrument are made. Despite attempts by major players to conceal their presence in the market, they inevitably leave traces. Our task was to learn how to identify these traces and interpret them correctly. Reversal First Impulse levels (RFI)   -  Version MT4                  INSTRUCTIONS                 RUS                 ENG                         R ecommended to use with an indicator   -  TREND PRO  
    ICT, SMC, SMART MONEY CONCEPTS, SMART MONEY, Smart Money Concept, Support and Resistance, Trend Analysis, Price Action, Market Structure, Order Blocks, BOS/CHoCH,   Breaker Blocks ,  Momentum Shift,   Supply&Demand Zone/Order Blocks , Strong Imbalance,   HH/LL/HL/LH,    Fair Value Gap, FVG,  Premium  &   Discount   Zones, Fibonacci Retracement, OTE, Buy Side Liquidity, Sell Side Liquidity, BSL/SSL Taken, Equal Highs & Lows, MTF Dashboard, Multiple Time Frame, BigBar, HTF OB, HTF Market Structure
    Professional Scalping Tool on Deriv Attention! The indicator will be sold in limited quantities!!! Description: This trading indicator is designed for professional traders focused on scalping. Designed with the market in mind, it provides highly accurate spike trading signals. It works on the M1 timeframe and supports the following symbols: Boom 300 Index, Boom 500 Index, Boom 1000 Index, Crash 300 Index, Crash 500 Index, Crash 1000 Index. Functional Features: - Direction: - Trading is ca
    Blahtech Supply Demand MT5
    Blahtech Limited
    4.57 (14)
    Was: $299  Now: $99   Supply Demand uses previous price action to identify potential imbalances between buyers and sellers. The key is to identify the better odds zones, not just the untouched ones. Blahtech Supply Demand indicator delivers functionality previously unavailable on any trading platform. This 4-in-1 indicator not only highlights the higher probability zones using a multi-criteria strength engine, but also combines it with multi-timeframe trend analysis, previously confirmed swings
    Desenhe automaticamente os níveis de apoio e resistência MAIS espaços de velas de propulsão no seu gráfico, para que possa ver para onde é provável que o preço se dirija a seguir e/ou potencialmente inverta. Este indicador foi concebido para ser utilizado como parte da metodologia de negociação de posições ensinada no meu website (The Market Structure Trader) e exibe informação chave para a segmentação e potenciais entradas. MT4 Version:  https://www.mql5.com/en/market/product/97246/ Existem
    Torne-se um Negociador Breaker e lucre com as mudanças na estrutura do mercado à medida que o preço reverte. O indicador de quebra de bloco de pedidos identifica quando uma tendência ou movimento de preço está chegando à exaustão e pronto para reverter. Ele o alerta sobre mudanças na estrutura do mercado, que normalmente ocorrem quando uma reversão ou uma grande retração está prestes a ocorrer. O indicador usa um cálculo proprietário que identifica rupturas e momento do preço. Toda vez que
    Apresentando       Quantum Breakout PRO   , o inovador Indicador MQL5 que está transformando a maneira como você negocia Breakout Zones! Desenvolvido por uma equipe de traders experientes com experiência comercial de mais de 13 anos,       Quantum Breakout PRO       foi projetado para impulsionar sua jornada comercial a novos patamares com sua estratégia de zona de fuga inovadora e dinâmica. O Quantum Breakout Indicator lhe dará setas de sinal em zonas de breakout com 5 zonas-alvo de lucro e
    XQ Indicator MetaTrader 5
    Marzena Maria Szmit
    5 (1)
    Step into the realm of Forex trading with confidence and precision using XQ, a cutting-edge Forex indicator designed to elevate your trading game to unprecedented heights. Whether you're a seasoned trader or just stepping into the world of currency exchange, XQ Forex Indicator empowers you with the insights and signals needed to make informed trading decisions. The signal conditions are a combination of three indicators, and XQ Forex Indicator only display  medium and long-term trends . The ind
    Black Dragon indicator mt5
    Ramil Minniakhmetov
    4.82 (56)
    O indicador de detecção de tendências complementará qualquer estratégia e também pode ser usado como uma ferramenta independente. Vantagens Fácil de usar, não sobrecarrega o gráfico com informações desnecessárias; Pode ser usado como filtro para qualquer estratégia; Possui níveis integrados de suporte e resistência dinâmicos, que podem ser usados ​​tanto para fins de lucro quanto para definir stop-loss; O indicador não muda de cor após o fechamento do castiçal;  Trabalha no mercado de ações
    TrendDecoder Premium MT5
    Christophe, Pa Trouillas
    5 (1)
    Identifica os intervalos e os próximos movimentos prováveis  |  Obter os primeiros sinais e a força das tendências  |  Obter saídas claras antes da reversão | Detetar os níveis Fibo que o preço irá testar   |  Indicador não repintável e não atrasado - ideal para trading manual e automatizado - adequado para todos os activos e todas as unidades de tempo $69   no lançamento - depois volta a >>   $149 Após a compra,   por favor contacte-me neste canal  para obter as definições recomendadas Versão
    MetaBands M5
    Vahidreza Heidar Gholami
    4.67 (3)
    MetaBands utiliza algoritmos poderosos e únicos para desenhar canais e detectar tendências, a fim de fornecer aos traders pontos potenciais para entrar e sair de negociações. É um indicador de canal mais um indicador de tendência poderoso. Inclui diferentes tipos de canais que podem ser mesclados para criar novos canais simplesmente usando os parâmetros de entrada. O MetaBands usa todos os tipos de alertas para notificar os usuários sobre eventos de mercado. Recursos Suporta a maioria dos algori
    Antes de mais nada, vale ressaltar que este Sistema de Negociação é um Indicador Não Repintado, Não Redesenhado e sem Atrasos, o que o torna ideal para negociações profissionais. O "Sistema de Negociação de Suporte e Resistência Inteligente" é um indicador avançado projetado para traders novos e experientes. Empodera os traders com precisão e confiança no mercado forex. Este sistema abrangente combina mais de 7 estratégias, 10 indicadores e vários métodos de negociação, incluindo estratégias
    Was: $249  Now: $99   Market Profile defines a number of day types that can help the trader to determine market behaviour. A key feature is the Value Area, representing the range of price action where 70% of trading took place. Understanding the Value Area can give traders valuable insight into market direction and establish the higher odds trade. It is an excellent addition to any system you may be using. Inspired by Jim Dalton’s book “Mind Over Markets”, this indicator is designed to suit the
    Malaysian SNR Levels
    Matthias Horst Pieroth
    This indicator can be used to display Support and Resistance levels according to  the  Malaysian SNR concept , in which Support and Resistance are exact levels of a line chart. Malaysian SNR There are 3 different horizontal levels in Malaysian SNR: A-Level : This level is located at the peak of this line chart. (shape looks like the letter A) V-Level : Level at the valley of a line chart, (shape looks like the letter V) Gap-Leve l: This level is located at the Close/Open gap between two cand
    The Volume by Price Indicator for MetaTrader 5 features Volume Profile and Market Profile TPO (Time Price Opportunity). Get valuable insights out of currencies, equities and commodities data. Gain an edge trading financial markets. Volume and TPO histogram bar and line charts. Volume Footprint charts. TPO letter and block marker charts including split structures. Versatile segmentation and compositing methods. Static, dynamic and flexible ranges with relative and/or absolute visualizations. Lay
    Trend Line Map Pro MT5
    STE S.S.COMPANY
    4.67 (9)
    O indicador Trend Line Map é um complemento do Trend Screener Indicator. Ele funciona como um scanner para todos os sinais gerados pelo Trend screener (Trend Line Signals). É um Trend Line Scanner baseado no Trend Screener Indicator. Se você não tiver o Trend Screener Pro Indicator, o Trend Line Map Pro não funcionará. It's a Trend Line Scanner based on Trend Screener Indicator. If you don't have Trend Screener Pro Indicator,     the Trend Line Map Pro will not work . Acessando nosso Blog
    Mais do autor
    Mini POC
    Flavio Javier Jarabeck
    4.76 (25)
    For those who struggle with overbloated Volume Profile/Market Profile indicators, here is a solution that contains only the Point of Control (POC) information. Super-fast and reliable, the Mini POC indicator presents this vital information visually within your chart. Totally customizable in splittable timeframes, type of Volume, calculation method, and how many days back you need. SETTINGS Timeframe to split the POCs within the day. Volume type to use: Ticks or Real Volume. Calculation method
    FREE
    Tabajara V5
    Flavio Javier Jarabeck
    4.87 (38)
    Metatrader 5 version of the famous Andre Machado's Tabajara indicator. If you don't know Andre Machado's Technical Analysis work you don't need this indicator... For those who need it and for those several friend traders who asked this porting from other platforms, here it is... FEATURES 8-period Moving Average 20-period Moving Average 50-period Moving Average 200-period Moving Average Colored candles according to the inflexion of the 20-period MA SETTINGS You can change the Period of all M
    FREE
    Auto Support and Resistances
    Flavio Javier Jarabeck
    4.6 (80)
    Are you tired of drawing Support & Resistance levels for your Quotes? Are you learning how to spot Support & Resistances? No matter what is your case, Auto Support & Resistances will draw those levels for you! AND, it can draw them from other timeframes, right into you current chart, no matter what timeframe you are using... You can also Agglutinate regions/zones that are too much closer to each other and turning them into one single Support & Resistance Level. All configurable. SETTINGS Time
    FREE
    Economic Markers
    Flavio Javier Jarabeck
    4.83 (18)
    Easily get all relevant economic events of the current day right into your chart, as markers. Filter what kind of markers do you want: by country (selected individually) and by Importance (High relevance, Medium, Low or any combination of these). Configure the visual cues to your liking. If there is more than one event set to the very same time, their Names will be stacked and you will see the messages merged with the plus (+) sign on the marker. Obviously that long or too much events on the sam
    FREE
    Big Player Candles
    Flavio Javier Jarabeck
    4.75 (28)
    If you heard about The Wyckoff Method, Volume Spread Analysis, etc... You are probably searching for the candlestick indicator that shows you the Volume spread all over the current bar, signaling every types of market status... You can control the several Market Levels with custom colors... It is up to you to decide how to use it. Our job is provide you with the indicator... If you like this indicator, all I am asking is a little Review (not a Comment, but a REVIEW! )...    This will mean A
    FREE
    Closing Price Reversal
    Flavio Javier Jarabeck
    5 (10)
    Closing Price Reversal is a very well known and traded candlestick pattern. This little indicator paints with specific (user-selected) colors the Closing Price Reveral Up and Down patterns, as well as the Inside Bars (as a bonus). Higher timeframes are more effective  as with all other candlesticks patterns. Do NOT trade solely on this indicator. Search the web for "Closing Price Reversal" to learn about the several approaches that can be used with this pattern. One of them is combining short/me
    FREE
    Inside Bar Radar
    Flavio Javier Jarabeck
    4.67 (6)
    The Inside Bar pattern is a very well known candlestick formation used widely by traders all over the world and in any marketplace. This approach is very simple and adds a little confirmation candle, so it adds a third past candlestick to the count to confirm the direction of the move (upward or downward). Obviously, there is no power on this candlestick formation if the trader has no context on what it is happening on the market he/she is operating, so this is not magic, this "radar" is only a
    FREE
    Symbol Watermark
    Flavio Javier Jarabeck
    4.62 (13)
    Another request from my brotherhood was putting the name of the Symbol being seen - a little bigger - on the Chart, just to get sure that they are seeing the correct one... Mistakes pay a high price on the market... It is a very effective, and almost resource-null-consuming indicator that displays the current Symbol Name and Timeframe in almost any position of your Chart, with any color, and any Font Size... And also you can change the divisor character that is presented between the Symbol Name
    FREE
    Aggression Volume
    Flavio Javier Jarabeck
    3.8 (20)
    O Indicador de Volume de Agressão é o tipo de indicador que raramente é encontrado na comunidade MQL5 porque não é baseado nos dados de Volume padrão fornecidos pela plataforma Metatrader 5. Ele requer a análise de todos os Ticks de tráfego solicitados na plataforma... Dito isso, o indicador de Volume de Agressão solicita todos os Dados de Tick do seu Broker e os processa para construir uma versão muito especial de um Indicador de Volume, onde as agressões de Compradores e Vendedores são plotada
    FREE
    Weis Waves
    Flavio Javier Jarabeck
    3.15 (26)
    The original author is David Weis, an expert in the Wyckoff Method. The Weis Wave is a modern adaptation of the 1930's Wyckoff Method, another expert in Tape Reading techniques and Chart Analysis. Weis Waves takes market volume and stacks it into waves according to price conditions giving the trader valuable insights about the market conditions. If you want to learn more about this subject you can find tons of videos in YouTube. Just look for "The Wickoff Method", "Weis Wave" and "Volume Spread
    FREE
    MIDAS Super VWAP
    Flavio Javier Jarabeck
    4.29 (14)
    Imagine VWAP, MVWAP and MIDAS in one place... Well, you found it! Now you can track the movement of Big Players in various ways, as they in general pursue the benchmarks related to this measuring, gauging if they had good execution or poor execution on their orders. Traders and analysts use the VWAP to eliminate the noise that occurs throughout the day, so they can measure what prices buyers and sellers are really trading. VWAP gives traders insight into how a stock trades for that day and deter
    FREE
    Force Numbers
    Flavio Javier Jarabeck
    Several assets in several markets have the behavior of using specific numbers as Force Numbers, where support, resistance and price thrust is created. Let this indicator draw those levels of support and resistance for you. You can also stack it to show different level of Prices! This technique is being used by Tape Readers and Order Flow traders all over the world for a long time. Give it a try. Challenge yourself to study new ways of Price Action! SETTINGS What Price reference to use in th
    FREE
    Waves Sizer
    Flavio Javier Jarabeck
    3.67 (6)
    Wyckoff fans, enjoy! Ideally to be used with the Weis Waves indicator, but it can be easily used alone, the Waves Sizer puts the range (in resulting Price movement) done by the Price on its market swings. You can control how accurate or loose will be the swings. This tool is very helpful for visually know how much the Price has traveled in your Timeframe. This way you can confront this level of effort with the resulting Volume, etc... Weis Waves indicator: https://www.mql5.com/en/market/pro
    FREE
    VWAP and MVWAP
    Flavio Javier Jarabeck
    4.17 (6)
    Volume Weighted Average Price (VWAP) is a trading benchmark commonly used by Big Players that gives the average price a Symbol has traded throughout the day. It is based on both Volume and price. Additionally we put in this indicator the MVWAP (Moving Volume Weighted Average Price). For those who do not know the usage and the importance od this indicator I recommend a great article about this subject at Investopedia ( https://www.investopedia.com/articles/trading/11/trading-with-vwap-mvwap.asp )
    FREE
    Price Momentum
    Flavio Javier Jarabeck
    4.92 (13)
    Value Chart indicator presents the Price evolution in a new form. This indicator, Price Momentum , was developed taking all the calculations presented in the book " Dynamic Trading Indicators " by Mark W. Helweg and David Stendahl (2002). The technique involves de-trended Prices from a user-defined Period of analysis and the addition of a Volatility index correction. The result is an Oscillator with 3 zones: Fair Price Value, Overbought/Oversold and Extremely Overbought/Oversold zones. Adding th
    FREE
    Stackable VWAP
    Flavio Javier Jarabeck
    3.33 (6)
    Volume Weighted Average Price (VWAP) is a trading benchmark commonly used by Big Players that gives the average price a Symbol has traded throughout the day. It is based on both Volume and price. Additionally we put in this indicator the MVWAP (Moving Volume Weighted Average Price). For those who do not know the usage and the importance od this indicator I recommend a great article about this subject at Investopedia ( https://www.investopedia.com/articles/trading/11/trading-with-vwap-mvwap.asp
    FREE
    Money Flow Index EA Friendly
    Flavio Javier Jarabeck
    4.25 (4)
    O indicador tradicional Money Flow Index, desta vez, compatível com EAs . Existem 3 buffers expostos que podem ser usados por EAs para analisar automaticamente as condições de sobrecompra e sobrevenda da cotação. Basta usar a função tradicional iCustom() para obter esses sinais. Este cálculo do Money Flow Index é baseado no indicador MFI tradicional da Metaquote. CONFIGURAÇÕES Período do MFI Tipo de volume para analisar (Volume Real ou Ticks) Início da região de sobrecompra Início da região d
    FREE
    Market Momentum
    Flavio Javier Jarabeck
    3.86 (7)
    O indicador de Momento do Mercado é baseado no Oscilador de Zona de Volume (VZO), apresentado por Waleed Aly Khalil na edição de 2009 do jornal da Federação Internacional de Analistas Técnicos , e apresenta uma nova visão desses valiosos dados de mercado que muitas vezes são mal compreendidos e negligenciados: o VOLUME. Com essa nova abordagem de "ver" os dados de Volume, os traders podem inferir de maneira mais adequada o comportamento do mercado e aumentar suas chances em uma negociação bem-su
    FREE
    Flux Diffuser
    Flavio Javier Jarabeck
    4.43 (7)
    Based on Brazilian trader André Moraes' Difusor de Fluxo theory, the indicator is a more reliable version of the original MACD. It is a great confirmation indicator for Swing Trading and also can be used as a Day Trading tool. If you are not familiar with the concept or André's trading strategies, I strongly recommend his excelent book named "Se Afastando da Manada" in which he explains in detail how this indicator is used. Even if you don't know the Portuguese language it is not difficult to un
    FREE
    Candle Zones
    Flavio Javier Jarabeck
    5 (1)
    You probably heard about Candlesticks behaviors, which in most of the times could denote and trace Volume behaviors even if you are not watching Volume itself... Well, this indicator will do this. Naked traders love to rely solely on candlesticks patterns and with Candle Zones you can trap special patterns and DRAW THEM on your chart. As simple as that. There are several filters you can tweak in order to achieve the analysis you want. Just give it a try. After several months of testing, we think
    FREE
    ATR Monitor
    Flavio Javier Jarabeck
    4.83 (6)
    O ATR é uma medida de volatilidade introduzida pelo famoso autor J. Welles Wilder Jr. em seu livro "New Concepts in Technical Trading Systems". Em geral, os traders estão acostumados a ver o ATR na forma de um indicador em uma sub-janela do gráfico. O que estou apresentando aqui é uma versão simplificada do ATR - apenas contendo o número atual do ATR - muito útil para monitorar apenas o momento atual do mercado. Se você quiser monitorar vários tempos gráficos dentro do gráfico corrente,
    FREE
    Server Clock
    Flavio Javier Jarabeck
    4.89 (9)
    Many friends asked me for a simple, non-obtrusive, resource-friendly clock to track the time during their trades. It seems pretty obvious, but it is a must-have for those trading the market manually, waiting for the Market News, or just to visually know what time it is... Trading is an absorbing endeavor! So, here it is... Totally configurable, including Font Type, Font Size and Chart Location: Upper Left/Center/Right OR Lower Left/Center/Right, with a little twist of adjusting the Offset, just
    FREE
    Time Spaced Moving Averages
    Flavio Javier Jarabeck
    4.67 (6)
    The concept is simple: Plotting Price behavior within several periods of time. Some Symbols behave very well during the trading day - with this I mean Intraday trading - and this behavior ends up plotting effectively well with the proposed Exponential Moving Averages in this indicator... Obviously that this behavior could not be seen in all Symbols, but you can give it a try... Just drop this indicator in a chart and you will see for yourself... This indicator is intended for "Feeling the Trend
    FREE
    Price Trail Chart
    Flavio Javier Jarabeck
    5 (4)
    For those who hate candlesticks in lower timeframes (M1 through M15) we "invented" a clean new way to follow Price movement and displacement (volatility) called Price Trail Chart . The big "secret" is to get rid of those annoying candle wicks and draw the whole complete candle without them, this way we get a cleaner chart and a new view of the Price Path. No Open or Close markings, just LOW's and HIGH's, full body candle. Additionaly we inserted a Volume monitor from our Best Downloaded indicat
    FREE
    ATR Monitor EA Friendly
    Flavio Javier Jarabeck
    ATR Monitor ATR is a measure of volatility introduced by market technician J. Welles Wilder Jr. in his book, "New Concepts in Technical Trading Systems". In general, traders are accustomed to seeing the ATR in the form of a sub-window indicator. What I am presenting here is a simplified version of ATR - just the current ATR number - very useful for monitoring just the very moment of the current chart. And, by default, this indicator will not show up on screen, you can just use the buffers thems
    FREE
    Economic Markers PRO
    Flavio Javier Jarabeck
    5 (1)
    Easily get all relevant economic events of the current day right into your chart, as markers. Filter what kind of markers do you want: by country (selected individually) and by Importance (High relevance, Medium, Low or any combination of these). Configure the visual cues to your liking. Additionaly you have the ability to add up to 5 personal markers of your own agenda. With Alerts and/or with blackout periods, if you are using it within an Expert Advisor! All in one Economic Calendar indicator
    Arrows Cleaner
    Flavio Javier Jarabeck
    4.86 (7)
    For those who use the Trading Arrows on the chart for later study, but use the Triple Screen approach and got all those arrows everywhere on all additional charts, here it is: Arrows Cleaner! Just drop it on the chart and leave it there. When needed, just with 1-click you get rid of all those annoying arrows... SETTINGS You can position the little Button on any corner of the chart. Additionally you can displace it with the Offset settings. You can enlarge or shrink its size, as well as the tex
    FREE
    Candlestick Pattern Teller
    Flavio Javier Jarabeck
    5 (1)
    Minions Labs' Candlestick Pattern Teller It shows on your chart the names of the famous Candlesticks Patterns formations as soon as they are created and confirmed. No repainting. That way beginners and also professional traders who have difficulties in visually identifying candlestick patterns will have their analysis in a much easier format. Did you know that in general there are 3 types of individuals: Visual, Auditory, and Kinesthetic? Don't be ashamed if you cannot easily recognize Candlest
    Mini Chart Indicators
    Flavio Javier Jarabeck
    The Metatrader 5 has a hidden jewel called Chart Object, mostly unknown to the common users and hidden in a sub-menu within the platform. Called Mini Chart, this object is a miniature instance of a big/normal chart that could be added/attached to any normal chart, this way the Mini Chart will be bound to the main Chart in a very minimalist way saving a precious amount of real state on your screen. If you don't know the Mini Chart, give it a try - see the video and screenshots below. This is a gr
    Market Momentum PRO
    Flavio Javier Jarabeck
    The Market Momentum indicator is based on the Volume Zone Oscillator (VZO), presented by Waleed Aly Khalil in the 2009 edition of the International Federation of Technical Analysts journal, and presents a fresh view of this market valuable data that is oftenly misunderstood and neglected: VOLUME. With this new approach of "seeing" Volume data, traders can infer more properly market behavior and increase their odds in a winning trade. "The VZO is a leading volume oscillator; its basic usefulnes
    Filtro:
    Detleff Böhmer
    2572
    Detleff Böhmer 2024.04.18 09:39 
     

    Ein weiterer und sehr hilfreicher Indikator von Flavio, ich liebe Deine Indikatoren, DANKE!!!

    Flavio Javier Jarabeck
    274456
    Resposta do desenvolvedor Flavio Javier Jarabeck 2024.04.18 13:04
    Thanks for your support Detleff!
    heiko v.piechowski
    1472
    heiko v.piechowski 2024.04.17 11:32 
     

    Super and helpful tool, thank you

    Flavio Javier Jarabeck
    274456
    Resposta do desenvolvedor Flavio Javier Jarabeck 2024.04.17 20:49
    I'm glad you liked it! ;)
    Findolin
    955
    Findolin 2024.04.08 21:56 
     

    Very good and helpful indicator. Thank you very much!

    Flavio Javier Jarabeck
    274456
    Resposta do desenvolvedor Flavio Javier Jarabeck 2024.04.17 20:49
    I'm glad you liked it! Thank you! ;)
    Responder ao comentário
    Versão 1.1 2024.04.05
    :: Little bug-fix pointed by one of our fans.