• Visão global
  • Comentários (1)
  • Discussão (1)

Commodity Channel Index DA

5

Что такое CCI индикатор?

  
Стандартный Индикатор CCI (Commodity Channel Index) – это осциллятор, который измеряет силу, стоящую за тем или иным движением цены. Он помогает определить, кто находятся у руля: быки или медведи. 
Как и многие осцилляторы импульса, CCI работает, сравнивая текущую цену с предыдущими показателями, и на основе этого сравнения он решает, насколько сильное движение цены вверх/вниз. 


Как рассчитать CCI?

Метод расчета стандартного индикатора представляет собой оригинальную торговую систему CCI, подробно описанную ее создателем Дональдом Р. Ламбертом в 1980 году:
  1. Первый шаг – определить типичную цену. Это достигается путем вычисления среднего арифметического цен максиму- ма, минимума и закрытия.
  2. Второй шаг – рассчитать простую скользящую среднюю ти- пичной цены. В оригинальном методе скользящая средняя рассчитывалась с использованием периода в 20 дней, но в настоящее время по умолчанию чаще используется значение 14. 
  3. Третий шаг – рассчитать среднее отклонение от скользящей средней. Используя эти значения, мы можем вычислить CCI по следующей формуле: 
CCI = (типичная цена - скользящая средняя) / (0,015 x среднее отклонение) 


Дональд Ламберт использовал константу 0,015, чтобы от 70% до 80% значений CCI находились между +100 и -100. Поэтому значения выше 100 или ниже -100 являются нетипичными отклонениями от среднего значения.


Чем отличается Commodity Channel Index DA от обычного CCI?

 В целом методика расчёта CCI DA та же, что и у обычного CCI. Но в расчёте стандартного индикатора CCI  используется типичная цена. А при расчёте Commodity Channel Index DA цена подвергается дополнительной обработке.

Изначально Дональд Ламберт использовал число 20 в  качестве стандартного значения, хотя и допускал то, что любое значение от 5 до 25 может применяться при использовании  индикатора CCI. 


Если вы установите слишком маленькое значение, есть  вероятность, что это вызовет эффект ценового шума, то есть цена будет заходить за области +100 и -100 гораздо чаще, что может привести к большему числу ложных сигналов. Но тут речь идёт об обычном CCI. А вот у индикатора  Commodity Channel Index DA в такой ситуации есть большое преимущество.  Его можно сгладить. 


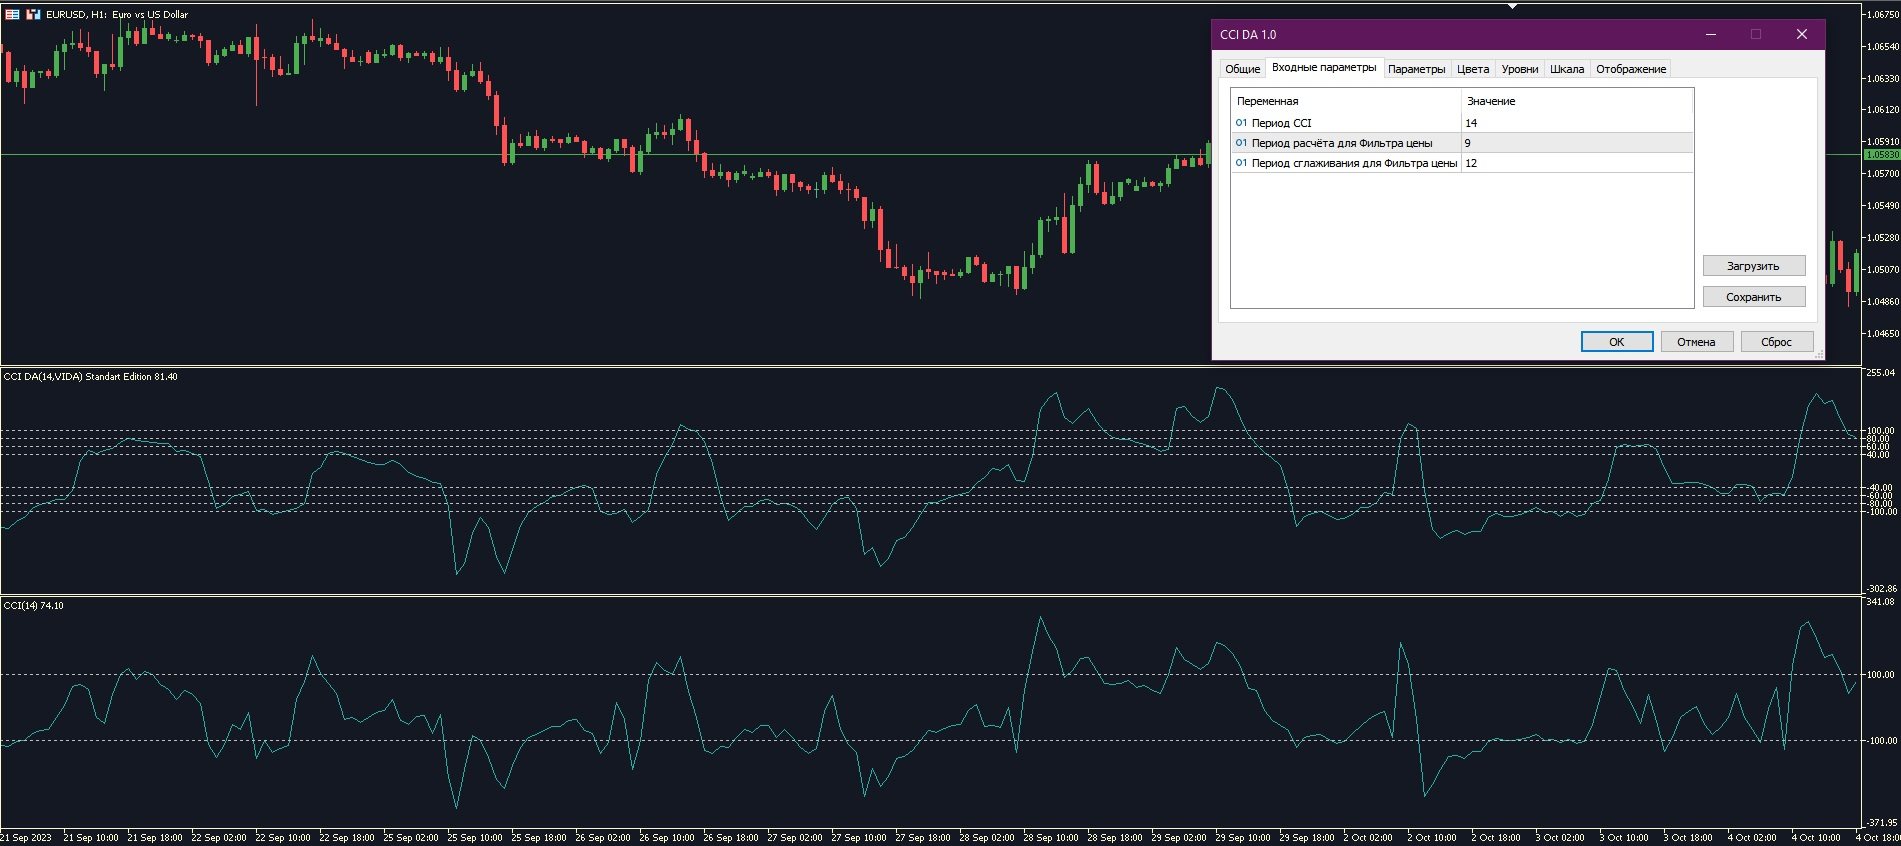
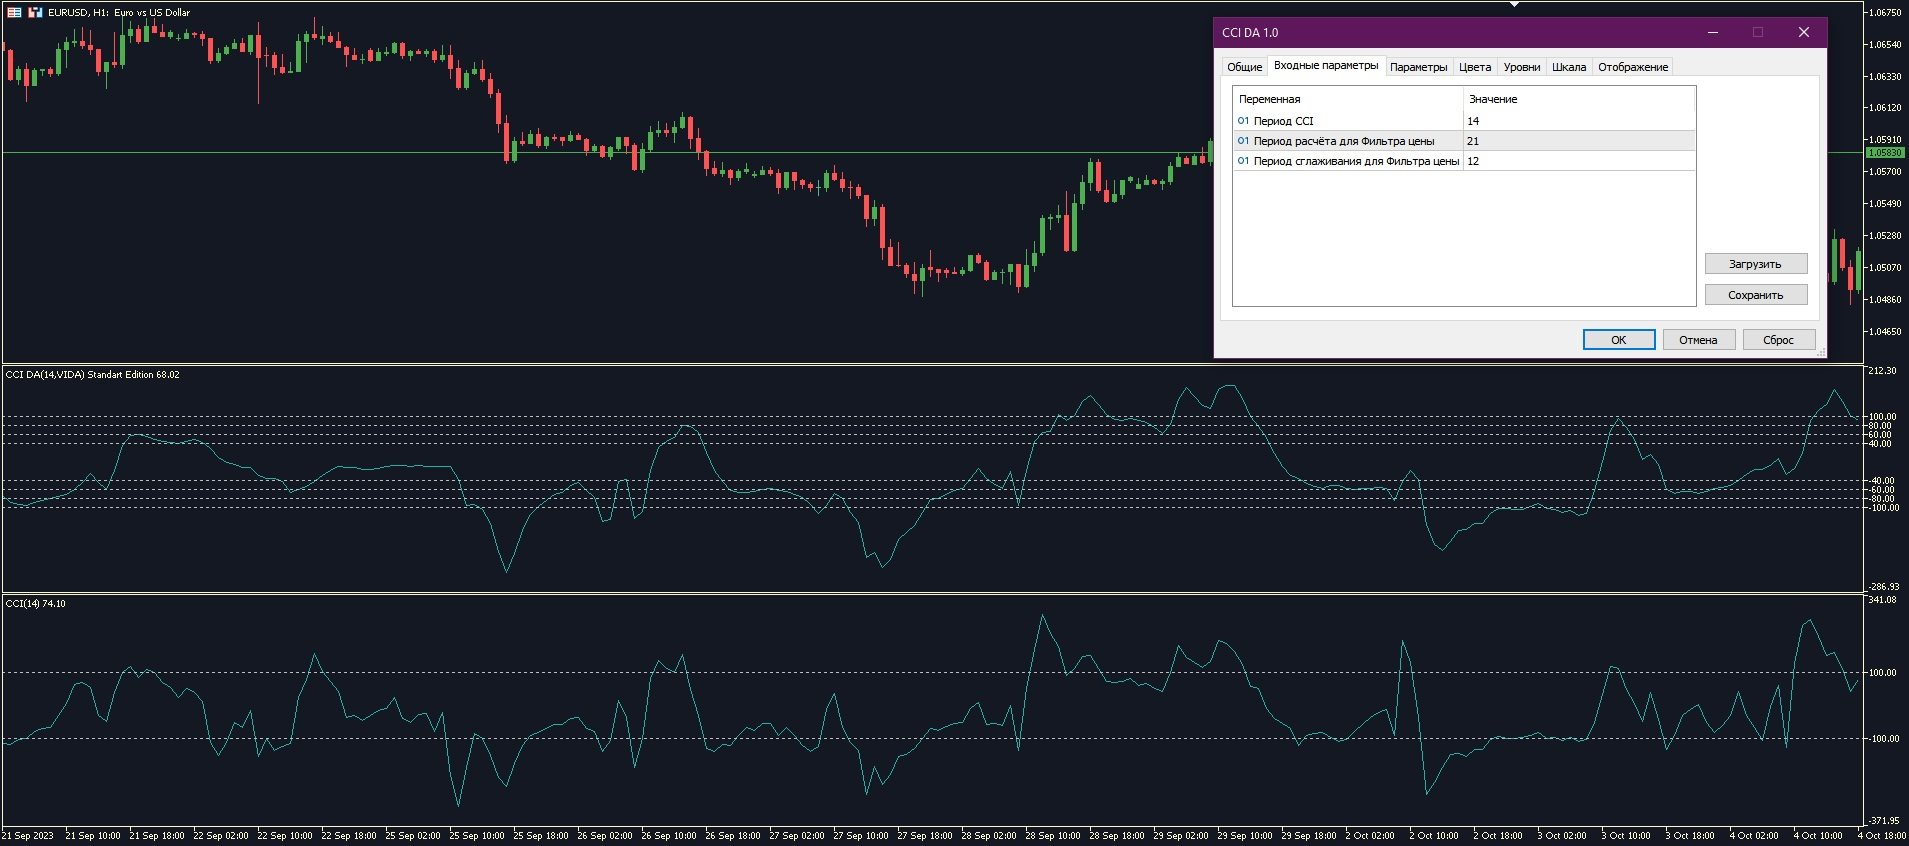
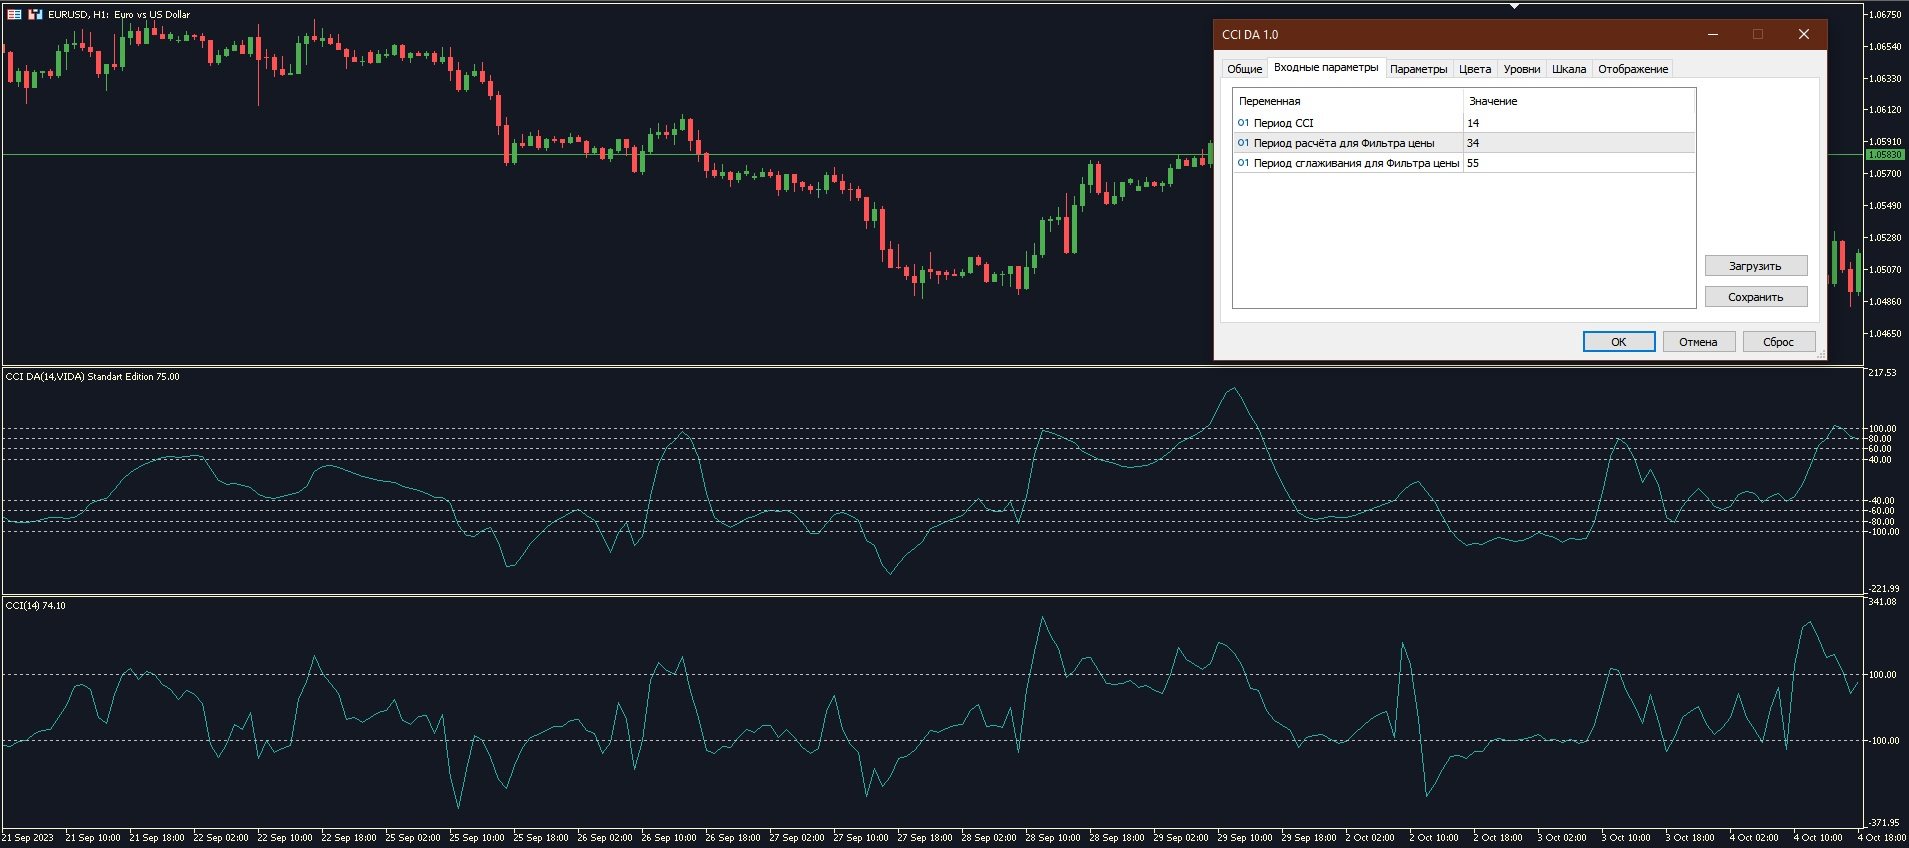
Настройки индикатора

  • Период CCI - это количество баров, участвующих в расчете текущего значения индикатора
  • Период сглаживания для фильтра цены  - это количество баров, участвующих в сглаживании отфильтрованных значений индикатора
  • Период расчёта для фильтра цены - это количество баров, участвующих в фильтрации те- кущего значения индикатора


Comentários 1
Detleff Böhmer
2572
Detleff Böhmer 2023.11.11 10:00 
 

Guter Indikator, sehr hilfreich.

Produtos recomendados
Follow The Line MT5
Oliver Gideon Amofa Appiah
4.42 (31)
This indicator obeys the popular maxim that: "THE TREND IS YOUR FRIEND" It paints a GREEN line for BUY and also paints a RED line for SELL. (you can change the colors). It gives alarms and alerts of all kinds. IT DOES NOT REPAINT and can be used for all currency pairs and timeframes. Yes, as easy and simple as that. Even a newbie can use it to make great and reliable trades. NB: For best results, get my other premium indicators for more powerful and reliable signals. Get them here: https://www.m
FREE
A professional tool for trading - the divergence indicator between the RSI and the price, which allows you to receive a signal about a trend reversal in a timely manner or catch price pullback movements (depending on the settings). The indicator settings allow you to adjust the strength of the divergence due to the angle of the RSI peaks and the percentage change in price, which makes it possible to fine-tune the signal strength. The indicator code is optimized and is tested very quickly as par
FREE
Trend indicator based on the ADX / ADXWilder indicator The indicator shows trend areas using ADX or ADXWilder indicator data. How the indicator works: if PDI is greater than NDI, then it`s bullish movement; if PDI is less than NDI, then it`s bearish movement; if ADX is less than or equal to the filter value specified in the parameters, then there is no movement state. Input parameters of the indicator: Calculate Timeframe - timeframe for calculation; ADX Type - type of ADX calculation
FREE
This is a free version of the indicator, the period between the vertical lines is always 30 bars. In the paid version the period can be set by user, so a configuration with many ThreePointsChannel indicators with different periods is possible. The principle of construction - on top of any number of bars set by the user, a channel is constructed with maximum and minimum lines so that the bars touch the maximum and minimum of the channel at exactly three points. The name of the indicator follows
FREE
Mitimom
Danil Poletavkin
The indicator is based on Robert Miner's methodology described in his book "High probability trading strategies" and displays signals along with momentum of 2 timeframes. A Stochastic oscillator is used as a momentum indicator. The settings speak for themselves period_1 is the current timeframe, 'current' period_2 is indicated - the senior timeframe is 4 or 5 times larger than the current one. For example, if the current one is 5 minutes, then the older one will be 20 minutes The rest of the
FREE
A professional tool for trading - the divergence indicator between the  MACD and the price, which allows you to receive a signal about a trend reversal in a timely manner or catch price pullback movements (depending on the settings). The indicator settings allow you to adjust the strength of the divergence due to the angle of the  MACD peaks and the percentage change in price, which makes it possible to fine-tune the signal strength. The indicator code is optimized and is tested very quickly as
FREE
A professional tool for trading - the divergence indicator between the MACD and the price, which allows you to receive a signal about a trend reversal in a timely manner or catch price pullback movements (depending on the settings). The indicator settings allow you to adjust the strength of the divergence due to the angle of the MACD peaks and the percentage change in price, which makes it possible to fine-tune the signal strength. The indicator code is optimized and is tested very quickly as p
FREE
O indicador identifica quando ocorre uma divergência entre o preço e um indicador ou oscilador. Ele identifica divergências regulares e ocultas. Combinado com suas próprias regras e técnicas, este indicador permitirá que você crie (ou aprimore) seu próprio sistema poderoso. Recursos Pode detectar divergências para os seguintes osciladores / indicadores:       MACD, OsMA, Stochastics, RSI, CCI, RVI, Awesome, ADX, ATR, OBV, Índice composto, MFI e Momentum. Apenas um oscilador / indicador pode se
FREE
AdaptiveCCiMt5
Francis Dube
4 (4)
The Commodity Channel Index computes the deviation of the typical price of each bar from the average price over a particular time period. Multiplying the median deviation by 0.015 facilitates normalization, which makes all deviations below the first standard deviation less than  -100, and all deviations above the first standard deviation more than 100. This adaptive version is based on the indicator described by John Ehlers, in the book Rocket Science for traders. The indicator uses the homodyne
FREE
HighLow MT5
Azamat Mullayanov
4.2 (5)
The indicator plots two lines by High and Low prices. The lines comply with certain criteria. The blue line is for buy. The red one is for sell. The entry signal - the bar opens above\below the lines. The indicator works on all currency pairs and time frames It can be used either as a ready-made trading system or as an additional signal for a custom trading strategy. There are no input parameters. Like with any signal indicator, it is very difficult to use the product during flat movements. You
FREE
FractalEfficiencyIndicator   A ratio between 0 and 1 with the higher values representing a more efficient or trending market,  It is used in the calculation of Perry J. Kaufman Adaptive Moving Average (KAMA), dividing the price change over a period by the absolute sum of the price movements that occurred to achieve that change. The Fractal Efficiency or also known as Efficiency Ratio was first published by Perry J. Kaufman in his book   ‘Smarter Trading‘. This is mostly considered a filter for v
FREE
Multi-timeframe trend indicator based on the ADX / ADXWilder indicator with Fibonacci levels The indicator shows trend areas using ADX or ADXWilder indicator data from multiple timeframes. The impulse mode of the indicator allows you to catch the beginning of a trend, and several "Screens" with different timeframes allow you to filter out market noise. Fibonacci levels are added to the price chart, which have flexible settings. How the indicator works: if PDI is greater than NDI, then   it`
FREE
Free automatic Fibonacci is an indicator that automatically plots a Fibonacci retracement based on the number of bars you select on the BarsToScan setting in the indicator. The Fibonacci is automatically updated in real time as new highest and lowest values appears amongst the selected bars. You can select which level values to be displayed in the indicator settings. You can also select the color of the levels thus enabling the trader to be able to attach the indicator several times with differe
FREE
Are you tired of drawing trendlines every time you're analyzing charts? Or perhaps you would like more consistency in your technical analysis. Then this is for you. This indicator will draw trend lines automatically when dropped on a chart. How it works Works similar to standard deviation channel found on mt4 and mt5. It has 2 parameters: 1. Starting Bar 2. Number of bars for calculation The   starting bar   is the bar which drawing of the trend lines will begin, while the   number of bars for c
FREE
RSI magic kjuta trial is the demo version of RSI magic kjuta. Custom Indicator (RSI magic kjuta) based on the standard   (Relative Strength Index, RSI) with additional settings and functions. The maximum and minimum RSI lines on the chart have been added to the standard RSI line. Now you can visually observe the past highs and lows of RSI, and not only the values of the closing bars, which avoids confusion in the analysis of trades. For example, the EA opened or closed an order, but the RSI l
FREE
LT Donchian Channel
Thiago Duarte
4.75 (4)
Donchian Channel (ou canal de Donchian) é um indicador criado por  Richard Donchian. Ele é  formado tomando a máxima mais alta e a mais baixa mais baixa do último período especificado em velas. A área entre alta e baixa é o canal para o período escolhido. Sua configuração é simples. É possível ter a média entre a linha superior e inferior além de alertas quando o preço atinge um dos lados. Se tiver alguma dúvida ou encontrar alguma falha, me contate. Faça bom uso!
FREE
Dual RSI
Paul Conrad Carlson
Indicator alerts for Dual Relative strength index rsi. Large rsi preset at 14 is below 30 small rsi preset at 4 is below 10 for buy bullish signals . Large rsi preset are 14 is above 70 small rsi preset at 4 is above 90 for sell bearish signals . Includes mobile and terminal alerts. draws lines when alerts. This indicator can help identify extremes and then the tops or bottoms of those extremes .
FREE
MWC COX 5
Joerg Hamann
3.75 (4)
The MWC COX indicator shows the extreme zones of net short/long positions of the Commitments of Traders Report released by the CFTC once a week for four periods of time. Default settings are periods of 12, 26, 52 and 156 weeks. Additional Features Displays the sum of all 4 periods in one line MA, MOM and RSI indicators are integrated ( not in the MQL5 Version 1.0 ) Please make sure that you download the MWC_Demo.zip file and unpack it into   [...]/MQL5/Files   folder.  ->  www.myweeklycot.com/
FREE
Multi RsI BB MT5
Mansour Babasafary
5 (1)
A combined indicator of two famous indicators: RSI , Bollinger Bands Can be used in all currency pairs Can be used in all time frames with many signals Very simple and fast to use Description: This indicator is made from the combination of RSI and Bollinger Bands indicators As you can see, it shows good signals and is worth using and testing We hope you are satisfied with this indicator Settings: show past show candle: Displays the number of candles that the indicator calculates. For
FREE
Reversal Composite Candles
MetaQuotes Ltd.
3.43 (23)
A ideia do sistema é a identificação de padrões de reversão utilizando o cálculo de candles compostos. Os padrões de reversão são semelhantes aos padrões "Martelo" e o " Homem Enforcado " da análise candlestick Japonesa, porém ele usa candles compostos em vez de uma única barra e não precisa do pequeno corpo numa composição para confirmar a reversão. Os parâmetros de entrada: Range - número máximo de barras, utilizada no cálculo de composição dos candles compostos . Minimum - tamanho mínimo d
FREE
An analogue of the Stochastic oscillator based on algorithms of singular spectrum analysis (SSA) SSA is an effective method to handle non-stationary time series with unknown internal structure. It is used for determining the main components (trend, seasonal and wave fluctuations), smoothing and noise reduction. The method allows finding previously unknown series periods and make forecasts on the basis of the detected periodic patterns. Indicator signals are identical to signals of the original i
FREE
Auto Fibonacci
Ali Gokay Duman
5 (1)
This indicator calculates fibonacci levels via moving averages trend and draw these lines. You can change fast and slow Moving Averages settings for customization. Inputs: Fast MA Time Period :  64 Fast MA Shift: 0 Fast MA Method: Smoothed Fast MA Apply To: Median Price Slow MA Time Period: 32 Slow MA Shift: 0 Slow MA Method: Smoothed Slow MA Apply To: Median Price ZigZag: False ZigZag Color: Red ZigZag Type: DashDot ZigZag Width: VeryThin Fibo Settings TrendFibonacci: True FiboTrendColor: Blac
FREE
What is this indicator? This indicator is the MACD (Moving Average Convergence/Divergence) supporting Virtual Trading mode of  Knots Compositor . When the mode is turned on, the indicator will be recalculated based on the displayed candlesticks. When the mode is turned off, the indicator will be recalculated based on the original chart candlesticks. Types of the applied price - Close - Open - High - Low - Median Price (HL/2) - Typical Price (HLC/3) - Weighted Price (HLCC/4) KC-Indicators
FREE
Easy GOLD MT5
Franck Martin
5 (9)
Easy Gold is the latest addition to the BotGPT family. It is surprising and very powerful. It is ideal for beginners due to its simplicity.  There is absolutely nothing to do, it's 100% automated, simply indicate the percentage of risk you want to take per trade and the EA is ready. Whatever your capital, the EA takes care of everything. Optimized on (XAUUSD).  Unleash all the power with the professional version (AGI Gold) and its connection to the neural network, available in my store. My othe
FREE
A professional tool for trading - the divergence indicator between the WPR and the price, which allows you to receive a signal about a trend reversal in a timely manner or catch price pullback movements (depending on the settings). The indicator settings allow you to adjust the strength of the divergence due to the angle of the WPR peaks and the percentage change in price, which makes it possible to fine-tune the signal strength. The indicator code is optimized and is tested very quickly as par
FREE
PZ Three Drives MT5
PZ TRADING SLU
3.11 (9)
This indicator finds Three Drives patterns. The Three Drives pattern is a 6-point reversal pattern characterised by a series of higher highs or lower lows that complete at a 127% or 161.8% Fibonacci extension. It signals that the market is exhausted and a reversal can happen. [ Installation Guide | Update Guide | Troubleshooting | FAQ | All Products ] Customizable pattern sizes Customizable colors and sizes Customizable breakout periods Customizable 1-2-3 and 0-A-B ratios It implements visua
FREE
UpdatedRSI
ANO IDS
2.67 (3)
Modified and updated RSI indicator. Please use arrows on the chart to enter to deals and to exit from deals. The indicator is designed for all currency pairs and time-frames. Parameters: PeriodRSI - indicator period; OpenLevel - level for entering to deals (range diapason 0-100); CloseLevel - level for exiting from deals (range diapason 0-100); FlatMode - please enable this trigger in flat mode (i.e. if there are no determined trends).
FREE
RSI with alerts BDA
Laron Demetris Burrows
4.25 (16)
Este algoritmo prevê mudanças de curto prazo no preço com uma precisão de 86%*. Quando há um grande movimento conforme determinado pelo ATR, durante uma condição de sobrecompra ou sobrevenda, o indicador irá alertá-lo. Prevê se o preço será maior ou menor do que a vela de sinal. Perfeito para negociação de reversão média, opções binárias ou contratos futuros em prazos maiores. O indicador foi testado em 5 anos de dados e tem uma precisão de 90% para prever reversões de preços ao longo do tempo.
FREE
Multi-timeframe trend indicator, based on the ADX / ADXWilder indicator The indicator shows trend areas using ADX or ADXWilder indicator data from multiple timeframes. The impulse mode of the indicator allows you to catch the beginning of a trend, and several "Screens" with different timeframes allow you to filter out market noise. How the indicator works: if PDI is greater than NDI, then it`s bullish movement; if PDI is less than NDI, then it`s bearish movement; to determine any trend, it
FREE
Important Lines
Terence Gronowski
4.88 (26)
This indicator displays Pivot-Lines, preday high and low, preday close and the minimum and maximum of the previous hour. You just have to put this single indicator to the chart to have all these important lines, no need to setup many single indicators. Why certain lines are important Preday high and low : These are watched by traders who trade in a daily chart. Very often, if price climbs over or falls under a preday low/high there is an acceleration in buying/selling. It is a breakout out of
FREE
Os compradores deste produto também adquirem
Primeiramente, vale ressaltar que este Sistema de Trading é um Indicador Não Repintado, Não Redesenho e Não Atrasado, o que o torna ideal tanto para o trading manual quanto para o automatizado. O "Sistema de Trading Inteligente MT5" é uma solução completa de trading projetada para traders novos e experientes. Ele combina mais de 10 indicadores premium e apresenta mais de 7 estratégias de trading robustas, tornando-o uma escolha versátil para diversas condições de mercado. Estratégia de Seguime
Atomic Analyst MT5
Issam Kassas
4.82 (11)
Primeiramente, vale ressaltar que este Indicador de Negociação não repinta, não redesenha e não apresenta atrasos, tornando-o ideal tanto para negociação manual quanto automatizada. O Analista Atômico é um Indicador de Ação de Preço PA que utiliza a força e o momentum do preço para encontrar uma vantagem melhor no mercado. Equipado com filtros avançados que ajudam a remover ruídos e sinais falsos, e aumentam o potencial de negociação. Utilizando múltiplas camadas de indicadores complexos, o A
FX Volume MT5
Daniel Stein
4.94 (17)
Receba a sua atualização diária do mercado com detalhes e screenshots através do nosso Morning Briefing aqui no mql5 e no Telegram ! O Volume FX é o PRIMEIRO e ÚNICO indicador de volume que fornece uma visão REAL do sentimento do mercado do ponto de vista de um corretor. Ele fornece uma visão incrível de como os participantes do mercado institucional, como corretores, estão posicionados no mercado Forex, muito mais rápido do que os relatórios COT. Ver essas informações diretamente no seu gráfi
Quantum Trend Sniper
Bogdan Ion Puscasu
5 (37)
Apresentando       Quantum Trend Sniper Indicator   , o inovador Indicador MQL5 que está transformando a maneira como você identifica e negocia as reversões de tendência! Desenvolvido por uma equipe de traders experientes com experiência comercial de mais de 13 anos,       Indicador de Atirador de Tendência Quântica       foi projetado para impulsionar sua jornada de negociação a novos patamares com sua forma inovadora de identificar reversões de tendência com precisão extremamente alta. ***C
Gold Stuff mt5
Vasiliy Strukov
4.89 (166)
Gold Stuff mt5-um indicador de tendência projetado especificamente para o ouro, também pode ser usado em qualquer instrumento financeiro. O indicador não é redesenhado ou atrasado. O timeframe recomendado é H1. Importante! Entre em contato comigo imediatamente após a compra para obter instruções e bônus! PARÂMETRO Draw Arrow-incl.desligado. desenhar setas no gráfico. Alertas-ligado.desligado.alertas sonoros. E-mail notification-incl.desligado. notificações por e-mail. Puch-notification-at
Trend Screener Pro MT5
STE S.S.COMPANY
4.89 (61)
Desbloqueie o poder da negociação de tendências com o indicador Trend Screener: sua solução definitiva de negociação de tendências, alimentada por lógica difusa e sistema de múltiplas moedas! Eleve sua negociação de tendências com o Trend Screener, o revolucionário indicador de tendências alimentado por lógica difusa. É um poderoso indicador de acompanhamento de tendências que combina mais de 13 ferramentas e recursos premium e 3 estratégias de negociação, tornando-o uma escolha versátil para to
RelicusRoad Pro MT5
Relicus LLC
4.82 (22)
Agora US $ 147 (aumentando para US $ 499 após algumas atualizações) - Contas ilimitadas (PCs ou Macs) Manual do usuário do RelicusRoad + vídeos de treinamento + acesso ao grupo de discórdia privado + status VIP UMA NOVA FORMA DE OLHAR PARA O MERCADO O RelicusRoad é o indicador de negociação mais poderoso do mundo para forex, futuros, criptomoedas, ações e índices, oferecendo aos traders todas as informações e ferramentas necessárias para se manterem rentáveis. Fornecemos análises técnica
Antes de tudo, vale ressaltar que esta Ferramenta de Negociação é um Indicador Não Repintante, Não Redesenhante e Não Atrasado, o que a torna ideal para negociação profissional. O Indicador de Conceitos de Ação de Preço Inteligente é uma ferramenta muito poderosa tanto para traders novos quanto experientes. Ele combina mais de 20 indicadores úteis em um único, combinando ideias avançadas de negociação como Análise do Trader do Círculo Interno e Estratégias de Negociação de Conceitos de Dinhei
Este é um indicador para MT5 que fornece sinais precisos para entrar em uma negociação sem redesenhar. Ele pode ser aplicado a qualquer ativo financeiro: forex, criptomoedas, metais, ações, índices. Ele fornecerá estimativas bastante precisas e informará quando é melhor abrir e fechar um negócio. Assista o vídeo (6:22) com um exemplo de processamento de apenas um sinal que compensou o indicador! A maioria dos traders melhora seus resultados de negociação durante a primeira semana de negociação c
FX Power MT5 NG
Daniel Stein
5 (4)
Receba a sua atualização diária do mercado com detalhes e screenshots através do nosso Morning Briefing aqui no mql5 e no Telegram ! O FX Power MT5 NG é a próxima geração do nosso medidor de força de moeda muito popular de longa data, o FX Power. E o que é que este medidor de força da próxima geração oferece? Tudo o que adorou no FX Power original MAIS Análise de força GOLD/XAU Resultados de cálculo ainda mais precisos Períodos de análise configuráveis individualmente Limite de cálculo personal
Advanced Supply Demand MT5
Bernhard Schweigert
4.53 (15)
Atualmente com 33% de desconto! A melhor solução para qualquer Trader Novato ou especialista! Este indicador é uma ferramenta de negociação exclusiva, de alta qualidade e acessível porque incorporamos uma série de recursos proprietários e uma nova fórmula. Com esta atualização, você poderá mostrar fusos horários duplos. Você não só será capaz de mostrar um TF mais alto, mas também mostrar ambos, o TF do gráfico, MAIS o TF mais alto: MOSTRANDO ZONAS ANINHADAS. Todos os traders de Oferta e Demanda
Auto Order Block with break of structure based on ICT and Smart Money Concepts Futures Break of Structure ( BoS )             Order block ( OB )            Higher time frame Order block / Point of Interest ( POI )    shown on current chart           Fair value Gap ( FVG ) / Imbalance   ,  MTF      ( Multi Time Frame )    Volume Imbalance     ,  MTF          vIMB Gap’s Equal High / Low’s     ,  MTF             EQH / EQL Liquidity               Current Day High / Low           HOD /
XQ Indicator MetaTrader 5
Marzena Maria Szmit
5 (1)
Step into the realm of Forex trading with confidence and precision using XQ, a cutting-edge Forex indicator designed to elevate your trading game to unprecedented heights. Whether you're a seasoned trader or just stepping into the world of currency exchange, XQ Forex Indicator empowers you with the insights and signals needed to make informed trading decisions. The signal conditions are a combination of three indicators, and XQ Forex Indicator only display  medium and long-term trends . The ind
ICT, SMC, SMART MONEY CONCEPTS, SMART MONEY, Smart Money Concept, Support and Resistance, Trend Analysis, Price Action, Market Structure, Order Blocks, BOS/CHoCH,   Breaker Blocks ,  Momentum Shift,   Supply&Demand Zone/Order Blocks , Strong Imbalance,   HH/LL/HL/LH,    Fair Value Gap, FVG,  Premium  &   Discount   Zones, Fibonacci Retracement, OTE, Buy Side Liquidity, Sell Side Liquidity, BSL/SSL Taken, Equal Highs & Lows, MTF Dashboard, Multiple Time Frame, BigBar, HTF OB, HTF Market Structure
Blahtech Supply Demand MT5
Blahtech Limited
4.57 (14)
Was: $299  Now: $99   Supply Demand uses previous price action to identify potential imbalances between buyers and sellers. The key is to identify the better odds zones, not just the untouched ones. Blahtech Supply Demand indicator delivers functionality previously unavailable on any trading platform. This 4-in-1 indicator not only highlights the higher probability zones using a multi-criteria strength engine, but also combines it with multi-timeframe trend analysis, previously confirmed swings
Torne-se um Negociador Breaker e lucre com as mudanças na estrutura do mercado à medida que o preço reverte. O indicador de quebra de bloco de pedidos identifica quando uma tendência ou movimento de preço está chegando à exaustão e pronto para reverter. Ele o alerta sobre mudanças na estrutura do mercado, que normalmente ocorrem quando uma reversão ou uma grande retração está prestes a ocorrer. O indicador usa um cálculo proprietário que identifica rupturas e momento do preço. Toda vez que
O Indicador de Quadrados de Gann é uma poderosa ferramenta de análise de mercado baseada no artigo "Fórmula Matemática para Previsões de Mercado" escrito por W.D. Gann, que se baseia em conceitos matemáticos para análise. Ele incorpora elementos das técnicas de Gann relacionadas com os quadrados de 144, 90 e 52, bem como o quadrado de 9. Além disso, inclui o método do  sobre como combinar o quadrado de 9 com canais e padrões de estrela. Manual do Usuário e Modo de Uso: Antes de usar este indicad
AW Trend Predictor MT5
AW Trading Software Limited
4.76 (54)
A combinação de níveis de tendência e quebra em um sistema. Um algoritmo de indicador avançado filtra o ruído do mercado, determina a tendência, os pontos de entrada e os possíveis níveis de saída. Os sinais indicadores são registrados em um módulo estatístico, que permite selecionar as ferramentas mais adequadas, mostrando a eficácia do histórico do sinal. O indicador calcula as marcas Take Profit e Stop Loss. Manual e instruções ->   AQUI   / versão MT4 ->   AQUI Como negociar com o indicador
The Volume by Price Indicator for MetaTrader 5 features Volume Profile and Market Profile TPO (Time Price Opportunity). Get valuable insights out of currencies, equities and commodities data. Gain an edge trading financial markets. Volume and TPO histogram bar and line charts. Volume Footprint charts. TPO letter and block marker charts including split structures. Versatile segmentation and compositing methods. Static, dynamic and flexible ranges with relative and/or absolute visualizations. Lay
TrendLine PRO MT5
Evgenii Aksenov
4.78 (49)
The Trend Line PRO indicator is an independent trading strategy. It shows the trend change, the entry point to the transaction, as well as automatically calculates three levels of Take Profit and Stop Loss protection Trend Line PRO is perfect for all Meta Trader symbols: currencies, metals, cryptocurrencies, stocks and indices Advantages of Trend Line PRO Never redraws its signals The possibility of using it as an independent strategy It has three automatic levels Take Profit and Stop Loss lev
MetaBands M5
Vahidreza Heidar Gholami
4.67 (3)
MetaBands utiliza algoritmos poderosos e únicos para desenhar canais e detectar tendências, a fim de fornecer aos traders pontos potenciais para entrar e sair de negociações. É um indicador de canal mais um indicador de tendência poderoso. Inclui diferentes tipos de canais que podem ser mesclados para criar novos canais simplesmente usando os parâmetros de entrada. O MetaBands usa todos os tipos de alertas para notificar os usuários sobre eventos de mercado. Recursos Suporta a maioria dos algori
Apresentando       Quantum Breakout PRO   , o inovador Indicador MQL5 que está transformando a maneira como você negocia Breakout Zones! Desenvolvido por uma equipe de traders experientes com experiência comercial de mais de 13 anos,       Quantum Breakout PRO       foi projetado para impulsionar sua jornada comercial a novos patamares com sua estratégia de zona de fuga inovadora e dinâmica. O Quantum Breakout Indicator lhe dará setas de sinal em zonas de breakout com 5 zonas-alvo de lucro e
Owl Smart Levels MT5
Sergey Ermolov
4.47 (36)
Versão MT4  |  FAQ O Indicador Owl Smart Levels é um sistema de negociação completo dentro de um indicador que inclui ferramentas populares de análise de mercado, como fractais avançados de Bill Williams , Valable ZigZag que constrói a estrutura de onda correta do mercado e níveis de Fibonacci que marcam os níveis exatos de entrada no mercado e lugares para obter lucros. Descrição detalhada da estratégia Instruções para trabalhar com o indicador Consultor de negociação Owl Helper Chat privado d
Gartley Hunter Multi
Siarhei Vashchylka
5 (5)
Gartley Hunter Multi - An indicator for searching for harmonic patterns simultaneously on dozens of trading instruments and on all classic timeframes: (m1, m5, m15, m30, H1, H4, D1, Wk, Mn). Manual (Be sure to read before purchasing) | Version for MT4 Advantages 1. Patterns: Gartley, Butterfly, Shark, Crab. Bat, Alternate Bat, Deep Crab, Cypher 2. Simultaneous search for patterns on dozens of trading instruments and on all classic timeframes 3. Search for patterns of all possible sizes. Fr
Trend Line Map Pro MT5
STE S.S.COMPANY
4.67 (9)
O indicador Trend Line Map é um complemento do Trend Screener Indicator. Ele funciona como um scanner para todos os sinais gerados pelo Trend screener (Trend Line Signals). É um Trend Line Scanner baseado no Trend Screener Indicator. Se você não tiver o Trend Screener Pro Indicator, o Trend Line Map Pro não funcionará. It's a Trend Line Scanner based on Trend Screener Indicator. If you don't have Trend Screener Pro Indicator,     the Trend Line Map Pro will not work . Acessando nosso Blog
TrendDecoder Premium MT5
Christophe, Pa Trouillas
5 (1)
Identifica os intervalos e os próximos movimentos prováveis  |  Obter os primeiros sinais e a força das tendências  |  Obter saídas claras antes da reversão | Detetar os níveis Fibo que o preço irá testar   |  Indicador não repintável e não atrasado - ideal para trading manual e automatizado - adequado para todos os activos e todas as unidades de tempo $69   no lançamento - depois volta a >>   $149 Após a compra,   por favor contacte-me neste canal  para obter as definições recomendadas Versão
TPSpro TRENDPRO  - is a trend indicator that automatically analyzes the market and provides information about the trend and each of its changes, as well as giving signals for entering trades without redrawing! The indicator uses each candle, analyzing them separately. referring to different impulses - up or down impulse. Exact entry points into transactions for currencies, crypto, metals, stocks, indices!  -  Version MT4                  DETAILED DESCRIPTION        /       TRADING SETUPS       
Was: $249  Now: $99   Market Profile defines a number of day types that can help the trader to determine market behaviour. A key feature is the Value Area, representing the range of price action where 70% of trading took place. Understanding the Value Area can give traders valuable insight into market direction and establish the higher odds trade. It is an excellent addition to any system you may be using. Inspired by Jim Dalton’s book “Mind Over Markets”, this indicator is designed to suit the
Black Dragon indicator mt5
Ramil Minniakhmetov
4.82 (56)
O indicador de detecção de tendências complementará qualquer estratégia e também pode ser usado como uma ferramenta independente. Vantagens Fácil de usar, não sobrecarrega o gráfico com informações desnecessárias; Pode ser usado como filtro para qualquer estratégia; Possui níveis integrados de suporte e resistência dinâmicos, que podem ser usados ​​tanto para fins de lucro quanto para definir stop-loss; O indicador não muda de cor após o fechamento do castiçal;  Trabalha no mercado de ações
Golden Spikes Detector
Batsirayi L Marango
5 (1)
Golden Spikes Detector Este indicador é baseado em uma estratégia avançada principalmente para picos de negociação nos índices Boom e Crash. Algoritmos complexos foram implementados para detectar apenas entradas de alta probabilidade. Ele alerta sobre possíveis entradas de compra e venda. Para negociar picos na corretora Deriv ou Binária, receba apenas os alertas Buy Boom e Sell Cash. Ele foi otimizado para ser carregado em um período de 5 minutos, embora a análise de vários períodos de tempo se
Mais do autor
Heiken Ashi DA
Vitaly Dodonov
4.5 (2)
Что такое Heiken Ashi?    Heiken Ashi — это метод построения графиков, который можно использовать для прогнозирования будущего движения цены. Он похож на традиционные свечные графики. Однако в отличие от обычного свечного графика, график Heiken Ashi пытается отфильтровать часть рыночного шума для лучшего определения трендовых движений на рынке. Как рассчитать Heiken Ashi? Heiken Ashi использует формулу COHL, которая означает «Закрытие, Открытие, Максимум, Минимум». Это четыре компонента, кото
FREE
Что такое Stochastic?  Осциллятор стохастик (Stochastic) – это индикатор импульса, который сравнивает конкретную цену закрытия инструмента с его диапазоном максимумов и минимумов за определенное количество периодов.    Основная идея индикатора заключается в том, что импульс предшествует цене, поэтому стохастический осциллятор может давать сигналы о фактическом движении цены непосредственно перед тем, как оно произойдет.   Stochastic является осциллятором с привязкой к диапазону от 0 до 100 (по
FREE
Что такое Awesome Oscillator?   Создателем данного индикатора является Билл Вильямс. Этот трейдер разработал собственную торговую систему. Её основой служит постулат: «Рынок движется хаотично. Какие-либо закономерности этого движения вывести довольно сложно, так как многое зависит от психологических факторов.» Поэтому Вильямс разработал собственные инструменты для анализа рынка. Одним из таких инструментов и является индикатор АО. Это осциллятор, который дает возможность выявить силу текущего
FREE
Rsi DA
Vitaly Dodonov
5 (2)
Что такое RSI?  Индикатор RSI (Relative Strength Index, индекс относительной силы) — это индикатор, который измеряет соотношение восходящих и нисходящих движений. Расчет ведётся таким образом, что индекс выражается в диапазоне от 0 до 100. Как понять RSI? Если значение RSI находится равно 70 и больше, считается, что инструмент находится в состоянии перекупленности (ситуация, когда цены выросли выше, нежели того ожидал рынок). Значение RSI на уровне 30 и ниже считается сигналом о том, что инст
FREE
OsMA DA
Vitaly Dodonov
Что такое OsMA DA?   Индикатор OsMA DA – это осциллятор, который построен на показаниях другого осциллятора – MACD. OsMA DA показывает расхождение между сигнальной линией MACD и его гистограммой. Момент пересечения гистограммы и линии – это нулевая отметка OsMA.   Если гистограмма MACD поднимается выше линии, то гистограмма самого OsMA DA поднимается выше нулевой отметки. В обратной ситуации OsMA DA демонстрирует отрицательные значения.   OsMA DA более узконаправленный индикатор, чем MACD. OsMA
FREE
Зачем нужен этот индикатор? Думаю вы замечали каким «хаотичным» может быть дви- жение цены. Бывают периоды, когда цена движется направле- но, почти без коррекций. В такие периоды трендовые страте- гии работают очень хорошо.  Но  как только направленное движение заканчивается, торговая стратегия перестаёт работать. Появляется очень  много ложных сигналов, что приводит к большому количеству отрицательных сделок.  Тогда возникла мысль: «А что если создать индикатор,  который смог бы заменить ценов
FREE
MaCD DA
Vitaly Dodonov
Что такое MACD?  Обычный MACD – это осциллятор хотя его часто называют трендовым индикатором, или даже «трендовым осциллятором». Происходит это потому, что MACD строится на основе показаний двух скользящих средних. Чем отличается MACD DA?   В MACD DA используется специальный ценовой фильтр. Только после фильтрации строится индикатор. Гистограмма отображает степень расхождения двух скользящих средних: если одна удаляется от другой, то растут и столбики гистограммы, если сближаются, тогда столбц
FREE
Momentum DA
Vitaly Dodonov
Что такое Momentum DA?  Индикатор Momentum DA- это инструмент техническго анализа, который измеряет скорость, с которой меняются цены активов за определенный период времени.  Является модификацией обчного Momentum.   Основная идея этого индикатора заключается в том, чтобы помочь трейдерам определить возможные точки разворота ценового тренда, определяя моменты ускорения или замедления роста или падения цен.    Он основан на предположении, что быстрое увеличение цены будет вероятно сопровождаться
FREE
How often have you had to open deals or place pending orders, and then sit at the monitor and wait for the price to behave further? After all, you can miss the right moment and a profitable deal could easily become unprofitable. And all this is due to the fact that they did not tighten the stop loss, did not set a take profit. Or the price movement was so strong and fast that you missed the moment when the pending order was triggered. And then your entire trading plan was disrupted. Orders Inter
Filtro:
Detleff Böhmer
2572
Detleff Böhmer 2023.11.11 10:00 
 

Guter Indikator, sehr hilfreich.

Responder ao comentário