• Visão global
  • Comentários (1)
  • Discussão

PTS Precision Index Oscillator V2

5
O Oscilador de Índice de Precisão (Pi-Osc) de Roger Medcalf da Precision Trading Systems

A Versão 2 foi cuidadosamente reconfigurada para carregar rapidamente em seu gráfico, e algumas outras melhorias técnicas foram incorporadas para aprimorar a experiência.

O Pi-Osc foi criado para fornecer sinais precisos de temporização de negociações projetados para encontrar pontos de exaustão extremos, os pontos para os quais os mercados são forçados a ir apenas para tirar as ordens de todos.

Este produto resolve o antigo problema de saber onde estão os pontos extremos, o que torna a vida do trader muito mais simples.

Este é um indicador de consenso altamente complexo que possui algumas diferenças poderosas em relação aos osciladores padrão da indústria.

Algumas das características que ele usa são divergências no Índice de Demanda, fluxo de dinheiro, RSI, estocástico, reconhecimento de padrões, análise de volume, pontos extremos de desvio padrão e muitas variações semelhantes em diferentes intervalos.

À primeira vista, para o olho não treinado, pareceria como qualquer outro oscilador, mas ao vê-lo em contraste com outros osciladores como RSI ou momentum, etc., o verdadeiro poder deste indicador começa a surgir.

Até onde sei, não há outro oscilador que possa frequentemente identificar topos e fundos exatos com a mesma eficiência regular.

O Oscilador de Índice de Precisão é composto por muitas equações matemáticas diferentes que medem o movimento de preço e volume em múltiplos quadros de tempo, prevendo com alto grau de precisão onde os pontos de virada nas tendências provavelmente ocorrerão.

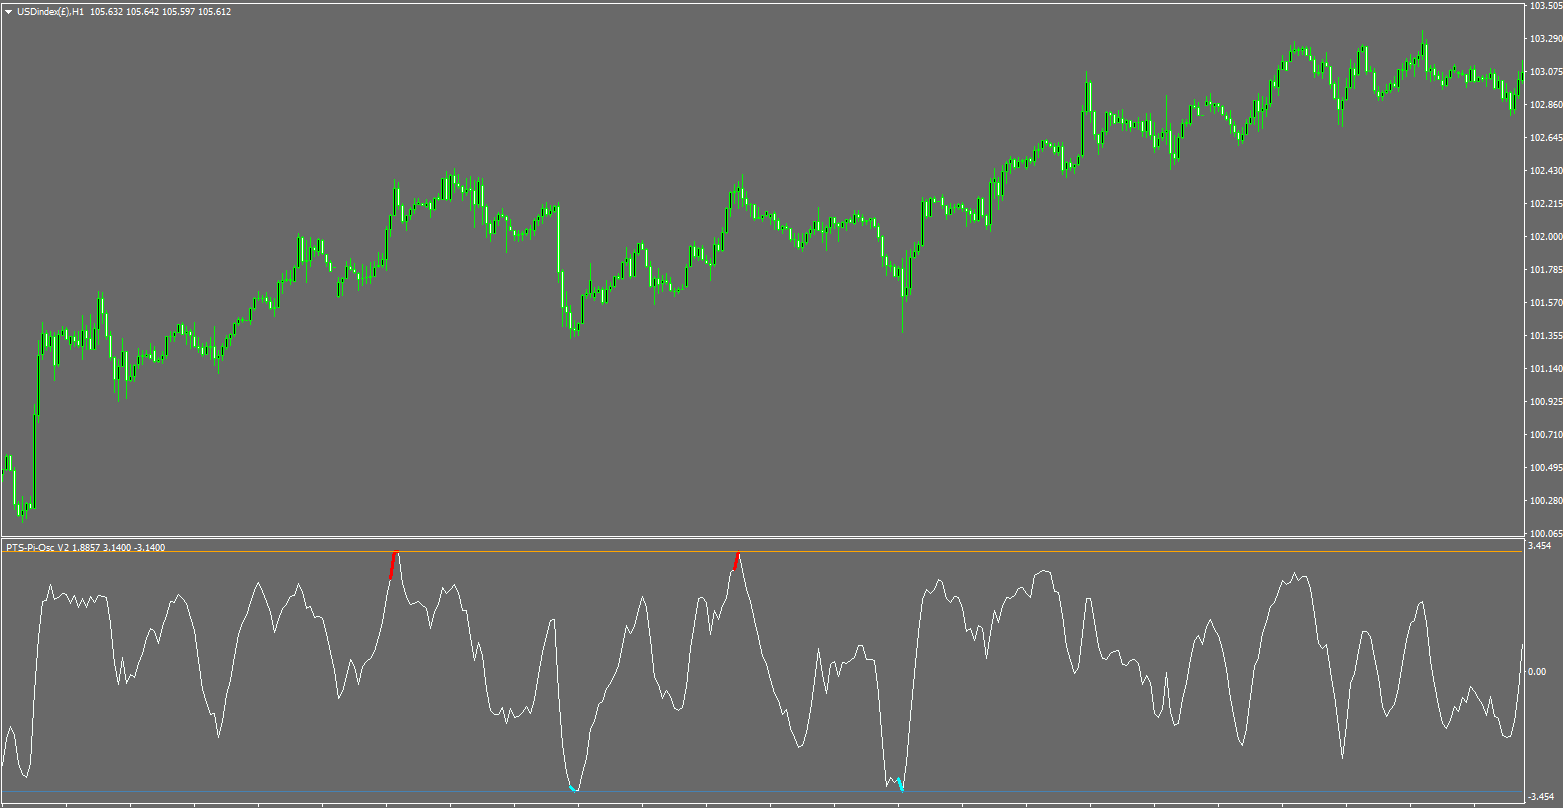
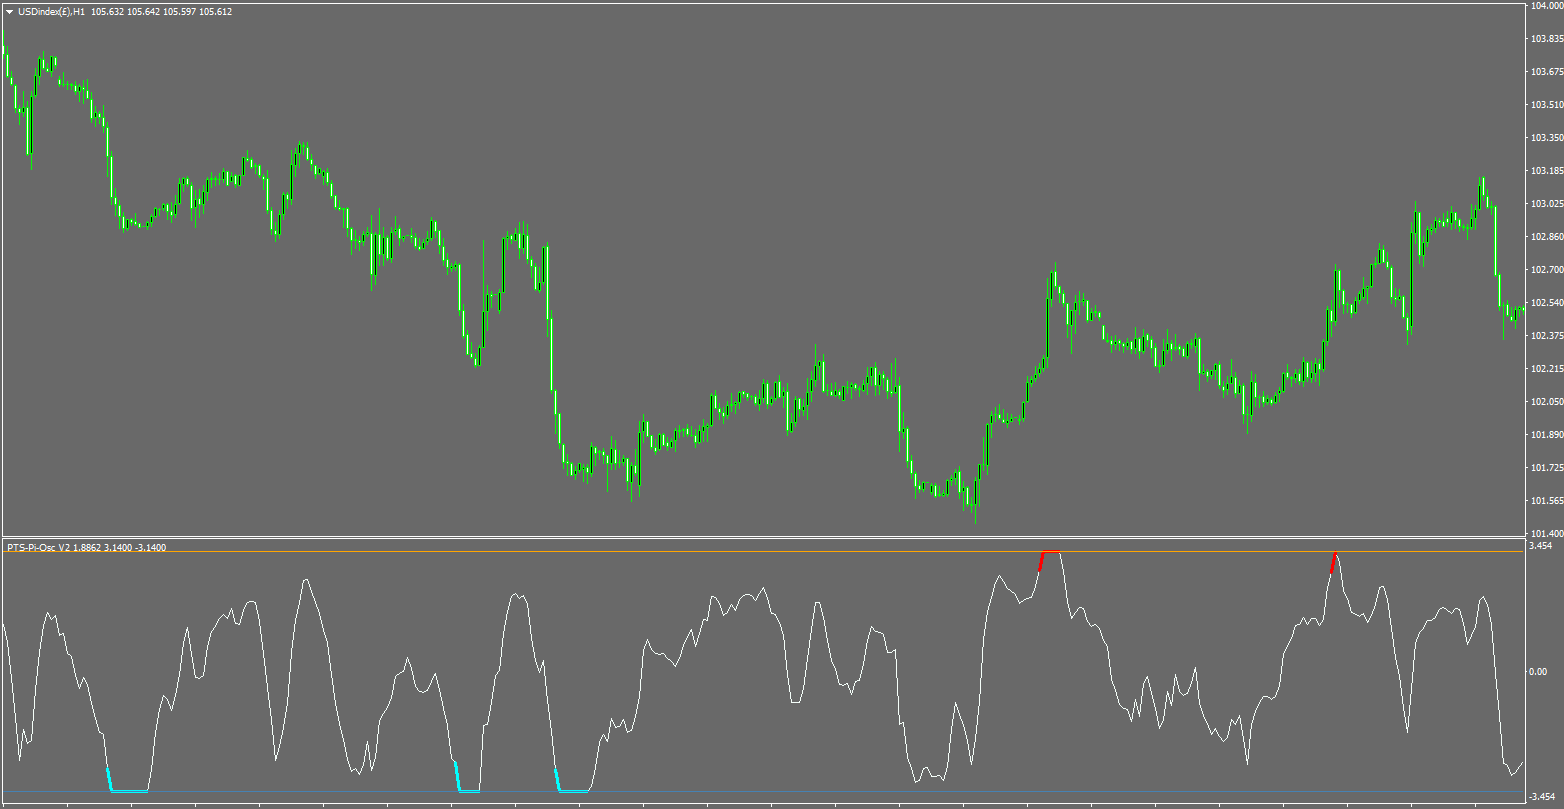
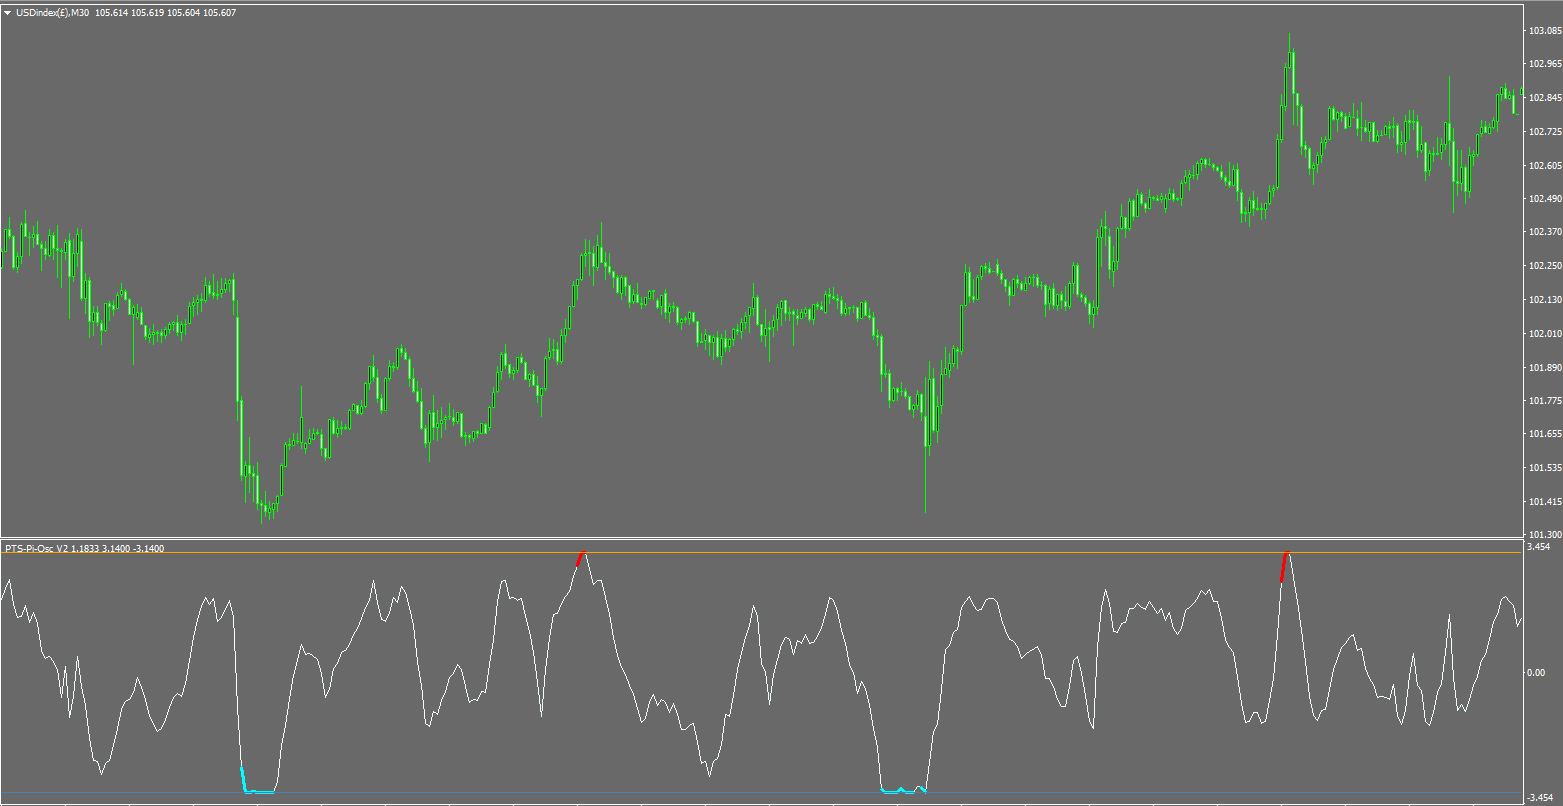
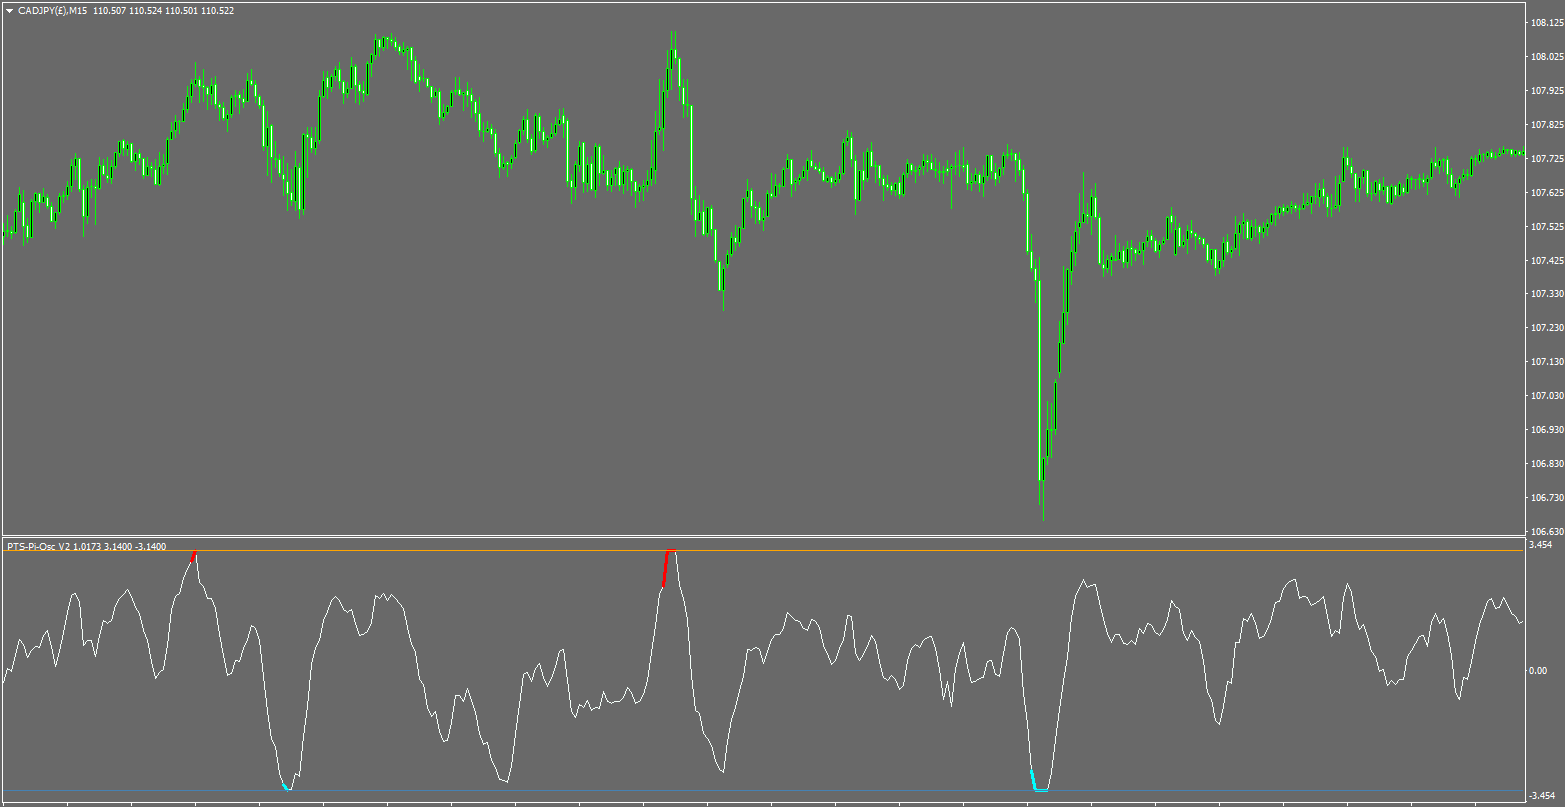
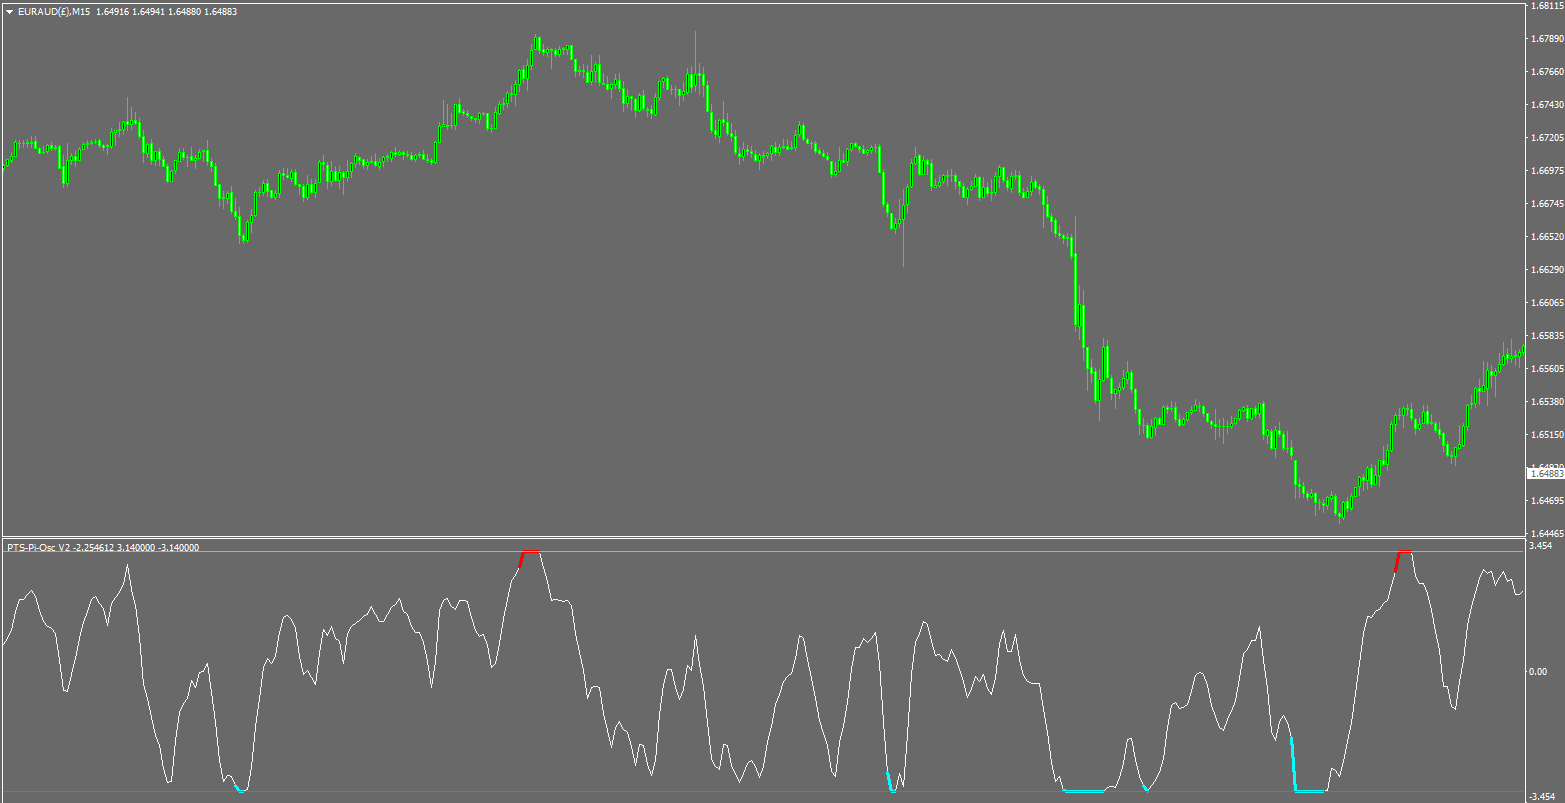
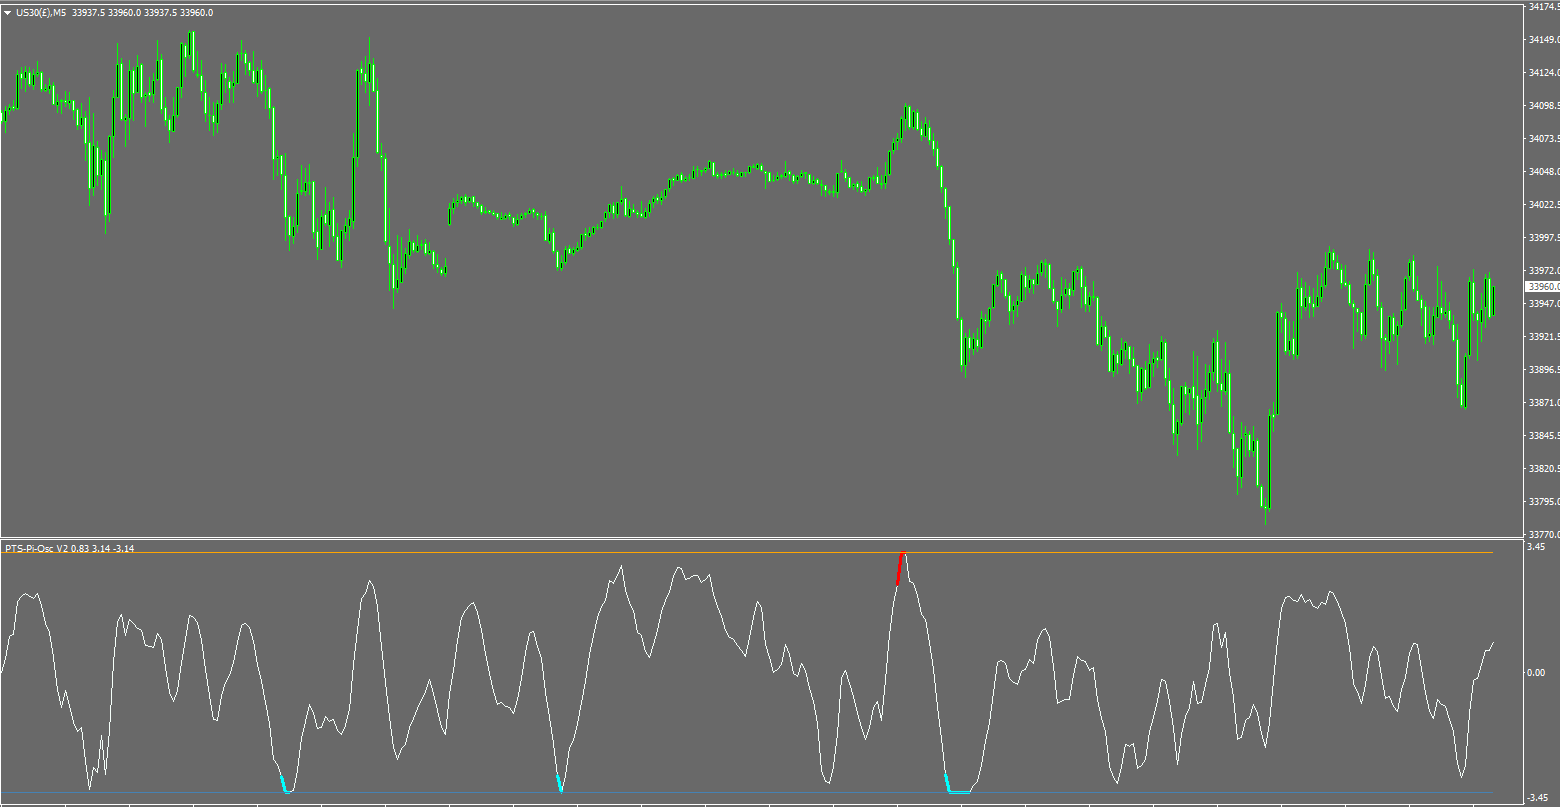
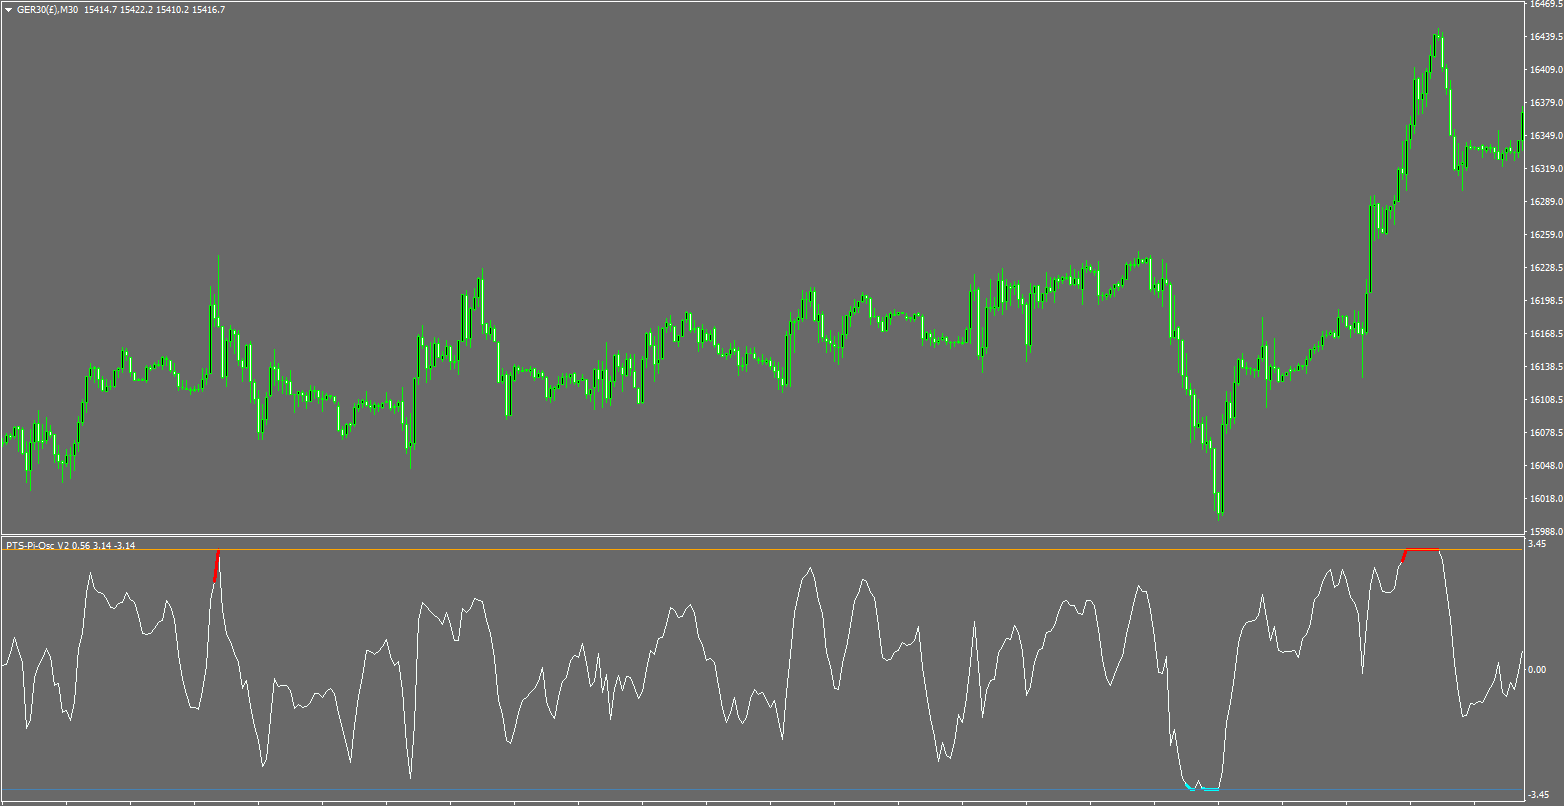
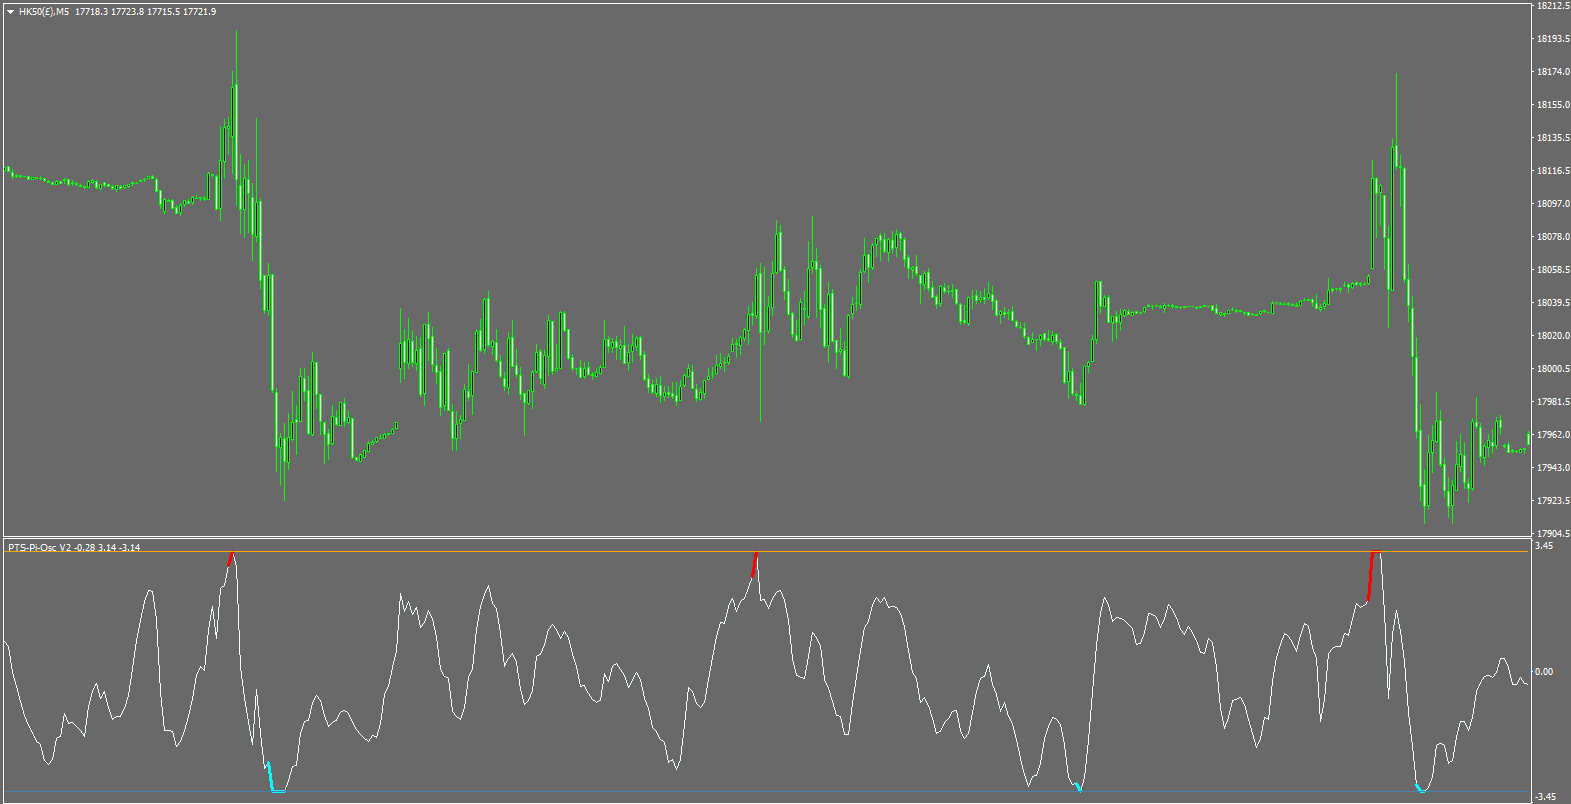
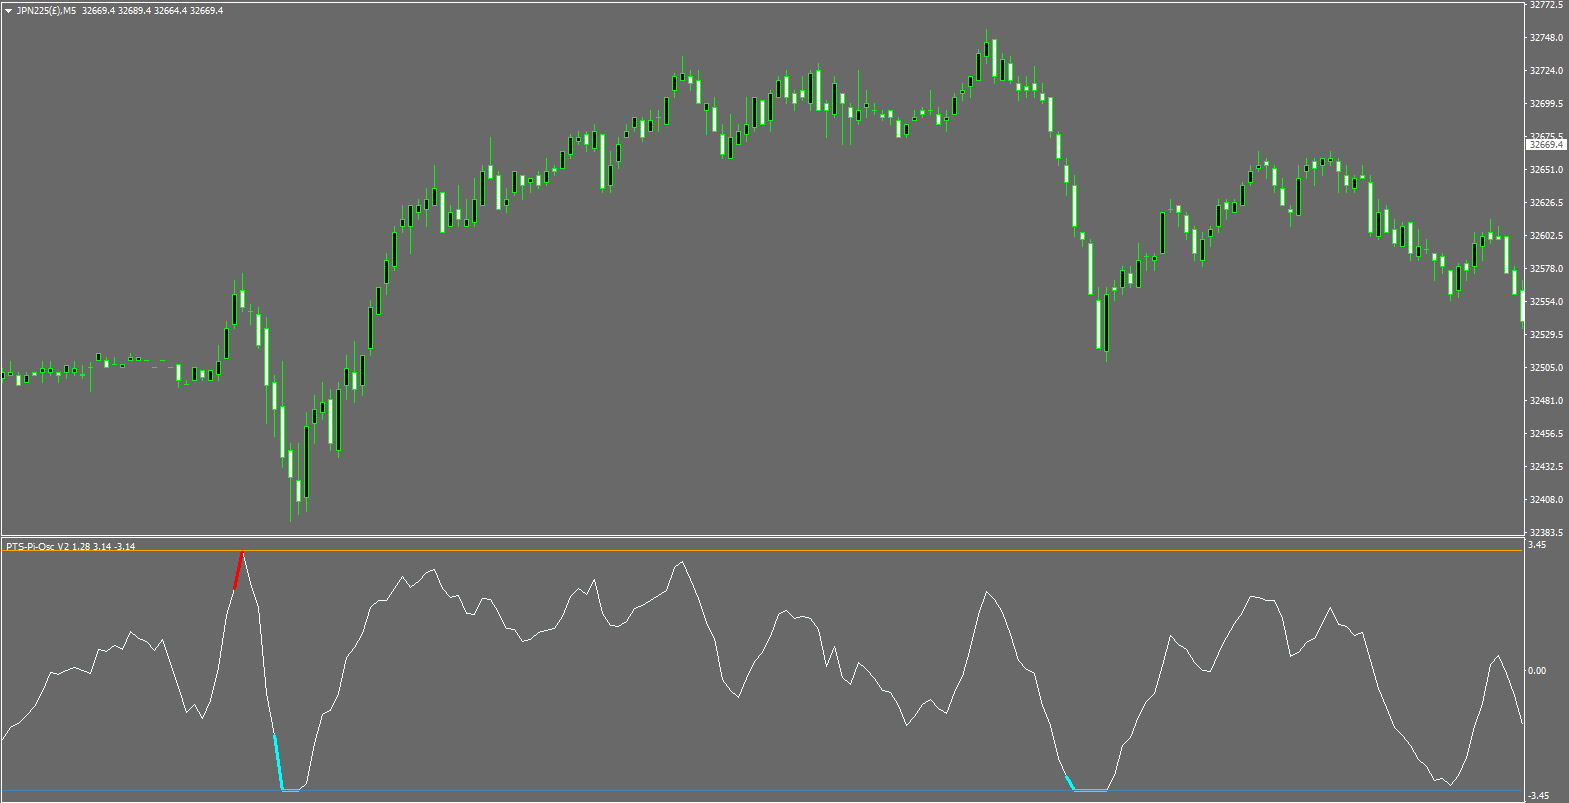
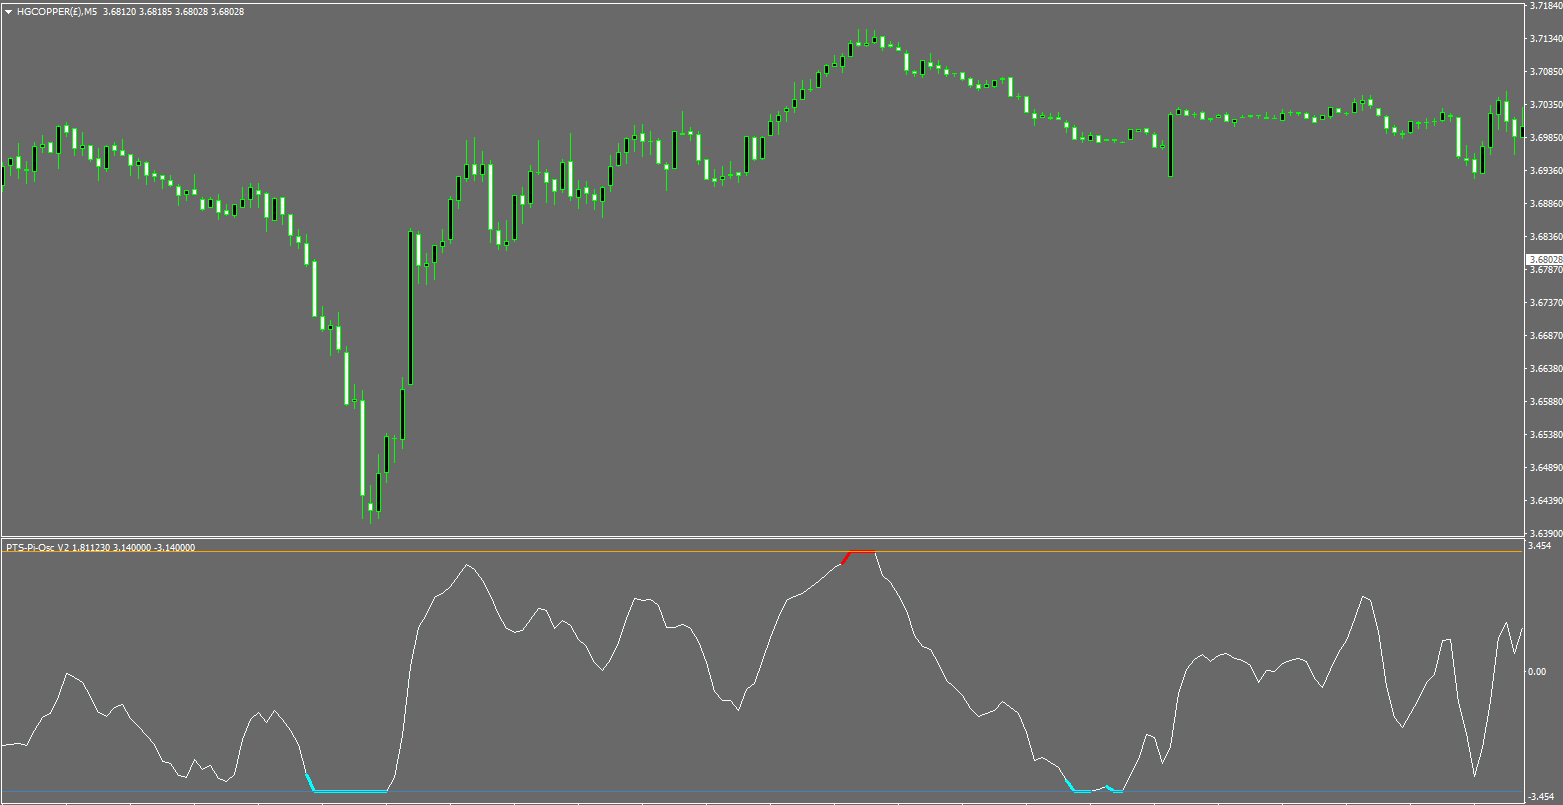
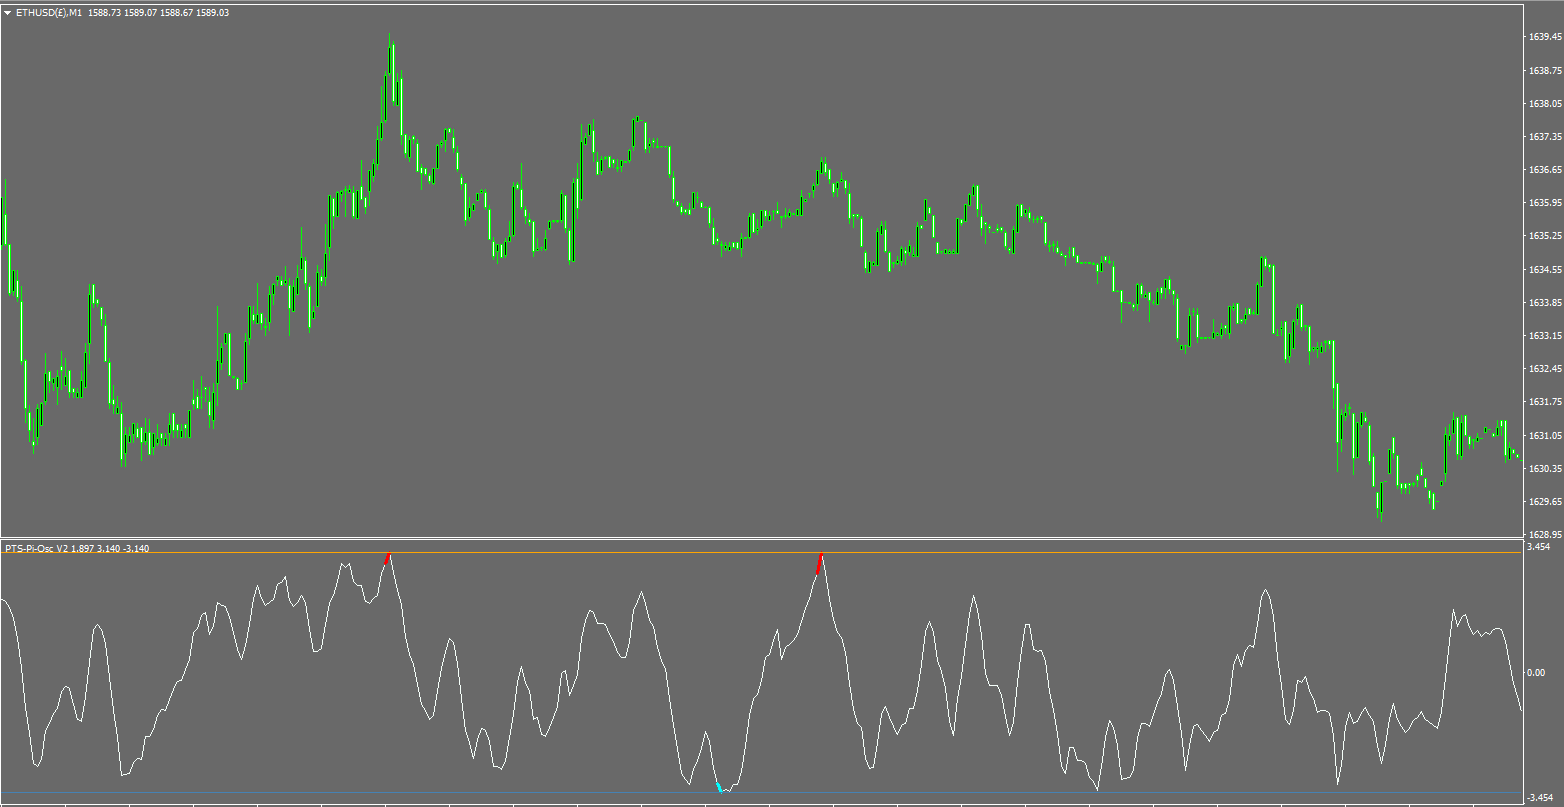
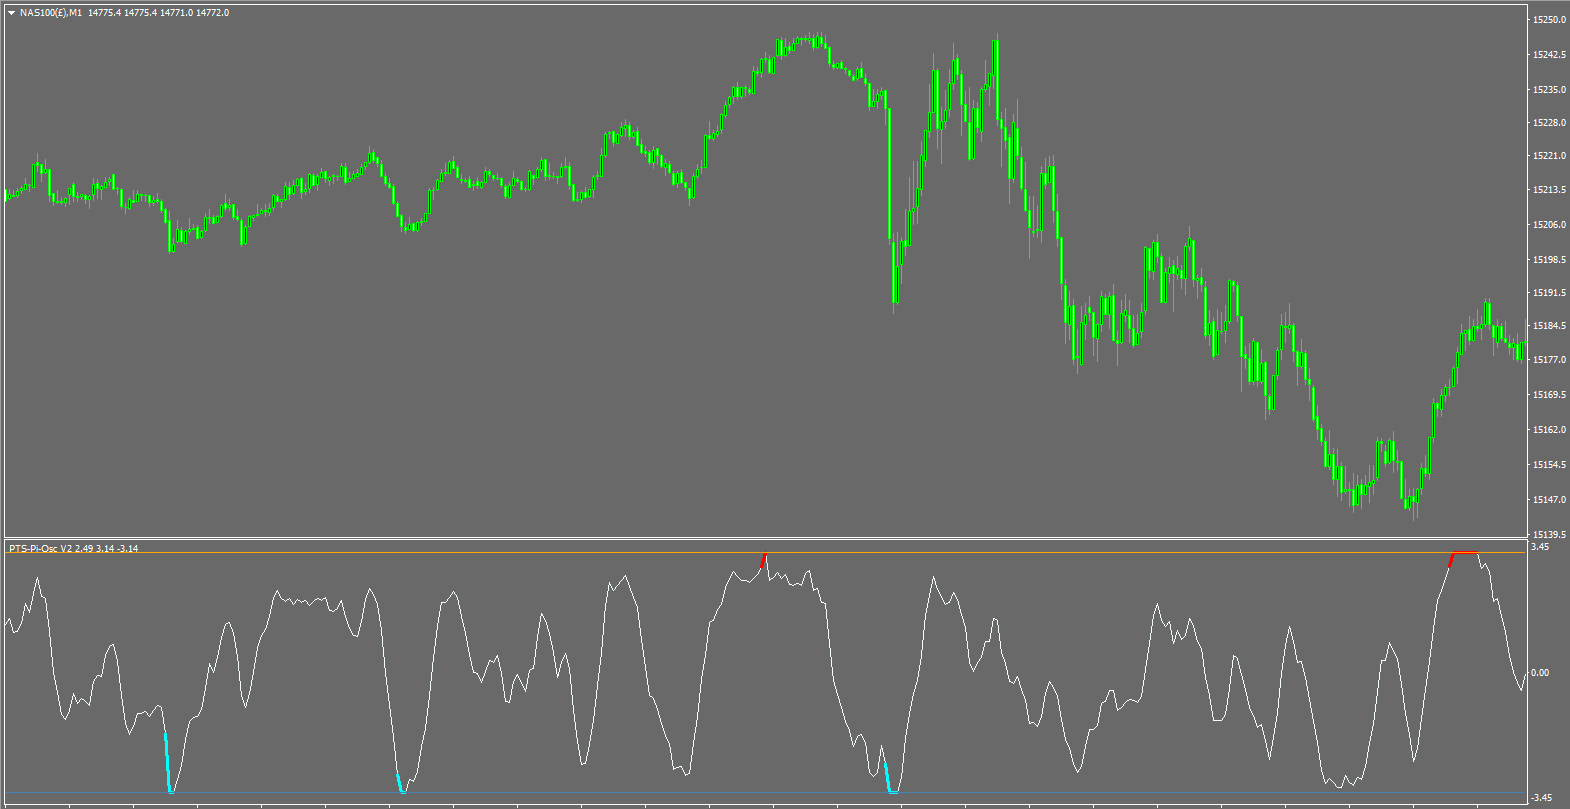
O PTS Pi-Osc V2 é extremamente simples de usar, e os sinais de alerta precoce no topo e na parte inferior são acionados quando + ou - 3,14 é alcançado. O sinal de negociação real que o Oscilador de Índice de Precisão fornece é quando ele se afasta de Pi.

É aconselhável esperar a tendência começar a se reverter antes de considerar o sinal, pois nem todos os sinais se reverterão ao toque de mais ou menos Pi.

Um período de média móvel de aproximadamente 10-20 pode ser usado, e você deve esperar até que ele comece a se inverter antes de fazer negociações.

Alternativamente, você pode usar o maior valor mais alto de aproximadamente 6-20 barras para entrar em negociações longas quando o rebote de -3,14 for observado, e vice-versa para posições curtas.

Destacamos os sinais de forma clara e precisa.

Os alertas estão ativados por padrão, para que você possa estar na sua tela pronto para entrar na próxima negociação.

Este sinal indica uma alta probabilidade de que a próxima barra se reverta. Às vezes, resultará em um grande movimento, outras vezes, serão movimentos menores, e ocasionalmente o sinal falhará e o preço não se reverterá.

Como acontece com a maioria dos métodos de análise técnica, se um sinal falhar em se concretizar, é melhor tratá-lo como um sinal de continuação da tendência existente.

Não há garantia de que todas as negociações serão vencedoras, e os traders devem usar ordens de saída e uma boa gestão de risco para ter sucesso a longo prazo.

As ordens de saída são essenciais com este produto. (Valor sugerido para uma ordem de saída apertada: 2 x ATRs e 5 x ATRs para uma ordem de saída mais ampla).

As negociações podem ser encerradas quando a tendência se reverter novamente, usando o método de entrada de média móvel, mas um pouco mais lentamente para dar à sua posição a melhor chance de se tornar um grande vencedor.

Importante: O Pi-Osc possui 8 regras que devem ser seguidas:

1. Negocie na direção da tendência principal.

2. Encontre o quadro de tempo que funcionou melhor nos testes históricos.

3. Use sempre ordens de saída.

4. Espere a tendência começar a mudar antes de entrar na negociação.

5. Espere o afastamento de Pi.

6. Espere o afastamento de Pi.


7. Espere o afastamento de Pi.

8. Lembre-se das outras sete regras.

Consulte meu site para mais capturas de tela, vídeos e informações. Basta copiar e colar o título deste artigo na busca para encontrá-lo.

Um grande agradecimento ao Iron Condor por trabalhar extensivamente neste código para carregá-lo e executá-lo mais rápido com maior eficiência.
Comentários 1
trick 86
269
trick 86 2023.12.02 18:12 
 

great tool!

Produtos recomendados
About
Tatiana Savkevych
About - Forex indicator. This trend indicator is used to determine the current trend in price movement, making it clear in which direction it is better to open a position: buy or sell. The About trend indicator is displayed on the chart and moves in parallel with the price. The Forex About trend indicator allows you to determine in time a change in the direction of price movement, thereby minimizing the likelihood of capital loss. In trading practice, various combinations of About and other ind
199 USD
Glazz
Andrei Gerasimenko
Glazz is a great mix of standard Bollinger Bands and ZigZag . The essence of the strategy - is the search for extreme points - possible reversals. When building a signal, we use Bands of a large period and a small ZigZag period. When the indicator has calculated the entire value for signal search, it shows an arrow to buy/sell and gives a sound signal. Simply put, ZigZag is looking for a possible reversal, and Bollinger Bands confirms this reversal. The indicator settings are simple. By defau
65 USD
MT4 Indicator Get ahead of the curve with the Wamek Trend Consult indicator . Designed to identify early and continuation trends, this powerful tool empowers traders to enter the market at precisely the right moment, utilizing powerful filters to reduce the number of fake out signals and improve the accuracy of your trades. By precisely analyzing market trends and filtering out false signals, using its advanced algorithms and unparalleled accuracy, the Trend Consult indicator provides traders wi
175 USD
StellaX
Rodolfo Leonardo De Morais
This indicator allows to observe the larger time trends and the stochastic channel on the chart Indicator Parameters KPeriod - %K period. This is the number of time periods used in the stochastic calculation; DPeriod - %D calculation period Slowing - Slow K calculation period maPeriod - Averaging period maMethod - Averaging method maPrice -  Averaging Price LineoverBought2 - line over bought 2 LineoverBought1 -   line over bought 1 LineMidle - line midle LineOverSold1 - line over sold 1 LineOv
90 USD
Purpose Trend
Maryna Shulzhenko
Purpose Trend - analyzes the current trend gives an excellent understanding of which direction the market is aimed at, at what point it should be expected in the near future. Unfortunately, most of the popular indicators in practice give a huge number of false signals, since they all work without any consideration of global trends. That is why in today's conditions, when the market is far from stable price movement, it is almost impossible to build a strategy without using trend indicators. H
119 USD
Point Trend Indicator - Um indicador do nível superior e inferior da tendência, que pode determinar a direção da tendência e indicar seu fortalecimento. A direção da tendência é determinada por pontos redondos; se os pontos estiverem acima da linha zero, a tendência é de alta; se estiver abaixo, a tendência é de baixa. O aumento no movimento direcional é indicado por setas. Possui o único parâmetro para ajuste manual - Duração da direção da tendência.   Possibilidades Funciona em todos os pr
65 USD
The Sensitive Oscillator indicator is designed to find trends. It recognizes trends with its own algorithm and changes color. Finds trends relative to the degree of sensitivity. You can use it in all time periods. You can use this indicator alone or in conjunction with other indicators suitable for your other strategies. Transaction strategies You can do breakout strategies with this indicator. Each time you change colors, you can enter the process. You can use it in the long run by putting st
30 USD
Robust Filter
Aleksey Ivanov
5 (1)
The Robust filter   indicator is based on the robust filtering algorithm developed by the author using the multi-period averaged moving median. The algorithm for this averaging is shown in the last screenshot.                The indicator calculates and shows: 1. The direction of the trend; 2. Entry and exit points of positions; 3. StopLoss   lines calculated from current price probability distributions and selected probability of closing an order by StopLoss before the trend revers
49 USD
Shogun RX
Thamini De Oliveira Feitosa Puntel
10 COPIES AT $ 99 ! After that, the price will be raised to $ 150 . After years of painstaking research and development, we are offering the opportunity for you to have this incredible tool in your automated trading portfolio. SHOGUN RX is a strategy that has a very advanced secret trading algorithm. It is a safe EA that trades using pending orders with a defined Stop Loss, Take Profit and 2 smart Trailing capabilities. LIVE ACCOUNT ---> CLICK HERE Pair: USDJPY TimeFrame: H4. Minimum depo
99 USD
The Unique Trend indicator tracks market trends, ignoring sharp fluctuations and market noise. The indicator is suitable for trading on small timeframes because it ignores sudden price jumps or price corrections due to the reduction of market noise around the average price. The scan at minima and maxima forms the internal boundaries (channel) when calculating the indicator signals. The channel allows you to remove market noise. iMA and iATR are used to generate signals using the author's algo
70 USD
Dark Sniper
Dmitriy Kashevich
Dark Sniper arrow indicator. complete lack of redrawing percentage of correct indicator predictions from 80 85% The arrow indicates the direction of the next candle and the possible direction of the trend in the future.  suitable for small m1 timeframes. It is recommended to open deals from 1 to 2 candles. The signal appears on the last candle advantages of the indicator: 1. leading signals. 2.complete lack of redrawing 3. high signal accuracy.
820 USD
Others
Tatiana Savkevych
The Others indicator is a trend-type indicator. In those moments when you need to make a decision to enter a position and give the trader a direction. The indicator gives the trader the opportunity to visually determine which trend will be present at a particular time interval. These are auxiliary tools for technical analysis of the market. Recommended for use in conjunction with any of the oscillators. The main application of the Others indicator is to generate buy and sell signals. Determin
89 USD
SuperRSI
Andriy Sydoruk
The SuperRSI indicator is an advanced index of internal strength. The indicator shows not the relative strength of the trading instruments being compared, but the internal strength of a single instrument, therefore, it is the “Internal Strength Index”. This is an advanced form of the SuperRSI indicator. It converts the signal so that low-frequency components are delayed much more than high-frequency components. In general, the data of the last bar have more weight than previous data, like an exp
49 USD
"Trend reversal ml4" is a unique indicator designed to determine the moments of price reversal in real time. This is a ready-made trading system for Metatrader4. The indicator does not redraw its values! Based on advanced algorithms and technical analysis, this indicator provides you with clear signals about possible market entry and exit points, helping you make informed decisions. Advantages of the indicator: high signal accuracy. the indicator itself shows the trader whether it is configur
35 USD
The King of Forex Trend Cloud Indicator is a trend following indicator based on moving averages. The Indicator is meant to Capture both the beginning and the end of a trend. This indicator can be used to predict both short and long terms market trends.  The king of Forex Trend Cloud if paired together with the King of Forex Trend Indicator can give a broad picture in market analysis and forecasts. I have attached images for both the  The king of Forex Trend Cloud on its own and  The king of Fore
335 USD
HC candlestick pattern is a simple and convenient indicator able to define candle patterns.‌ Candlestick charts are a type of financial chart for tracking the movement of securities. They have their origins in the centuries-old Japanese rice trade and have made their way into modern day price charting. Some investors find them more visually appealing than the standard bar charts and the price action is easier to interpret. Hc candlestick pattern is a special indicator designed to find divergence
60 USD
Indicator for binary options arrow is easy to use and does not require configuration works on all currency pairs, cryptocurrencies buy signal blue up arrow sell signal red down arrow tips do not trade during news and 15-30 minutes before their release, as the market is too volatile and there is a lot of noise it is worth entering trades one or two candles from the current period (recommended for 1 candle) timeframe up to m 15 recommended money management fixed lot or fixed percentage of the depo
100 USD
The Best Choice compra y venta
Sandro Israel Hernandez Zamora
¿Has escuchado decir que la tendencia es tu amiga? pues nada es mas cierto en el mundo del trading. Este indicador analiza las tendencias y su fuerza para que puedas aprovecharlas y utilizamos un conjunto de indicadores como RSI, %W, MACD y EMAS para analizar el mercado y sus movimientos, por lo que podrás mantener tu gráfico limpio sabiendo que todos estos indicadores los tienes en uno solo. Este, como cualquier indicador, no representa una certeza de compra o venta definitiva, por lo siempre r
40 USD
Scalping Line is an advanced average that we created for use in our trading strategy. The essence of our trading strategy is to open a buy deal when the line is blue and the price drops below the line. Or open a sell deal when the price rises above the line, and the color of the line is red. Thus, we open deals when the price for a short distance goes in the opposite direction from the general trend. We close the deal when we get the minimum profit. We trade on the timeframe M30 or H1. Better to
69 USD
Leo Trend is a signal indicator that shows the market entry points, as well as the trend direction and flat on the chart in the form of arrows and lines. Leo Trend will be useful both for beginners creating a trading strategy, and for professionals to integrate into ready-made trading systems. Leo Trend works without redrawing and without significant delays. The operation of the indicator is demonstrated in the video. In addition, you can test this indicator in the strategy tester free of charge
69 USD
Timeframe Separator MT4
Alexandre Borela
5 (1)
If you like this project, leave a 5 star review. Often times we are using brokers that are outside of the GMT-0 timezone, this not only complicates things, but, it can make seeing when a trading session starts a bit more difficult than it should. This indicator allows you to set a timezone offset it will draw a vertical line for the: Day. Week. Month. Quarter. year.
FREE
The Pearson Trend!! My name is Murat Yazici. I have B.Sc. Statistics and M.Sc. Quantitative Methods degrees. I have several scientific papers, conference presentations in Texas, Toronto, London, Istanbul, books and book chapters studies, and many projects about mathematical and statistical modelling. I am also journal reviewer at some scientific journals. What is The Pearson Trend's Logic? It is based on   A Fuzzy Model  developed by me.  Vague or fuzzy data and application several fields,
120 USD
Reincarnations
Maryna Shulzhenko
The Reincarnations trend indicator is used to determine the strength and direction of a trend and to find price reversal points. This tool scans the market looking for the correct entry. You can see and evaluate it yourself, perhaps it will suit you for a number of tasks related to forecasting price movements. It uses only price data and analytics to calculate entry points. Does not use auxiliary indicators. It has two parameters for customization. Indicator setting. Interval - price analysis
149 USD
The standard Relative Strength Index (RSI) indicator, in which we have added notification functions to the phone and email. In the indicator settings, you can specify the upper and lower limits of the indicator, upon reaching which the indicator will send you a notification to your phone and email. The notification will be sent in the following format: currency pair + timeframe + notification time. If you use this free standard indicator in your trading strategy, then our improved version of th
69 USD
Indicator Candle Direction
Veridiana Adorno Kendrick
Indicador simples que apoia os tomadores de decisão. Você terá o direcionamento do mercado para os distintos tempos gráficos em sua na tela. Isso permitirá que você tenha mais um cenário para analisar antes de abrir suas ordens. Caso queira mais detalhes para adicionarmos ao gráfico, entre em contato mencionando. Multi moedas  e que informam as direções para multi-timeframes! Aproveite!
30 USD
Trend Rever
Vitalii Zakharuk
The Trend Rever indicator uses two lines of different colors to display buy or sell signals. The first of these lines is red and the second is blue. When changing the color of the lines, an arrow is also displayed, which indicates which deal to open, buy or sell. A simple but effective system for determining the Forex trend. The algorithm takes into account the measurement of prices, and this method also focuses on the measurement of each of the price drops - which gives more detailed informati
69 USD
OnixPoint
Jhonsep Lopez
The OnixPoint indicator efficiently detects the most appropriate entry in trend with the shorter stoploss. It is based on finding patterns of tasset trend change with respect to future price estimate. It works for any currency pair. The indicator is designed to facilitate decision-making at position entries. The development team is constantly improving the functionality of the indicator. Benefits of the Indicator Does not repaint. Works on all currencies. Works on all timeframes. It's easy to
30 USD
Market Session Pro MT4
Kambiz Shahriarynasab
5 (1)
The  Market Sessions Indicator for MT5 helps you  predict market turnarounds  by detecting major supply and demand areas. These pivot points tend to occur after a new session has started and the previous one is still open. It is also used to gauge how many points or pips the market moves on average during a session. This helps us to place better our take profits and stop losses. The indicator works on all forex pairs, gold, silver, commodities, stocks, indices and any other instrument that your
50 USD
Supplement for Alpha Trend Spotter (ATS) Indicator: https://www.mql5.com/en/market/product/8590 This indicator acts by price action. Use it when ATS shows clear Bullish or Bearish Trend for finding the strongest trend each day. Suitable for timeframes M5, H1, H4 and D1. Suitable for Binary Option 5 minutes signal. How to Use: RED Arrow means Sell GREEN Arrow means Buy
30 USD
Warning: Our product works with 28 symbols. The average accuracy level of the signals is 99%. We see signals below 15 pips as unsuccessful. Technique Signal   indicator is designed for signal trading. This indicator generates trend signals. It uses many algorithms and indicators to generate this signal. It tries to generate a signal from the points with the highest trend potential. This indicator is a complete trading product. This indicator does not need any additional indicators. The
99 USD
Os compradores deste produto também adquirem
TrendMaestro
Stefano Frisetti
5 (1)
note: this indicator is for METATRADER4, if you want the version for METATRADER5 this is the link: TRENDMAESTRO recognizes a new TREND in the bud, he never makes mistakes. The certainty of identifying a new TREND is priceless. DESCRIPTION TRENDMAESTRO identifies a new TREND in the bud, this indicator examines the volatility, volumes and momentum to identify the moment in which there is an explosion of one or more of these data and therefore the moment in which prices have strong probability of f
397 USD
Actualmente 20% OFF ! A melhor solução para qualquer novato ou comerciante especializado! Este software de painel de instrumentos está a funcionar em 28 pares de moedas. É baseado em 2 dos nossos principais indicadores (Advanced Currency Strength 28 e Advanced Currency Impulse). Dá uma grande visão geral de todo o mercado Forex. Mostra valores avançados de força da moeda, velocidade de movimento da moeda e sinais para 28 pares de divisas em todos os (9) períodos de tempo. Imagine como a sua
199 USD
FX Power MT4 NG
Daniel Stein
5 (2)
Receba a sua atualização diária do mercado com detalhes e screenshots através do nosso Morning Briefing aqui no mql5 e no Telegram ! O FX Power MT4 NG é a próxima geração do nosso medidor de força de moeda muito popular de longa data, o FX Power. E o que é que este medidor de força da próxima geração oferece? Tudo o que adorou no FX Power original MAIS Análise de força GOLD/XAU Resultados de cálculo ainda mais precisos Períodos de análise configuráveis individualmente Limite de cálculo personal
169 USD
Cycle Sniper
Elmira Memish
4.41 (34)
NEW YEAR SALE PRICE FOR LIMITED TIME!!! Please contact us after your purchase and we will send you the complimentary indicators to complete the system . Cycle Sniper is not a holy grail but when you use it in a system which is explained in the videos, you will feel the difference. If you are not willing to focus on the charts designed with Cycle Sniper and other free tools we provide, we recommend not buying this indicator. We recommend watching the videos about the indiactor and system befor
199 USD
FX Volume
Daniel Stein
4.59 (34)
Receba a sua atualização diária do mercado com detalhes e screenshots através do nosso Morning Briefing aqui no mql5 e no Telegram ! O Volume FX é o PRIMEIRO e ÚNICO indicador de volume que fornece uma visão REAL do sentimento do mercado do ponto de vista de um corretor. Ele fornece uma visão incrível de como os participantes do mercado institucional, como corretores, estão posicionados no mercado Forex, muito mais rápido do que os relatórios COT. Ver essas informações diretamente no seu gráfi
249 USD
GOLD Impulse with Alert
Bernhard Schweigert
4.43 (7)
Este indicador é uma super combinação dos nossos 2 produtos Advanced Currency IMPULSE with ALERT  +   Currency Strength Exotics . Funciona para todos os períodos de tempo e mostra graficamente impulso de força ou fraqueza para as 8 principais moedas mais um Símbolo! Este Indicador é especializado para mostrar a aceleração da força da moeda para quaisquer símbolos como Ouro, Pares Exóticos, Commodities, Índices ou Futuros. É o primeiro do seu género, qualquer símbolo pode ser adicionado à
149 USD
MTF Supply Demand Zones
Georgios Kalomoiropoulos
4.83 (23)
Próxima geração de zonas automatizadas de oferta e demanda. Algoritmo novo e inovador que funciona em qualquer gráfico. Todas as zonas estão sendo criadas dinamicamente de acordo com a ação do preço do mercado. DOIS TIPOS DE ALERTAS --> 1) QUANDO O PREÇO ATINGE UMA ZONA 2) QUANDO UMA NOVA ZONA É FORMADA Você não recebe mais um indicador inútil. Você obtém uma estratégia de negociação completa com resultados comprovados.     Novas características:     Alertas quando o preço ati
149 USD
CFF Banks Liquidity
Abdalla Mohamed Kandil
CFF Banks Liquidity     Entry signals without repainting or delays     Error-free opening of trades     Provides signals for any direction sell & Buy Join Our Public Telegram Channel for latest updates and set files.   | Our Telegram Channel How does the CFF Banks Liquidity Works? Our CFF Banks Liquidity trading system based on a very accurate "Trend-Following" Trading Strategy. Here's how to Start using our System 1.      Buy and install the indicator in your terminal. Ask the guide.
313 USD
Scalping and Binary Signal Detector - Indicador de scalping que fornece sinais direcionais para abertura de posições ao longo da tendência. O indicador é um sistema de negociação completo que pode ser usado para Forex e opções binárias. O sistema de algoritmos permite reconhecer movimentos intensos de preços em diversas barras consecutivas. O indicador fornece vários tipos de alertas para setas. Funciona em quaisquer instrumentos de negociação e prazos (recomendado M5 ou superior). Como u
159 USD
Price Action Entry Alerts
Stephen Sanjeeve Sahayam
5 (2)
Este indicador analisa cada barra de pressão de compra ou venda e identifica 4 tipos de padrões de velas com o maior volume. Essas velas são filtradas usando vários filtros lineares para mostrar sinais de compra ou venda. Os sinais funcionam melhor, em conjunto com a direção do período de tempo mais alto e quando negociados durante as horas de alto volume. Todos os filtros são personalizáveis ​​e funcionam de forma independente. Pode visualizar sinais de uma única direção com o clique de um bot
225 USD
Enigmera
Ivan Stefanov
5 (1)
ENIGMERA: O núcleo do mercado https://www.enigmera.com Introdução Este indicador e sistema de negociação é uma abordagem notável aos mercados financeiros. ENIGMERA utiliza os ciclos fractais para calcular com precisão os níveis de suporte e resistência. Mostra a autêntica fase de acumulação e dá direcções e objectivos.  Um sistema que funciona quer estejamos numa tendência ou numa correção.  Como é que funciona? O ENIGMERA é composto por três linhas: a linha de suporte/resistência, a linha
1 800 USD
ICT, SMC, Smart Money Concept, Suporte e Resistência, Análise de Tendências, Ação do Preço, Estrutura de Mercado, Blocos de Ordens, Blocos de Rompimento, Mudança de Momentum, Desbalanceamento Forte, HH/LL/HL/LH, Gap de Valor Justo, FVG, Zonas de Prêmio e Desconto, Retração de Fibonacci, OTE, Liquidez Compradora, Liquidez Vendedora, Vazios de Liquidez, Sessões de Mercado, NDOG, NWOG, Bala de Prata, modelo ICT. No mercado financeiro, uma análise de mercado precisa é crucial para os investidores.
149 USD
Smart Ai Levels  Accumulation & Distribution indicator Smart Ai Levels are Ai controlled indicator which is based on Wyckoff Price cycle theory . It automatically scans the Accumulation & Distribution phases on chart and Ai draws the possible areas before Mark up and Mark down which acts as hot zones and can be traded with confirmation to catch those big price movements . It's a great tool for both Reversal and Breakout Trades suitable to all Trading Styles such as Scalping - Intraday - Swing 
249 USD
Gartley Hunter Multi MT4
Siarhei Vashchylka
4.67 (3)
Gartley Hunter Multi - An indicator for searching for harmonic patterns simultaneously on dozens of trading instruments and on all classic timeframes: (m1, m5, m15, m30, H1, H4, D1, Wk, Mn). Manual (Be sure to read before purchasing) | Version for MT5 Advantages 1. Patterns: Gartley, Butterfly, Shark, Crab. Bat, Alternate Bat, Deep Crab, Cypher 2. Simultaneous search for patterns on dozens of trading instruments and on all classic timeframes 3. Search for patterns of all possible sizes. Fr
149 USD
Introduction to Fractal Pattern Scanner Fractal Indicator refers to the technical indicator that makes use of the fractal geometry found in the financial market. Fractal Pattern Scanner is the advanced Fractal Indicator that brings the latest trading technology after the extensive research and development work in the fractal geometry in the financial market. The most important feature in Fractal Pattern Scanner is the ability to measure the turning point probability as well as the trend probabi
180 USD
"Supply / Demand Zones" The concepts of supply and demand zones   are undoubtedly two of the most highly discussed attributes of technical analysis. Part of analysing chart of pattern , these terms are used by traders   to refer to price levels i n charts that tend to act as barriers, preventing the price of an asset from getting pushed in a certain direction. At first, the explanation and idea behind identifying these levels seems easy, but as you'll find out, supply and demand zones can co
199 USD
NNFX Strength System
Benjamin Joshua Nash
3 (1)
A complete NNFX algorithm in one indicator. NEW: Inbuilt backtester shows historical trade stats on the chart to show which pairs are most profitable. Don't be fooled. It's not enough to simply match a strong and weak currency to trade successfully with a strength meter, you need to know the intimate details of the relationship between two currencies. This is exactly what we've done with NNFX Strength, giving you all the information you need to make solid trading decisions. Years in the makin
150 USD
TPA True Price Action indicator reveals the true price action of the market makers through 100% non-repainting signals (except early signals mode) strictly at the close of a candle! TPA shows entries and re-entries, every time the bulls are definitely stronger than the bears and vice versa. Not to confuse with red/green candles. The shift of power gets confirmed at the earliest stage and is ONE exit strategy of several. There are available now two free parts of the TPA User Guide for our custo
168 USD
Volume by Price MT4
Brian Collard
5 (14)
The Volume by Price Indicator for MetaTrader 4 features Volume Profile and Market Profile TPO (Time Price Opportunity). Get valuable insights out of currencies, equities and commodities data. Gain an edge trading financial markets. Volume and TPO histogram bar and line charts. Volume Footprint charts. TPO letter and block marker charts including split structures. Positioning and styling options to suit the user's needs and context. Highlight Volume Profile and Market Profile TPO Point of Contro
259 USD
Difícil de encontrar e com pouca frequência, as divergências são um dos cenários de negociação mais confiáveis. Este indicador localiza e verifica automaticamente divergências ocultas e regulares usando seu oscilador favorito. [ Guia de instalação | Guia de atualização | Solução de problemas | FAQ | Todos os produtos ] Fácil de trocar Encontra divergências regulares e ocultas Suporta muitos osciladores conhecidos Implementa sinais de negociação baseados em fugas Exibe níveis adequados de
249 USD
The elite (V3) multi-indicator suite from JoaquinTrading specifically geared towards Forex & binary options, including regulated exchanges such Nadex, Cantor Exchange, and other binary option brokers. The Probability Tool Suite Elite will provide the given win/loss outcome probabilities of up to 10 strike levels, a specific expiration duration, based on a combination of up to 16 indicators, rules, or conditions and derivative behavior (i.e. expiry, touch, touch & retrace).  Using this indicat
149 USD
Hello Dear Trader, Today Im Telling You About The "Golden Scalp System V1 " Metatrader4 Golden Scalp System Scalper with EMA   This is a  Scalper strategy   based on ( Exponential moving average) EMA . Time frame: H1 Pair: EUR/USD, GBP/USD,AUD/USD XAU/USD Platform Mt4   Indicators for Scalper with Ema: 300  EMA (Exponential Moving Average) ; 500 EMA (Expontial Moving Average); Stochastic   (5,3,3)   Long Entry 1) 300  EMA   > 500  EMA . 2) Find significant levels of support. 3) Wait for
500 USD
Best Currency Strength Indicator
Tumelo Patrick Rakotsoane
4.54 (46)
Advanced Currency Strength Indicator The Advanced Divergence Currency Strength Indicator. Not only it breaks down all 28 forex currency pairs and calculates the strength of individual currencies across all timeframes , but, You'll be analyzing the WHOLE forex market in 1 window (In just 1 minute) . This indicator is very powerful because it reveals the true movements of the market.  It is highly recommended to  analyze charts knowing the performance of individual currencies or the countries ec
149 USD
PZ Support Resistance
PZ TRADING SLU
3.33 (3)
Cansado de traçar linhas de suporte e resistência? A Resistência de suporte é um indicador de período múltiplo que detecta e plota automaticamente linhas de suporte e resistência no gráfico com um toque muito interessante: conforme os níveis de preços são testados ao longo do tempo e sua importância aumenta, as linhas se tornam mais espessas e mais escuras. [ Guia de instalação | Guia de atualização | Solução de problemas | FAQ | Todos os produtos ] Melhore sua análise técnica da noite para o d
149 USD
Introduction to Chart Pattern MT Chart Pattern MT is a chart pattern scanner to detect the triangle pattern, falling wedge pattern, rising wedge pattern, channel pattern and so on. Chart Pattern MT uses highly sophisticated chart pattern detection algorithm. However, we have designed it in the easy to use with intuitive user interface. Chart Pattern MT will show all the patterns in your chart in the most efficient format for your trading. You do not have to do tedious manual pattern detection an
180 USD
This indicator will help you identify the key zones needed for The Silver Bullet Strategy which are:  The three time-windows the ICT mentioned in the strategy Window 1: 3 AM and 4 AM New York time Window 2: 10 AM and 11 AM New York Time Window 3: 2 PM to 3 PM New York Time Bullish and bearish supply and demand zones which will help you identify FVG inside those time windows T he previous day's high and low, draw on liquidity The indicator does not plot the FVGs to avoid cluttering the chart  Exi
200 USD
Full STO
Roman Smoroda
Indicador STO completo (inclui todas as versões dos três indicadores STO: Premium, Gold, Silver) - STABLE TRADE OPTION foi concebido para a negociação automática de opções binárias.  LER COM ATENÇÃO!!!!! IMPORTANTE Num terminal, criar dois modelos com expirações diferentes, um modelo para as 18:01, 18:02 com expirações de 1 a 15 minutos e um modelo para as 22:00 com expirações de 10 a 20 minutos. Taxa de vitórias: 71% nos últimos 5 anos Gestão de dinheiro: 0,3% do depósito Esta versão
500 USD
Este indicador é um indicador de análise automática de onda perfeito para negociação prática! A definição padronizada da banda não é mais uma onda de pessoas diferentes, e o desenho de interferências feitas pelo homem é eliminado, o que desempenha um papel fundamental na análise rigorosa da abordagem. =》Increase the choice of international style mode, (red fall green rise style)             Atualmente comprando desconto!   Conteúdo do índice: 1         Onda básica:   Primeiro, encontram
188 USD
Estratégia Sniper criada para fornecer os melhores pontos de entrada para todos os pares e todos os prazos e sempre se movendo na direção da tendência com base na ação do preço. uma vez que você domine a estratégia, ela permitirá que você tenha mais confiança em sua negociação, para que você saiba quando abrir e fechar sua negociação com lucro máximo, porque está mostrando o início da tendência com várias entradas, portanto, se você perder a entrada no início de a estratégia Sniper de tendênc
750 USD
**Apresentando o Binary Smart System: Seu Companheiro Definitivo de Negociação** O Binary Smart System não é apenas um indicador; é uma ferramenta de negociação sofisticada projetada meticulosamente para capacitar os traders com precisão pontual e sinais oportunos em diversos mercados. Construído com base em algoritmos de última geração e uma coleção abrangente de indicadores técnicos, este sistema é a chave para desbloquear o sucesso na negociação. **Componentes do Indicador:** 1. **Médi
450 USD
Mais do autor
PTS - Buscador de Compras por Divergência da Precision Trading Systems O Buscador de Divergência de Precisão foi projetado para encontrar fundos de mercado com precisão milimétrica e frequentemente o faz. Na análise técnica, a arte de escolher fundos geralmente é muito mais fácil do que escolher topos; este item foi projetado precisamente para essa tarefa. Após a identificação de uma divergência de alta, é prudente esperar que a tendência se reverta antes de comprar. Você pode usar um mínim
147 USD
O Indicador de Venda PTS Divergence Finder por Roger Medcalf - Precision Trading Systems. Este indicador fornece apenas Indicações de Venda - Baixa. Em primeiro lugar, muitas vezes me perguntaram por que não forneci um indicador de divergência de venda enquanto felizmente fornecia um localizador de divergência de sinal de compra por muitos anos. Eu dei a resposta de que as divergências de venda são menos confiáveis do que as divergências de compra, o que ainda é verdade. Algumas soluções foram e
147 USD
Demand Index
PrecisionTradingSystems
Código do PTS Demand Index pela Precision Trading Systems O Demand Index foi criado por James Sibbet e utiliza um código complexo para simplificar a interpretação de volume e preço como uma combinação. Entender volumes nunca é uma tarefa fácil, mas esta bela peça de programação certamente torna isso muito mais simples. Existem várias maneiras pelas quais este indicador pode beneficiar traders e investidores. Divergências (Como um indicador líder) Após estudar muitos indicadores técn
75 USD
O Oscilador de Índice de Precisão (Pi-Osc) de Roger Medcalf da Precision Trading Systems A Versão 2 foi cuidadosamente reconfigurada para carregar rapidamente em seu gráfico, e algumas outras melhorias técnicas foram incorporadas para aprimorar a experiência. O Pi-Osc foi criado para fornecer sinais precisos de temporização de negociações projetados para encontrar pontos de exaustão extremos, os pontos para os quais os mercados são forçados a ir apenas para tirar as ordens de todos. Este
147 USD
PTS - Buscador de Compras por Divergência da Precision Trading Systems O Buscador de Divergência de Precisão foi projetado para encontrar fundos de mercado com precisão milimétrica e frequentemente o faz. Na análise técnica, a arte de escolher fundos geralmente é muito mais fácil do que escolher topos; este item foi projetado precisamente para essa tarefa. Após a identificação de uma divergência de alta, é prudente esperar que a tendência se reverta antes de comprar. Você pode usar um mínim
147 USD
PTS Demand Index MT5
PrecisionTradingSystems
Código do PTS Demand Index pela Precision Trading Systems O Demand Index foi criado por James Sibbet e utiliza um código complexo para simplificar a interpretação de volume e preço como uma combinação. Entender volumes nunca é uma tarefa fácil, mas esta bela peça de programação certamente torna isso muito mais simples. Existem várias maneiras pelas quais este indicador pode beneficiar traders e investidores. Divergências (Como um indicador líder) Após estudar muitos indicadores técn
75 USD
Filtro:
trick 86
269
trick 86 2023.12.02 18:12 
 

great tool!

Responder ao comentário