• Información general
  • Comentarios (1)
  • Discusión

PTS Precision Index Oscillator V2

5
El Oscilador de Índice de Precisión (Pi-Osc) de Roger Medcalf de Precision Trading Systems

La versión 2 ha sido cuidadosamente recodificada para cargar rápidamente en su gráfico y se han incorporado algunas otras mejoras técnicas para mejorar la experiencia.

El Pi-Osc fue creado para proporcionar señales precisas de temporización de operaciones diseñadas para encontrar puntos de agotamiento extremos, los puntos a los que los mercados se ven obligados a llegar solo para eliminar las órdenes de stop de todos.

Este producto resuelve el antiguo problema de saber dónde están los puntos extremos, lo que hace que la vida del trader sea mucho más sencilla.

Se trata de un indicador de consenso altamente complejo que tiene algunas diferencias poderosas con respecto a los osciladores estándar de la industria.

Algunas de las características que utiliza son las divergencias en el Índice de Demanda, el flujo de dinero, el RSI, el estocástico, el reconocimiento de patrones, el análisis de volumen, los puntos extremos de desviación estándar y muchas otras variaciones similares en diferentes longitudes.

A simple vista, para un ojo no entrenado, parecería como cualquier otro oscilador, pero cuando se ve en yuxtaposición con otros osciladores como el RSI o el impulso, etc., comienza a emerger el verdadero poder de este indicador.

Hasta donde yo sé, no hay otro oscilador que pueda señalar con frecuencia los máximos y mínimos exactos con la misma eficiencia regular.

El Oscilador de Índice de Precisión está compuesto por muchas ecuaciones matemáticas diferentes que miden el movimiento de precios y volumen en múltiples marcos de tiempo, lo que predice con un alto grado de precisión dónde es probable que ocurran los puntos de giro en las tendencias.

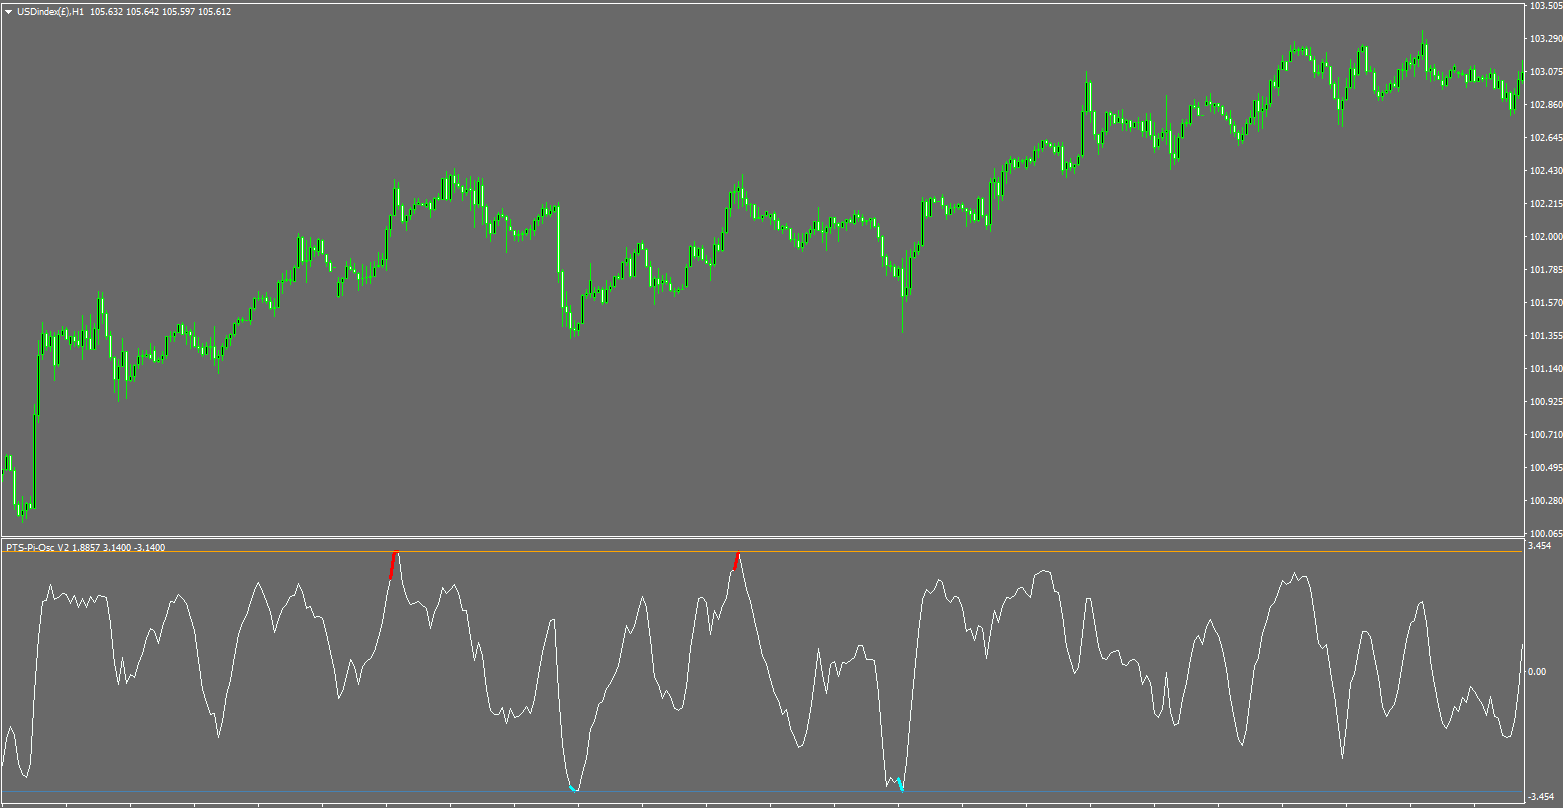
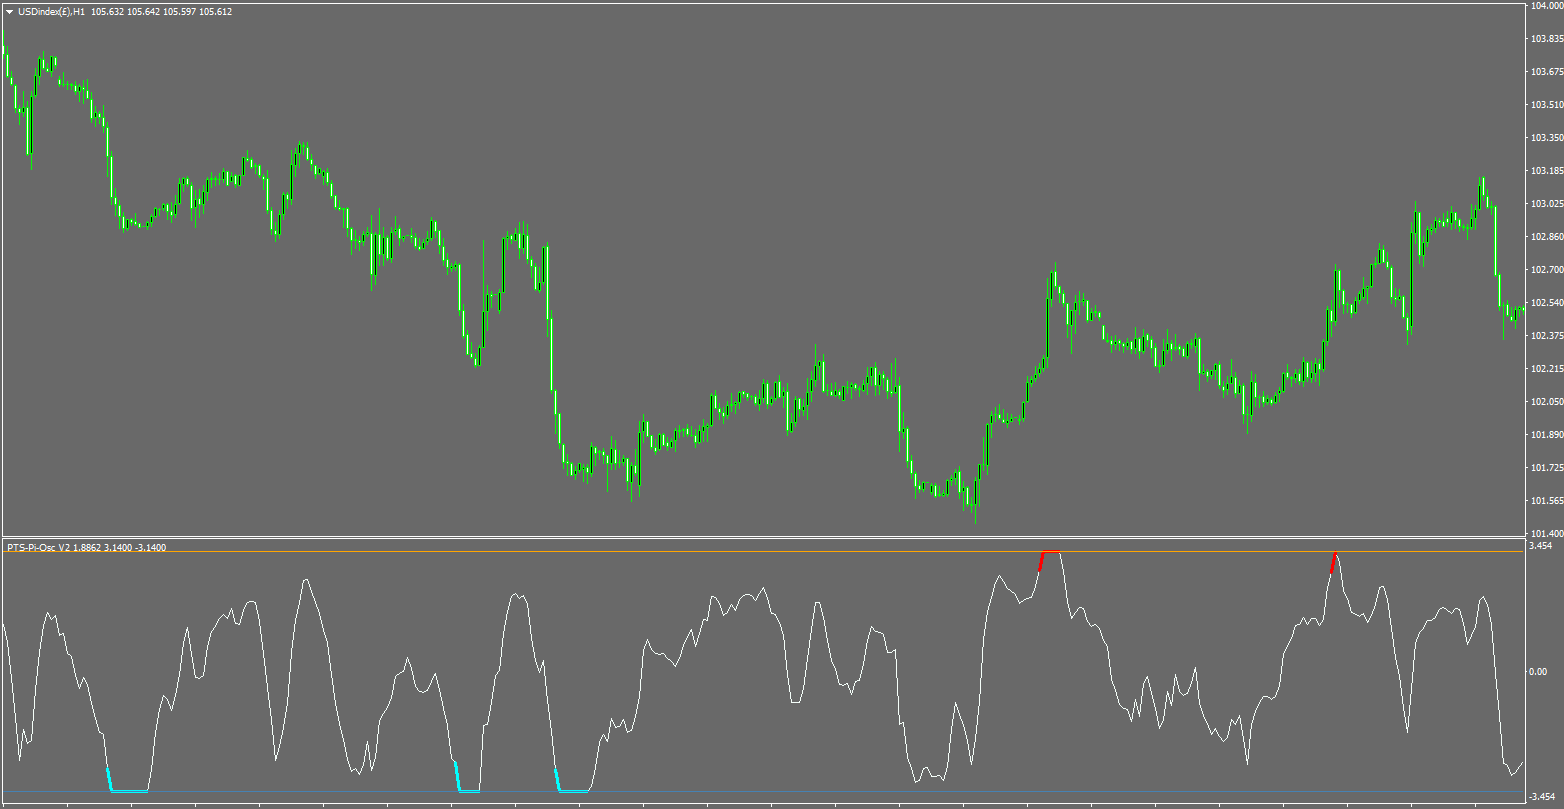
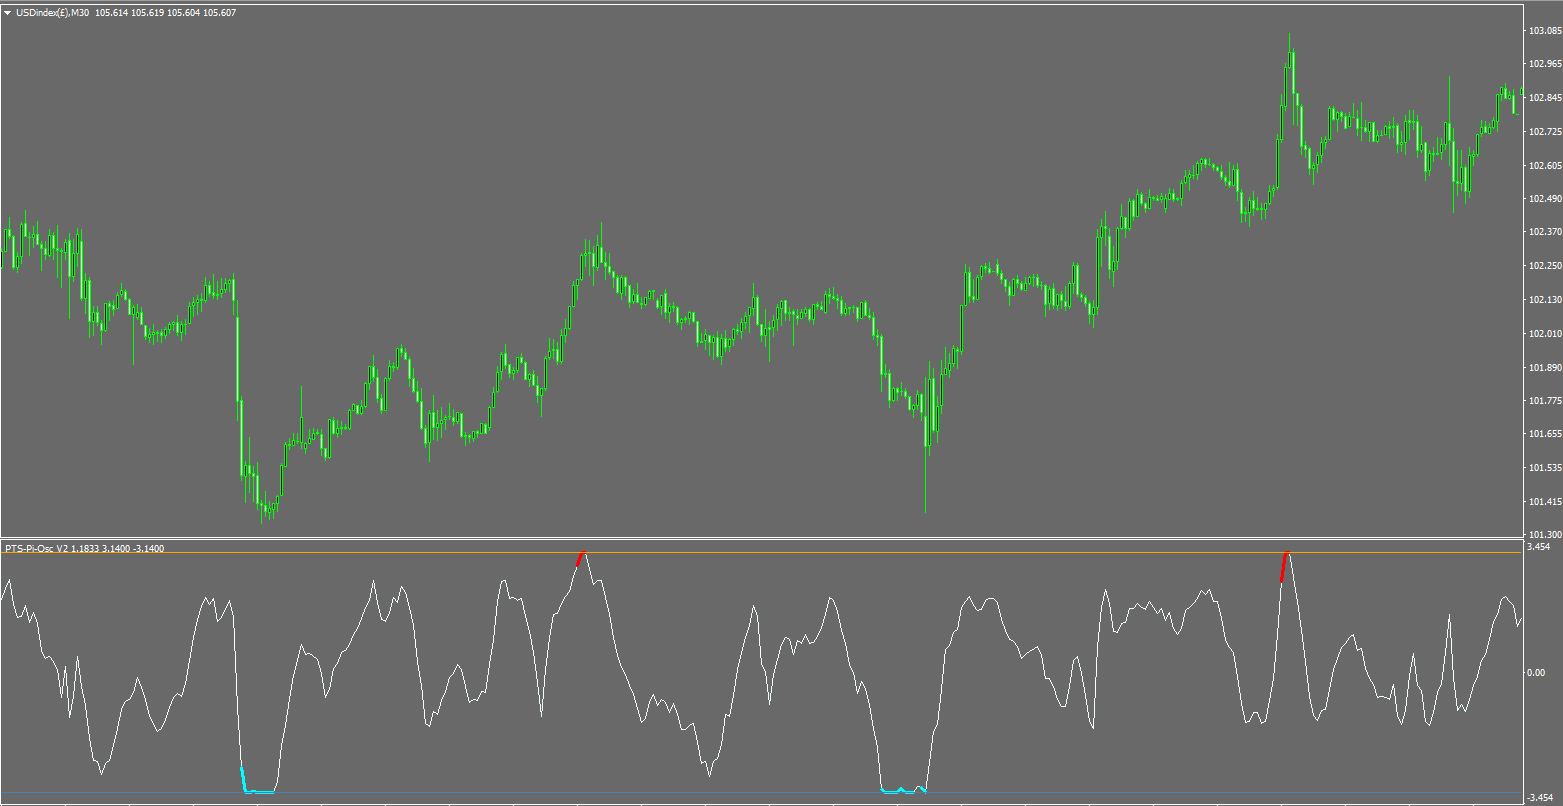
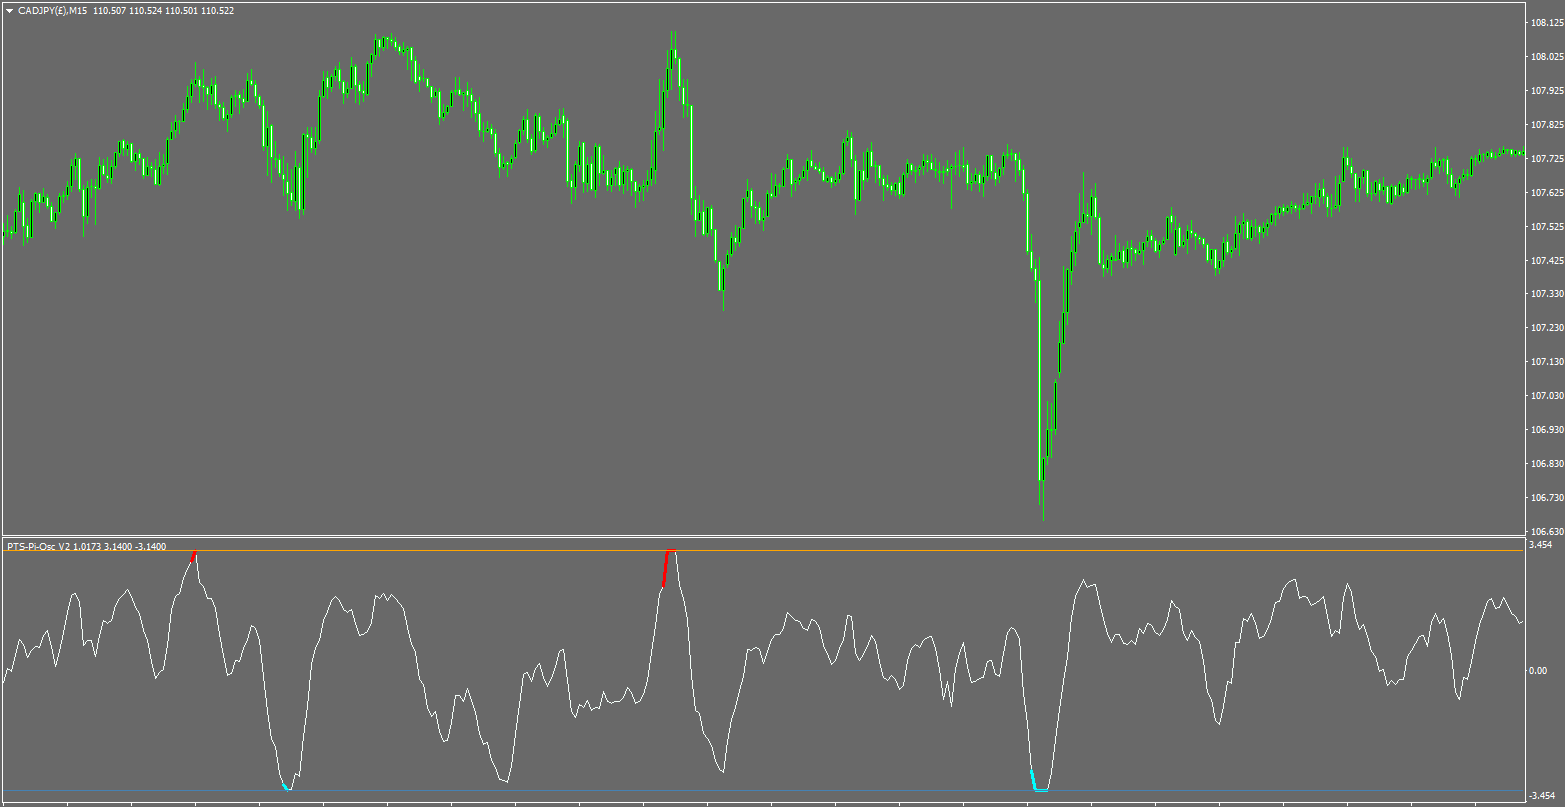
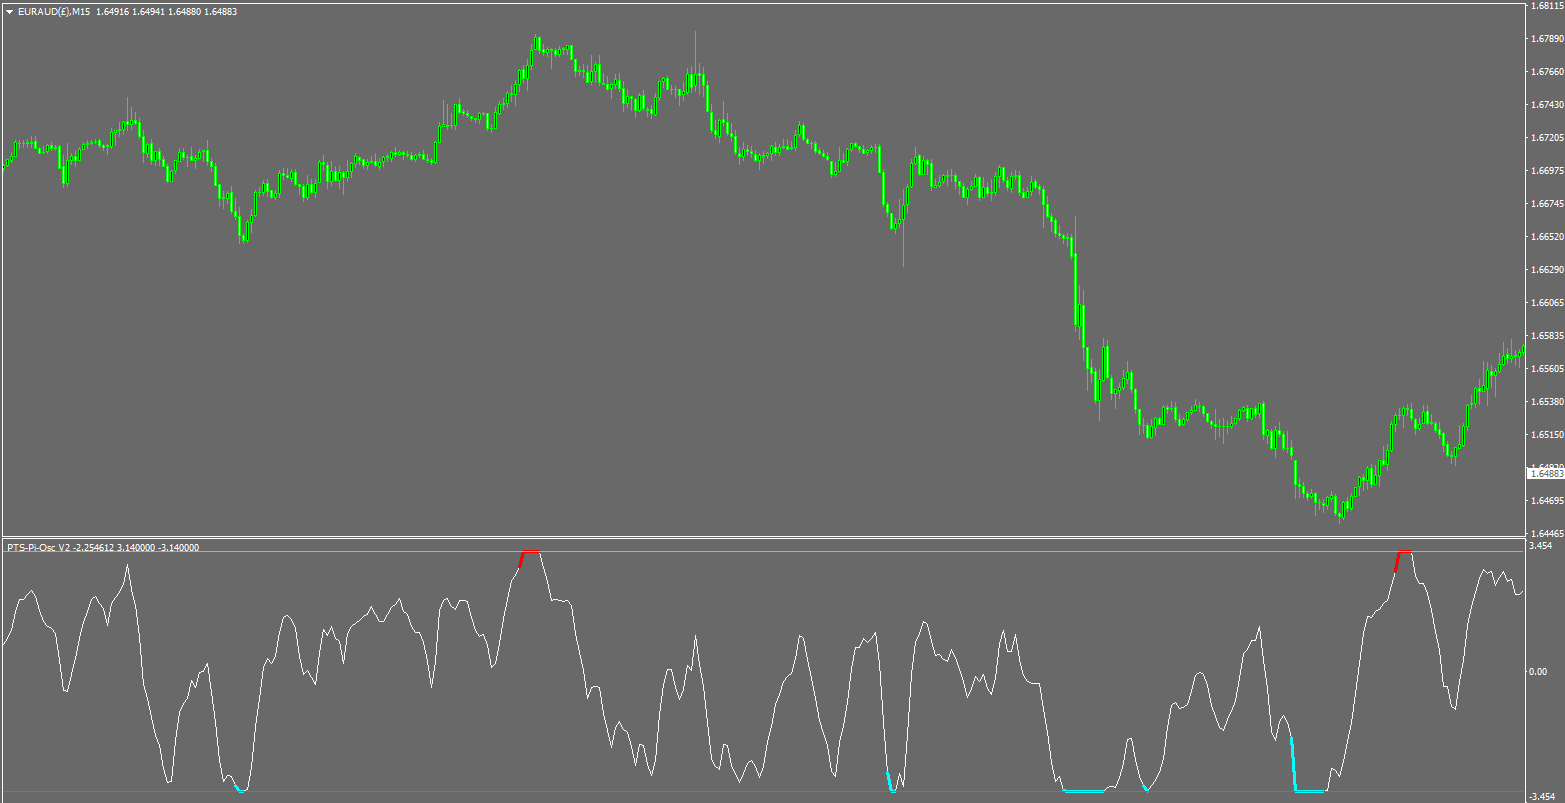
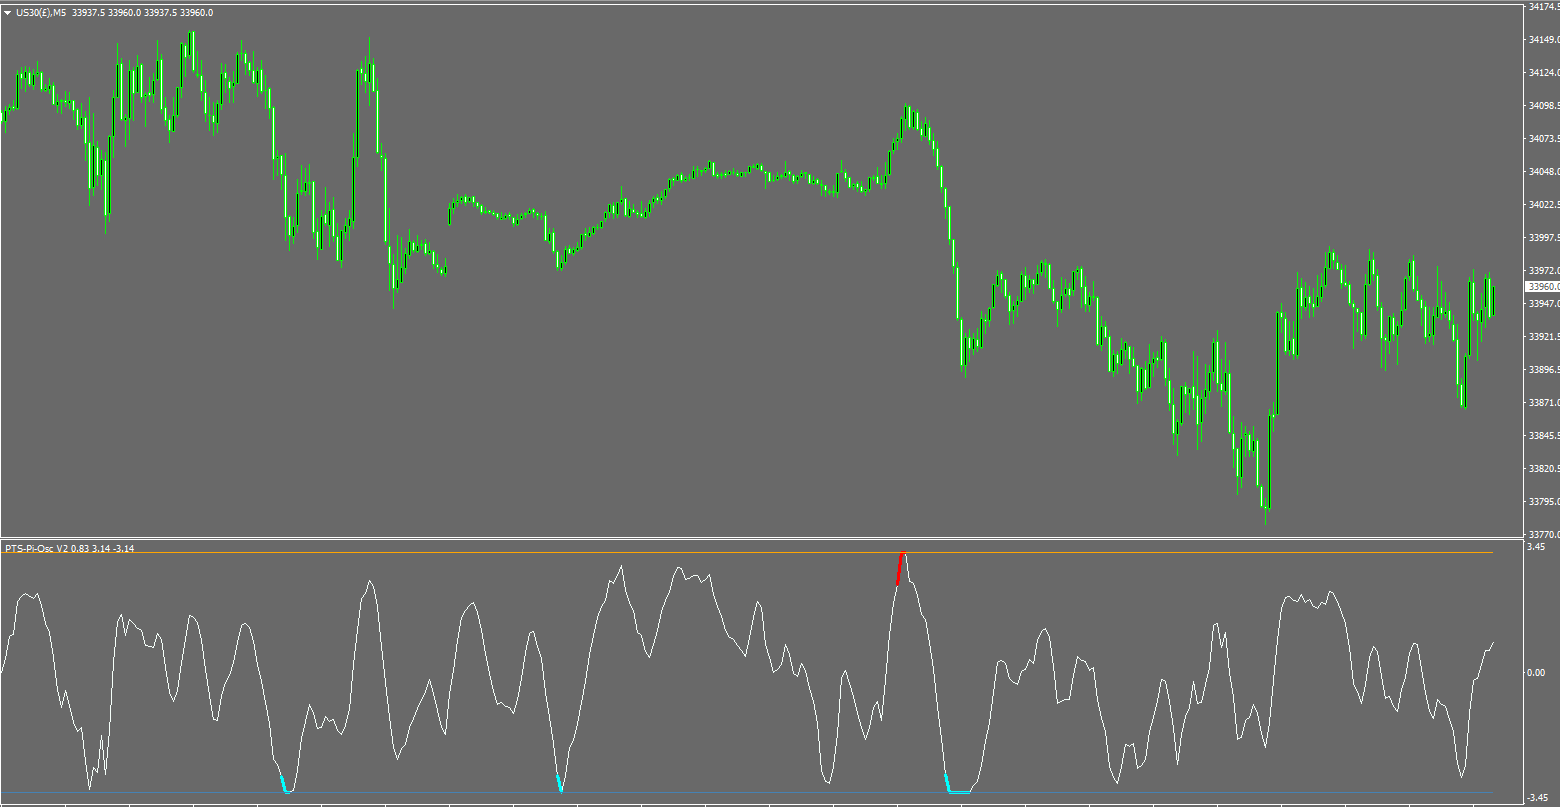
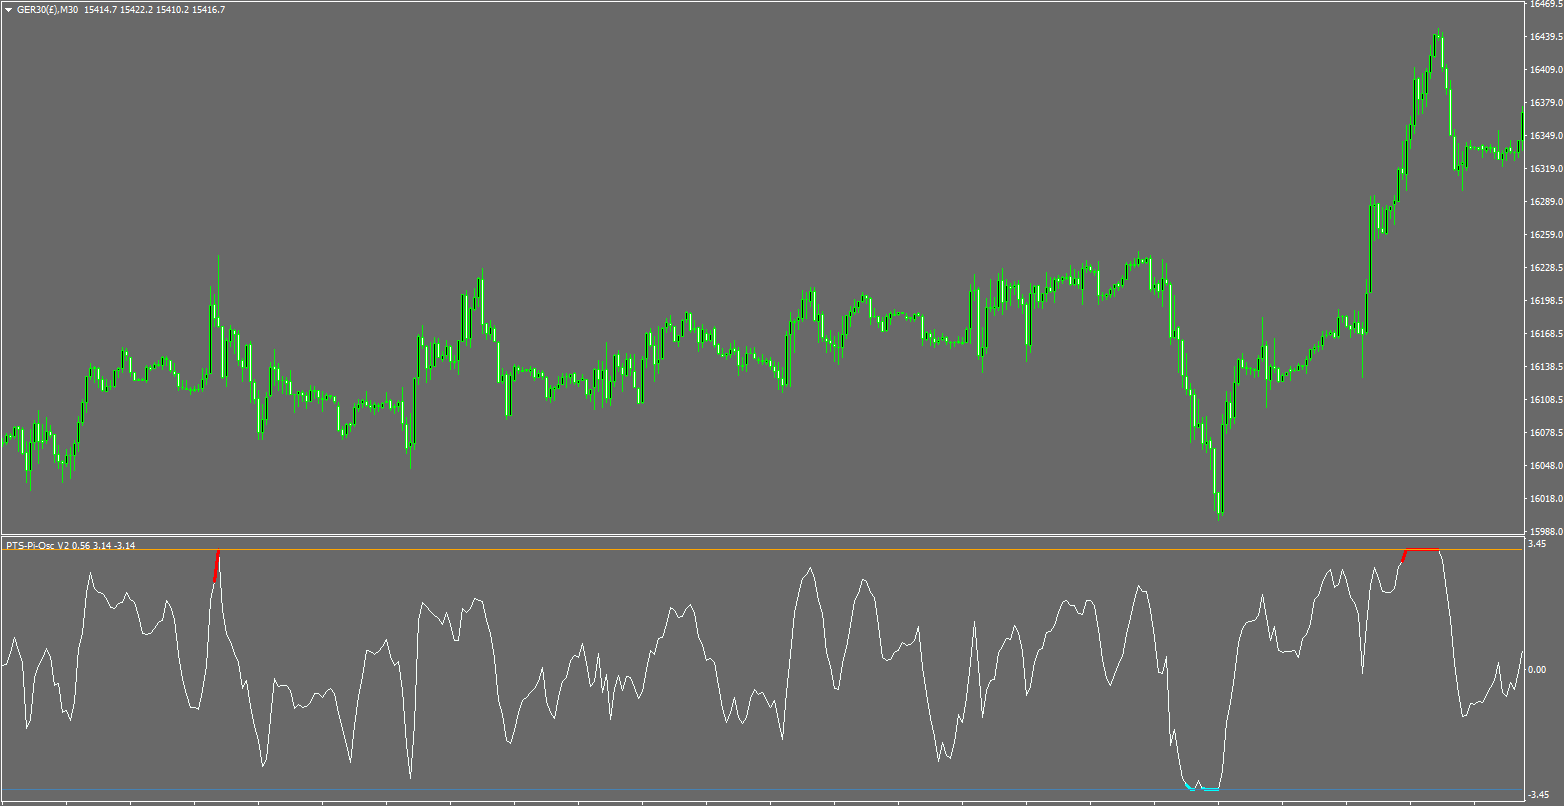
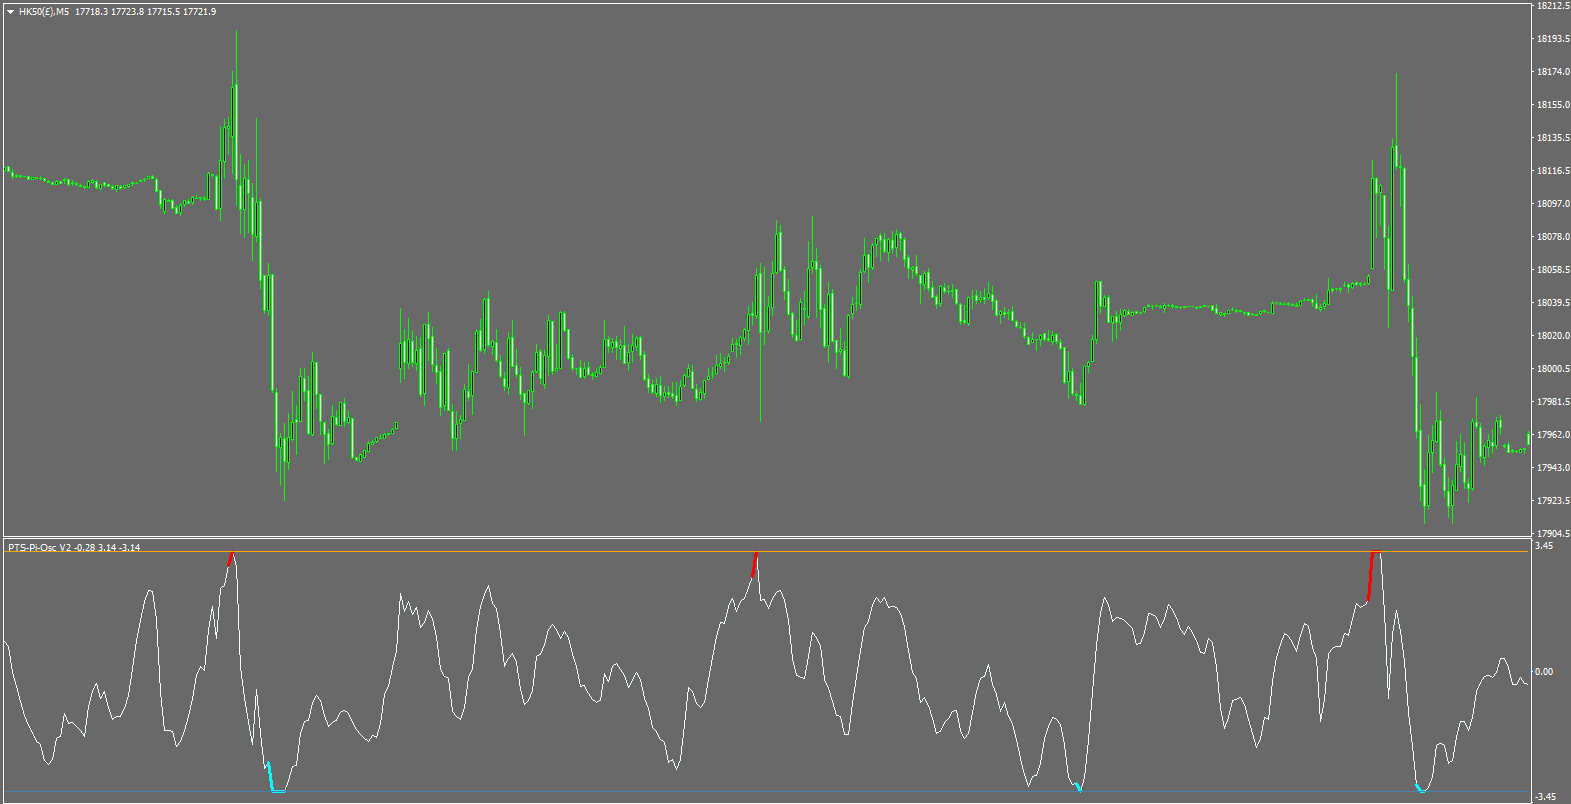
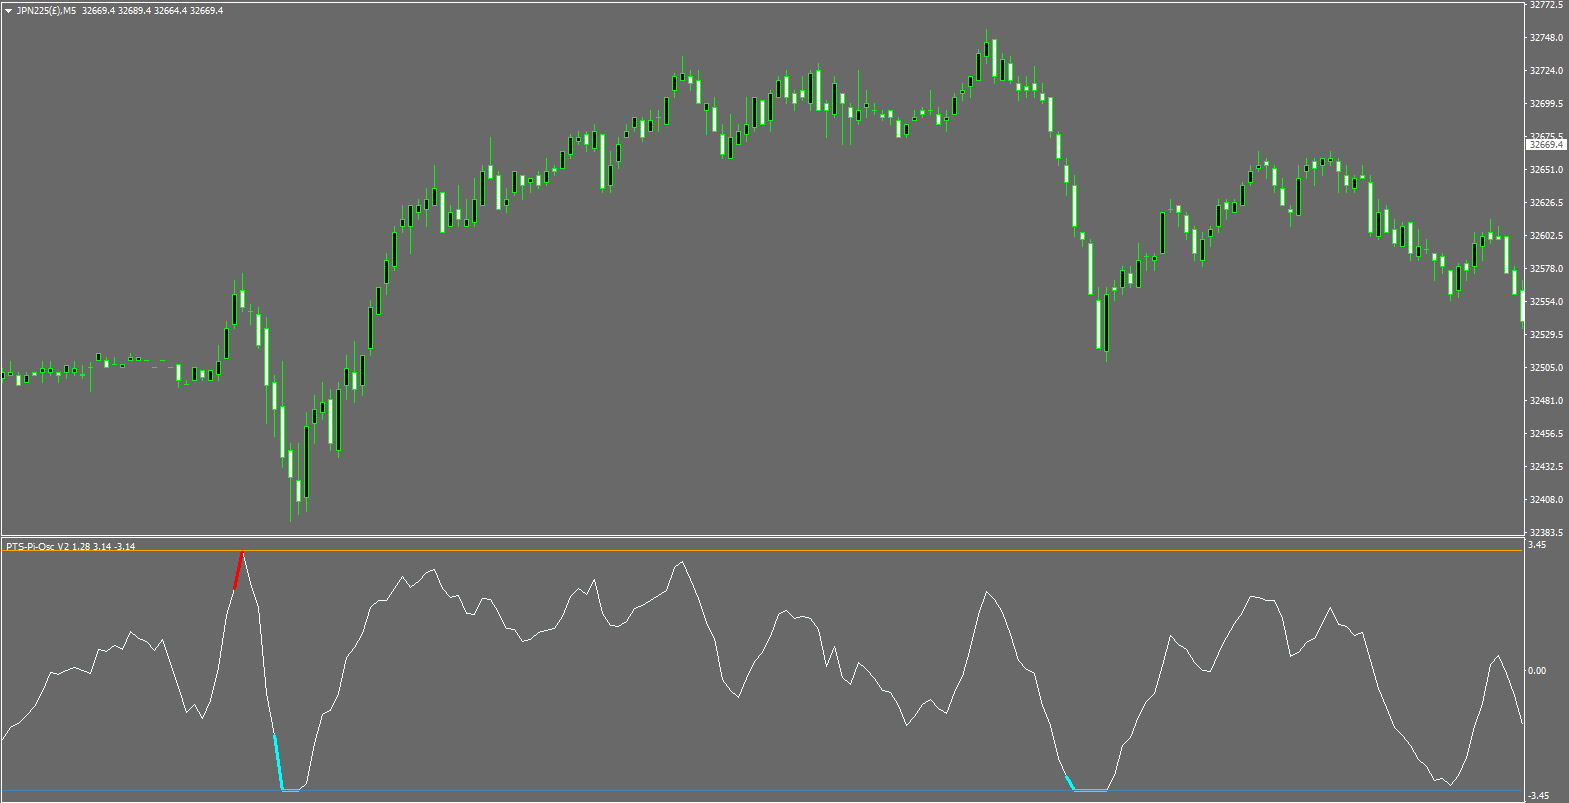
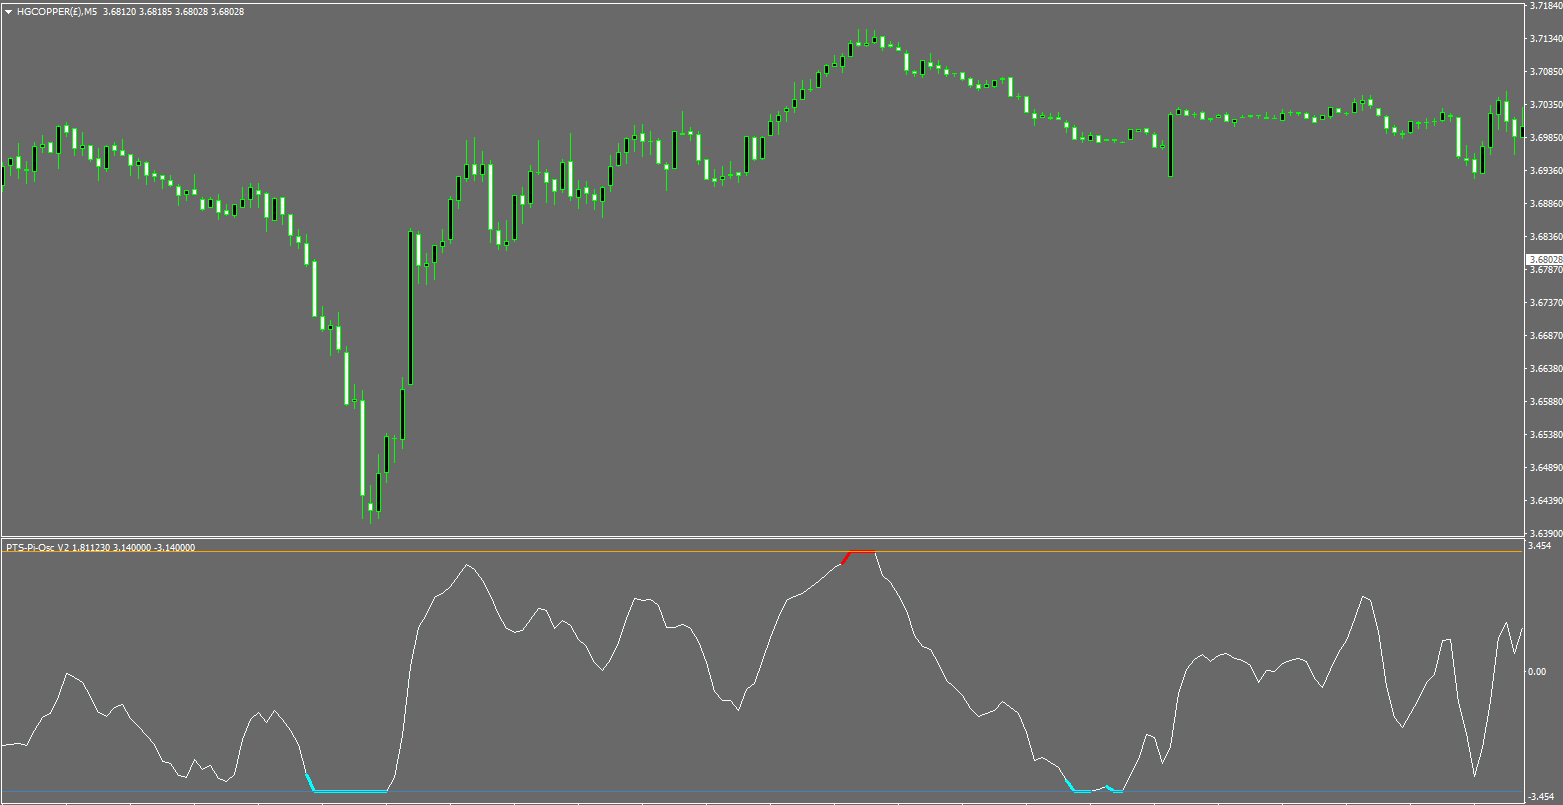
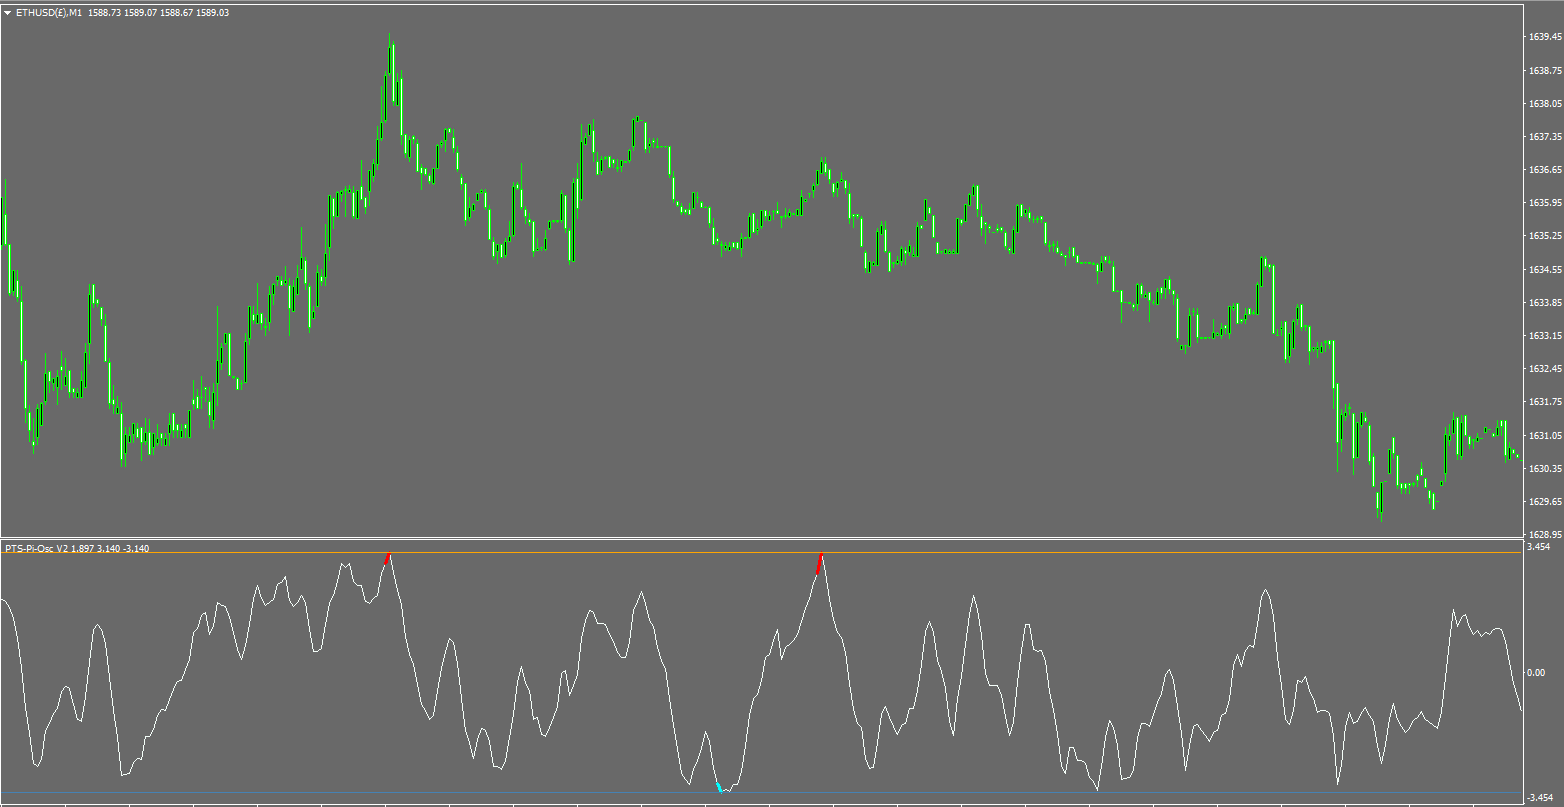
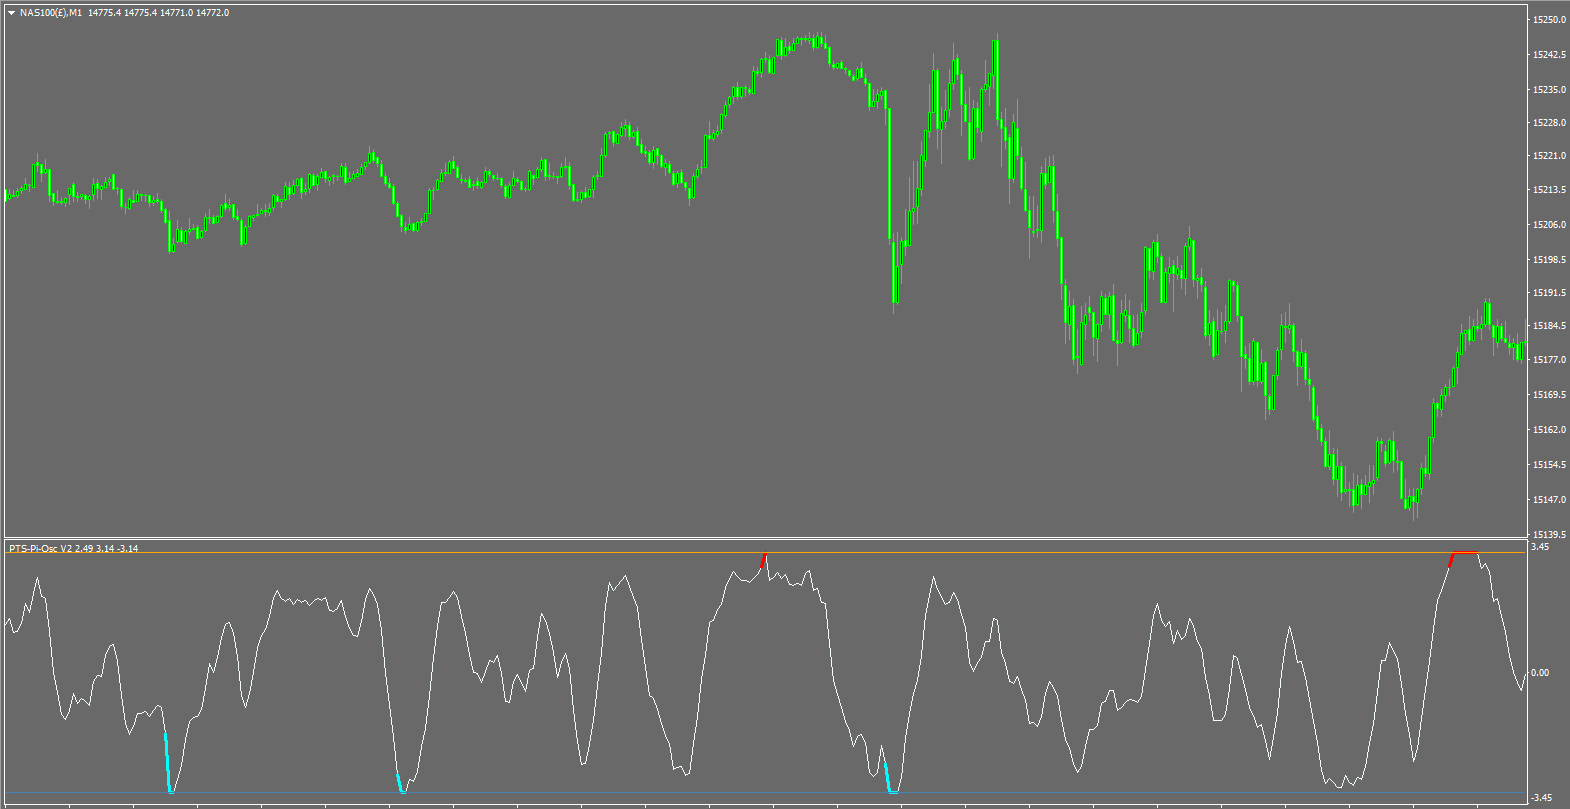
PTS Pi-Osc V2 es extremadamente simple de usar y las señales de advertencia temprana en la parte superior e inferior se muestran cuando se alcanza + o - 3,14, la señal de operación real que da el Oscilador de Índice de Precisión es cuando se aleja de Pi.

Es recomendable esperar a que la tendencia comience a revertirse antes de tomar la señal, ya que no todas las señales se revertirán al toque de más o menos Pi.

Se puede utilizar un promedio móvil de aproximadamente 10-20 períodos y esperar a que comience a revertirse antes de realizar operaciones.

Alternativamente, se puede utilizar el máximo más alto de aproximadamente 6-20 barras para ingresar a operaciones largas cuando se observa el rebote desde -3.14, y viceversa para cortos.

Se proporcionan aspectos destacados para mostrar las señales de manera clara y precisa.

Las alertas están habilitadas por defecto para que pueda estar en su pantalla listo para realizar la próxima operación.

Esta señal indica una alta probabilidad de que la siguiente barra se invierta. A veces resultará en un movimiento grande, en otros casos serán movimientos pequeños y ocasionalmente la señal fallará y el precio no se invertirá.

Al igual que con la mayoría de los métodos de análisis técnico, si una señal no se materializa, es mejor tratarla como una señal de continuación de la tendencia existente.

No hay garantía de que cada señal resulte en una operación ganadora, y los traders deben utilizar órdenes de salida y una buena gestión del riesgo si quieren tener éxito a largo plazo.

Las órdenes de salida son totalmente esenciales con este producto. (Valor sugerido para una orden de salida ajustada: 2 x ATR, y 5 x ATR para una orden de salida más amplia).

Las operaciones pueden cerrarse cuando la tendencia se revierta nuevamente utilizando el método de entrada del promedio móvil, pero un poco más lentamente para darle a su posición la mejor oportunidad de convertirse en una gran ganadora.

Importante: El Pi-Osc tiene 8 reglas que deben cumplirse:

1. Operar en la dirección de la tendencia principal.

2. Encontrar el marco de tiempo que ha funcionado mejor en las pruebas históricas.

3. Siempre utilizar órdenes de salida.

4. Esperar a que la tendencia comience a cambiar antes de entrar en la operación.

5. Esperar el rebote lejos de Pi.

6. Esperar el rebote lejos de Pi.

7. Esperar el rebote lejos de Pi.

8. Recordar las otras siete reglas.

Por favor, visite mi sitio web para ver más capturas de pantalla, videos e información. Solo copie y pegue el título de este artículo en la búsqueda para encontrarlo.

Un gran agradecimiento a Iron Condor por trabajar extensamente en este código para que se cargue y ejecute más rápido con mayor eficiencia.
Comentarios 1
trick 86
269
trick 86 2023.12.02 18:12 
 

great tool!

Productos recomendados
About
Tatiana Savkevych
About - Forex indicator. This trend indicator is used to determine the current trend in price movement, making it clear in which direction it is better to open a position: buy or sell. The About trend indicator is displayed on the chart and moves in parallel with the price. The Forex About trend indicator allows you to determine in time a change in the direction of price movement, thereby minimizing the likelihood of capital loss. In trading practice, various combinations of About and other ind
199 USD
Glazz
Andrei Gerasimenko
Glazz is a great mix of standard Bollinger Bands and ZigZag . The essence of the strategy - is the search for extreme points - possible reversals. When building a signal, we use Bands of a large period and a small ZigZag period. When the indicator has calculated the entire value for signal search, it shows an arrow to buy/sell and gives a sound signal. Simply put, ZigZag is looking for a possible reversal, and Bollinger Bands confirms this reversal. The indicator settings are simple. By defau
65 USD
MT4 Indicator Get ahead of the curve with the Wamek Trend Consult indicator . Designed to identify early and continuation trends, this powerful tool empowers traders to enter the market at precisely the right moment, utilizing powerful filters to reduce the number of fake out signals and improve the accuracy of your trades. By precisely analyzing market trends and filtering out false signals, using its advanced algorithms and unparalleled accuracy, the Trend Consult indicator provides traders wi
175 USD
StellaX
Rodolfo Leonardo De Morais
This indicator allows to observe the larger time trends and the stochastic channel on the chart Indicator Parameters KPeriod - %K period. This is the number of time periods used in the stochastic calculation; DPeriod - %D calculation period Slowing - Slow K calculation period maPeriod - Averaging period maMethod - Averaging method maPrice -  Averaging Price LineoverBought2 - line over bought 2 LineoverBought1 -   line over bought 1 LineMidle - line midle LineOverSold1 - line over sold 1 LineOv
90 USD
Purpose Trend
Maryna Shulzhenko
Purpose Trend - analyzes the current trend gives an excellent understanding of which direction the market is aimed at, at what point it should be expected in the near future. Unfortunately, most of the popular indicators in practice give a huge number of false signals, since they all work without any consideration of global trends. That is why in today's conditions, when the market is far from stable price movement, it is almost impossible to build a strategy without using trend indicators. H
119 USD
Point Trend Indicato - un indicador del nivel superior e inferior de la tendencia, que puede determinar la dirección de la tendencia e indicar su fortalecimiento. La dirección de la tendencia está determinada por puntos redondos; si los puntos están por encima de la línea cero, la tendencia es alcista; si están por debajo, la tendencia es bajista. El aumento del movimiento direccional se indica con flechas. Tiene el único parámetro para ajuste manual: Duración de la dirección de la tendencia.  
65 USD
The Sensitive Oscillator indicator is designed to find trends. It recognizes trends with its own algorithm and changes color. Finds trends relative to the degree of sensitivity. You can use it in all time periods. You can use this indicator alone or in conjunction with other indicators suitable for your other strategies. Transaction strategies You can do breakout strategies with this indicator. Each time you change colors, you can enter the process. You can use it in the long run by putting st
30 USD
Robust Filter
Aleksey Ivanov
5 (1)
The Robust filter   indicator is based on the robust filtering algorithm developed by the author using the multi-period averaged moving median. The algorithm for this averaging is shown in the last screenshot.                The indicator calculates and shows: 1. The direction of the trend; 2. Entry and exit points of positions; 3. StopLoss   lines calculated from current price probability distributions and selected probability of closing an order by StopLoss before the trend revers
49 USD
Shogun RX
Thamini De Oliveira Feitosa Puntel
10 COPIES AT $ 99 ! After that, the price will be raised to $ 150 . After years of painstaking research and development, we are offering the opportunity for you to have this incredible tool in your automated trading portfolio. SHOGUN RX is a strategy that has a very advanced secret trading algorithm. It is a safe EA that trades using pending orders with a defined Stop Loss, Take Profit and 2 smart Trailing capabilities. LIVE ACCOUNT ---> CLICK HERE Pair: USDJPY TimeFrame: H4. Minimum depo
99 USD
The Unique Trend indicator tracks market trends, ignoring sharp fluctuations and market noise. The indicator is suitable for trading on small timeframes because it ignores sudden price jumps or price corrections due to the reduction of market noise around the average price. The scan at minima and maxima forms the internal boundaries (channel) when calculating the indicator signals. The channel allows you to remove market noise. iMA and iATR are used to generate signals using the author's algo
70 USD
Dark Sniper
Dmitriy Kashevich
Dark Sniper arrow indicator. complete lack of redrawing percentage of correct indicator predictions from 80 85% The arrow indicates the direction of the next candle and the possible direction of the trend in the future.  suitable for small m1 timeframes. It is recommended to open deals from 1 to 2 candles. The signal appears on the last candle advantages of the indicator: 1. leading signals. 2.complete lack of redrawing 3. high signal accuracy.
820 USD
Others
Tatiana Savkevych
The Others indicator is a trend-type indicator. In those moments when you need to make a decision to enter a position and give the trader a direction. The indicator gives the trader the opportunity to visually determine which trend will be present at a particular time interval. These are auxiliary tools for technical analysis of the market. Recommended for use in conjunction with any of the oscillators. The main application of the Others indicator is to generate buy and sell signals. Determin
89 USD
SuperRSI
Andriy Sydoruk
The SuperRSI indicator is an advanced index of internal strength. The indicator shows not the relative strength of the trading instruments being compared, but the internal strength of a single instrument, therefore, it is the “Internal Strength Index”. This is an advanced form of the SuperRSI indicator. It converts the signal so that low-frequency components are delayed much more than high-frequency components. In general, the data of the last bar have more weight than previous data, like an exp
49 USD
"Trend reversal ml4" es un indicador único diseñado para determinar los momentos de reversión de precios en tiempo real. Este es un sistema comercial listo para usar para Metatrader4. ¡El indicador no vuelve a dibujar sus valores! Basado en algoritmos avanzados y análisis técnico, este indicador le proporciona señales claras sobre posibles puntos de entrada y salida del mercado, ayudándole a tomar decisiones informadas. Ventajas del indicador: alta precisión de la señal. el propio indicador m
35 USD
The King of Forex Trend Cloud Indicator is a trend following indicator based on moving averages. The Indicator is meant to Capture both the beginning and the end of a trend. This indicator can be used to predict both short and long terms market trends.  The king of Forex Trend Cloud if paired together with the King of Forex Trend Indicator can give a broad picture in market analysis and forecasts. I have attached images for both the  The king of Forex Trend Cloud on its own and  The king of Fore
335 USD
HC candlestick pattern is a simple and convenient indicator able to define candle patterns.‌ Candlestick charts are a type of financial chart for tracking the movement of securities. They have their origins in the centuries-old Japanese rice trade and have made their way into modern day price charting. Some investors find them more visually appealing than the standard bar charts and the price action is easier to interpret. Hc candlestick pattern is a special indicator designed to find divergence
60 USD
Indicator for binary options arrow is easy to use and does not require configuration works on all currency pairs, cryptocurrencies buy signal blue up arrow sell signal red down arrow tips do not trade during news and 15-30 minutes before their release, as the market is too volatile and there is a lot of noise it is worth entering trades one or two candles from the current period (recommended for 1 candle) timeframe up to m 15 recommended money management fixed lot or fixed percentage of the depo
100 USD
The Best Choice compra y venta
Sandro Israel Hernandez Zamora
¿Has escuchado decir que la tendencia es tu amiga? pues nada es mas cierto en el mundo del trading. Este indicador analiza las tendencias y su fuerza para que puedas aprovecharlas y utilizamos un conjunto de indicadores como RSI, %W, MACD y EMAS para analizar el mercado y sus movimientos, por lo que podrás mantener tu gráfico limpio sabiendo que todos estos indicadores los tienes en uno solo. Este, como cualquier indicador, no representa una certeza de compra o venta definitiva, por lo siempre r
40 USD
Scalping Line is an advanced average that we created for use in our trading strategy. The essence of our trading strategy is to open a buy deal when the line is blue and the price drops below the line. Or open a sell deal when the price rises above the line, and the color of the line is red. Thus, we open deals when the price for a short distance goes in the opposite direction from the general trend. We close the deal when we get the minimum profit. We trade on the timeframe M30 or H1. Better to
69 USD
Leo Trend is a signal indicator that shows the market entry points, as well as the trend direction and flat on the chart in the form of arrows and lines. Leo Trend will be useful both for beginners creating a trading strategy, and for professionals to integrate into ready-made trading systems. Leo Trend works without redrawing and without significant delays. The operation of the indicator is demonstrated in the video. In addition, you can test this indicator in the strategy tester free of charge
69 USD
Timeframe Separator MT4
Alexandre Borela
5 (1)
If you like this project, leave a 5 star review. Often times we are using brokers that are outside of the GMT-0 timezone, this not only complicates things, but, it can make seeing when a trading session starts a bit more difficult than it should. This indicator allows you to set a timezone offset it will draw a vertical line for the: Day. Week. Month. Quarter. year.
FREE
The Pearson Trend!! My name is Murat Yazici. I have B.Sc. Statistics and M.Sc. Quantitative Methods degrees. I have several scientific papers, conference presentations in Texas, Toronto, London, Istanbul, books and book chapters studies, and many projects about mathematical and statistical modelling. I am also journal reviewer at some scientific journals. What is The Pearson Trend's Logic? It is based on   A Fuzzy Model  developed by me.  Vague or fuzzy data and application several fields,
120 USD
Reincarnations
Maryna Shulzhenko
The Reincarnations trend indicator is used to determine the strength and direction of a trend and to find price reversal points. This tool scans the market looking for the correct entry. You can see and evaluate it yourself, perhaps it will suit you for a number of tasks related to forecasting price movements. It uses only price data and analytics to calculate entry points. Does not use auxiliary indicators. It has two parameters for customization. Indicator setting. Interval - price analysis
149 USD
El indicador estándar de Índice de Relative Strength Index (RSI) , en el que hemos añadido funciones de notificación al teléfono y al correo electrónico. En la configuración del indicador, puede especificar los límites superior e inferior del indicador, al alcanzarlos, el indicador le enviará una notificación a su teléfono y correo electrónico. La notificación se enviará en el siguiente formato: par de divisas + período de tiempo + hora de notificación. Si utiliza este indicador estándar gratui
69 USD
Indicator Candle Direction
Veridiana Adorno Kendrick
Indicador simple que apoya a los tomadores de decisiones. Tendrá las direcciones de las velas para diferentes períodos de tiempo en su pantalla. Eso te permitirá tener uno escenario más para analizar antes de abrir tus órdenes. En caso de que desee tener más detalles agregados a tu pantalla, solo hágamelo saber...  ¡Para múltiples monedas y que informan las direcciones para múltiples tiempos graficos!
30 USD
Trend Rever
Vitalii Zakharuk
The Trend Rever indicator uses two lines of different colors to display buy or sell signals. The first of these lines is red and the second is blue. When changing the color of the lines, an arrow is also displayed, which indicates which deal to open, buy or sell. A simple but effective system for determining the Forex trend. The algorithm takes into account the measurement of prices, and this method also focuses on the measurement of each of the price drops - which gives more detailed informati
69 USD
OnixPoint
Jhonsep Lopez
El indicador OnixPoint, detecta de forma eficiente la entrada mas adecuada en tendencia con el stoploss mas corto. Se basa en la búsqueda de patrones de cambio en el activo con respecto a una estimación futura del precio. Funciona para cualquier par de divisas. El indicador está diseñado para facilitar la toma de decisiones en la entrada de una posición. El equipo de desarrollo está constantemente mejorando la funcionalidad del Indicador. Ventajas del Indicador No repinta. Funciona en todas la
30 USD
Market Session Pro MT4
Kambiz Shahriarynasab
5 (1)
The  Market Sessions Indicator for MT5 helps you  predict market turnarounds  by detecting major supply and demand areas. These pivot points tend to occur after a new session has started and the previous one is still open. It is also used to gauge how many points or pips the market moves on average during a session. This helps us to place better our take profits and stop losses. The indicator works on all forex pairs, gold, silver, commodities, stocks, indices and any other instrument that your
50 USD
Supplement for Alpha Trend Spotter (ATS) Indicator: https://www.mql5.com/en/market/product/8590 This indicator acts by price action. Use it when ATS shows clear Bullish or Bearish Trend for finding the strongest trend each day. Suitable for timeframes M5, H1, H4 and D1. Suitable for Binary Option 5 minutes signal. How to Use: RED Arrow means Sell GREEN Arrow means Buy
30 USD
Warning: Our product works with 28 symbols. The average accuracy level of the signals is 99%. We see signals below 15 pips as unsuccessful. Technique Signal   indicator is designed for signal trading. This indicator generates trend signals. It uses many algorithms and indicators to generate this signal. It tries to generate a signal from the points with the highest trend potential. This indicator is a complete trading product. This indicator does not need any additional indicators. The
99 USD
Los compradores de este producto también adquieren
¡Actualmente 20% OFF ! ¡La mejor solución para cualquier novato o trader experto! Este software funciona con 28 pares de divisas. Se basa en 2 de nuestros principales indicadores (Advanced Currency Strength 28 y Advanced Currency Impulse). Proporciona una gran visión general de todo el mercado de divisas. Muestra los valores de Advanced Currency Strength, la velocidad de movimiento de las divisas y las señales para 28 pares de divisas en todos los (9) marcos temporales. Imagine cómo mejorar
199 USD
TrendMaestro
Stefano Frisetti
5 (1)
note: this indicator is for METATRADER4, if you want the version for METATRADER5 this is the link: TRENDMAESTRO recognizes a new TREND in the bud, he never makes mistakes. The certainty of identifying a new TREND is priceless. DESCRIPTION TRENDMAESTRO identifies a new TREND in the bud, this indicator examines the volatility, volumes and momentum to identify the moment in which there is an explosion of one or more of these data and therefore the moment in which prices have strong probability of f
397 USD
FX Power MT4 NG
Daniel Stein
5 (2)
Obtenga su actualización diaria del mercado con detalles y capturas de pantalla a través de nuestro Morning Briefing aquí en mql5 y en Telegram ! FX Power MT4 NG es la nueva generación de nuestro popular medidor de fuerza de divisas, FX Power. ¿Y qué ofrece este medidor de fuerza de nueva generación? Todo lo que le encantaba del FX Power original PLUS Análisis de fuerza de ORO/XAU Resultados de cálculo aún más precisos Períodos de análisis configurables individualmente Límite de cálculo persona
169 USD
GOLD Impulse with Alert
Bernhard Schweigert
4.43 (7)
Este indicador es una super combinación de nuestros 2 productos Advanced Currency IMPULSE with ALERT  +   Currency Strength Exotics . ¡Funciona para todos los marcos de tiempo y muestra gráficamente el impulso de fuerza o debilidad para las 8 divisas principales más un Símbolo! Este Indicador está especializado en mostrar la aceleración de la fuerza de la divisa para cualquier símbolo como Oro, Pares Exóticos, Materias Primas, Índices o Futuros. Es el primero de su clase, cualquier símbol
149 USD
Cycle Sniper
Elmira Memish
4.41 (34)
NEW YEAR SALE PRICE FOR LIMITED TIME!!! Please contact us after your purchase and we will send you the complimentary indicators to complete the system . Cycle Sniper is not a holy grail but when you use it in a system which is explained in the videos, you will feel the difference. If you are not willing to focus on the charts designed with Cycle Sniper and other free tools we provide, we recommend not buying this indicator. We recommend watching the videos about the indiactor and system befor
199 USD
Weis Wave with Alert
Trade The Volume Waves Single Member P.C.
4.78 (18)
Rental/Lifetime Package Options and Privileges' * For optimum results the yearly or lifetime package is suggested due to live training and Discord  channel trading with the  creator! Rent Monthly Six Months   Yearly/Lifetime Weis Wave with Speed with Alert+Speed Index x x x Manual  x x x Quick Set up Video x x x Blog x x x Lifetime Updates x x x Setup and Training Material x x Free Rectangle Break Alert Tool      x Discord Access Channel "The SI traders" x 2-hour live methodology traini
599 USD
FX Volume
Daniel Stein
4.59 (34)
Obtenga su actualización diaria del mercado con detalles y capturas de pantalla a través de nuestro Morning Briefing aquí en mql5 y en Telegram ! FX Volume es el PRIMER y ÚNICO indicador de volumen que proporciona una visión REAL del sentimiento del mercado desde el punto de vista de un bróker. Proporciona una visión impresionante de cómo los participantes institucionales del mercado, como los brokers, están posicionados en el mercado Forex, mucho más rápido que los informes COT. Ver esta info
249 USD
MTF Supply Demand Zones
Georgios Kalomoiropoulos
4.83 (23)
Próxima generación de zonas de oferta y demanda automatizadas. Algoritmo nuevo e innovador que funciona en cualquier gráfico. Todas las zonas se crean dinámicamente de acuerdo con la acción del precio del mercado. DOS TIPOS DE ALERTAS --> 1)CUANDO EL PRECIO LLEGA A UNA ZONA 2)CUANDO SE FORMA UNA NUEVA ZONA No obtienes un indicador inútil más. Obtiene una estrategia comercial completa con resultados probados.     Nuevas características:     Alertas cuando el precio llega a la z
149 USD
Scalping and Binary Signal Detector : indicador de especulación que proporciona señales direccionales para abrir posiciones a lo largo de la tendencia. El indicador es un sistema comercial completo que se puede utilizar para Forex y opciones binarias. El sistema de algoritmos permite reconocer movimientos intensos de precios en varias barras consecutivas. El indicador proporciona varios tipos de alertas para las flechas. Funciona en cualquier instrumento comercial y marco de tiempo (se recom
159 USD
TPA True Price Action indicator reveals the true price action of the market makers through 100% non-repainting signals (except early signals mode) strictly at the close of a candle! TPA shows entries and re-entries, every time the bulls are definitely stronger than the bears and vice versa. Not to confuse with red/green candles. The shift of power gets confirmed at the earliest stage and is ONE exit strategy of several. There are available now two free parts of the TPA User Guide for our custo
168 USD
Price Action Entry Alerts
Stephen Sanjeeve Sahayam
5 (2)
Este indicador analiza cada barra en busca de presión de compra o venta e identifica 4 tipos de patrones de velas con el volumen más alto. Estas velas luego se filtran utilizando varios filtros lineales para mostrar señales de compra o venta. Las señales funcionan mejor, junto con una dirección de marco de tiempo más alta y cuando se negocian durante horas de alto volumen. Todos los filtros son personalizables y funcionan de forma independiente. Puede ver señales de una sola dirección con el cli
225 USD
Enigmera
Ivan Stefanov
5 (1)
ENIGMERA: El núcleo del mercado https://www.enigmera.com Introducción Este indicador y sistema de negociación es un enfoque extraordinario de los mercados financieros. ENIGMERA utiliza los ciclos fractales para calcular con precisión los niveles de soporte y resistencia. Muestra la auténtica fase de acumulación y proporciona dirección y objetivos.  Un sistema que funciona tanto si estamos en una tendencia como en una corrección.  ¿Cómo funciona? ENIGMERA consta de tres líneas: la línea de s
1 800 USD
Entry Points Pro
Yury Orlov
4.7 (224)
Este es un genial indicador para MT4 que ofrece señales precisas para entrar en una transacción sin redibujar. Se puede aplicar a cualquier activo financiero: fórex, criptomonedas, metales, acciones, índices. Nos dará valoraciones bastante precisas y nos dirá cuándo es mejor abrir y cerra una transacción. Eche un vistazo  al vídeo  (6:22), ¡contiene un ejemplo de procesamiento de una sola señal que ha amortizado el indicador! La mayoría de los tráders mejoran sus resultados comerciales durante l
249 USD
"Supply / Demand Zones" The concepts of supply and demand zones   are undoubtedly two of the most highly discussed attributes of technical analysis. Part of analysing chart of pattern , these terms are used by traders   to refer to price levels i n charts that tend to act as barriers, preventing the price of an asset from getting pushed in a certain direction. At first, the explanation and idea behind identifying these levels seems easy, but as you'll find out, supply and demand zones can co
199 USD
NNFX Strength System
Benjamin Joshua Nash
3 (1)
A complete NNFX algorithm in one indicator. NEW: Inbuilt backtester shows historical trade stats on the chart to show which pairs are most profitable. Don't be fooled. It's not enough to simply match a strong and weak currency to trade successfully with a strength meter, you need to know the intimate details of the relationship between two currencies. This is exactly what we've done with NNFX Strength, giving you all the information you need to make solid trading decisions. Years in the makin
150 USD
Introduction to Fractal Pattern Scanner Fractal Indicator refers to the technical indicator that makes use of the fractal geometry found in the financial market. Fractal Pattern Scanner is the advanced Fractal Indicator that brings the latest trading technology after the extensive research and development work in the fractal geometry in the financial market. The most important feature in Fractal Pattern Scanner is the ability to measure the turning point probability as well as the trend probabi
180 USD
Volume by Price MT4
Brian Collard
5 (14)
The Volume by Price Indicator for MetaTrader 4 features Volume Profile and Market Profile TPO (Time Price Opportunity). Get valuable insights out of currencies, equities and commodities data. Gain an edge trading financial markets. Volume and TPO histogram bar and line charts. Volume Footprint charts. TPO letter and block marker charts including split structures. Positioning and styling options to suit the user's needs and context. Highlight Volume Profile and Market Profile TPO Point of Contro
259 USD
Difícil de encontrar y escasa en frecuencia, las divergencias son uno de los escenarios comerciales más confiables. Este indicador busca y escanea las divergencias regulares y ocultas automáticamente usando su oscilador favorito. [ Guía de instalación | Guía de actualización | Solución de problemas | FAQ | Todos los productos ] Fácil de comerciar Encuentra divergencias regulares y ocultas Admite muchos osciladores bien conocidos Implementa señales comerciales basadas en rupturas Muestra n
249 USD
Full STO
Roman Smoroda
Indicador STO completo (incluye todas las versiones de tres indicadores STO: Premium, Gold, Silver) - STABLE TRADE OPTION está diseñado para el comercio automático de opciones binarias.  ¡¡¡¡¡LEA CUIDADOSAMENTE!!!!! IMPORTANTE En un terminal cree dos plantillas con diferentes vencimientos, una plantilla para las 18:01, 18:02 con vencimientos de 1 a 15 minutos y una plantilla para las 22:00 con vencimientos de 10 a 20 minutos. Winrate: 71% en los últimos 5 años Gestión del dinero: 0,3% d
500 USD
ECM Elite Channel is a volatility-based indicator, developed with a specific time algorithm, which consists of finding possible corrections in the market. This indicator shows two outer lines, an inner line (retracement line) and an arrow sign, where the channel theory is to help identify overbought and oversold conditions in the market. The market price will generally fall between the boundaries of the channel. If prices touch or move outside the channel, it's a trading opportunity. The
250 USD
CFF Banks Liquidity
Abdalla Mohamed Kandil
CFF Banks Liquidity     Entry signals without repainting or delays     Error-free opening of trades     Provides signals for any direction sell & Buy Join Our Public Telegram Channel for latest updates and set files.   | Our Telegram Channel How does the CFF Banks Liquidity Works? Our CFF Banks Liquidity trading system based on a very accurate "Trend-Following" Trading Strategy. Here's how to Start using our System 1.      Buy and install the indicator in your terminal. Ask the guide.
313 USD
Hello Dear Trader, Today Im Telling You About The "Golden Scalp System V1 " Metatrader4 Golden Scalp System Scalper with EMA   This is a  Scalper strategy   based on ( Exponential moving average) EMA . Time frame: H1 Pair: EUR/USD, GBP/USD,AUD/USD XAU/USD Platform Mt4   Indicators for Scalper with Ema: 300  EMA (Exponential Moving Average) ; 500 EMA (Expontial Moving Average); Stochastic   (5,3,3)   Long Entry 1) 300  EMA   > 500  EMA . 2) Find significant levels of support. 3) Wait for
500 USD
Gartley Hunter Multi MT4
Siarhei Vashchylka
4.67 (3)
Gartley Hunter Multi - An indicator for searching for harmonic patterns simultaneously on dozens of trading instruments and on all classic timeframes: (m1, m5, m15, m30, H1, H4, D1, Wk, Mn). Manual (Be sure to read before purchasing) | Version for MT5 Advantages 1. Patterns: Gartley, Butterfly, Shark, Crab. Bat, Alternate Bat, Deep Crab, Cypher 2. Simultaneous search for patterns on dozens of trading instruments and on all classic timeframes 3. Search for patterns of all possible sizes. Fr
149 USD
Introduction to Chart Pattern MT Chart Pattern MT is a chart pattern scanner to detect the triangle pattern, falling wedge pattern, rising wedge pattern, channel pattern and so on. Chart Pattern MT uses highly sophisticated chart pattern detection algorithm. However, we have designed it in the easy to use with intuitive user interface. Chart Pattern MT will show all the patterns in your chart in the most efficient format for your trading. You do not have to do tedious manual pattern detection an
180 USD
This indicator will help you identify the key zones needed for The Silver Bullet Strategy which are:  The three time-windows the ICT mentioned in the strategy Window 1: 3 AM and 4 AM New York time Window 2: 10 AM and 11 AM New York Time Window 3: 2 PM to 3 PM New York Time Bullish and bearish supply and demand zones which will help you identify FVG inside those time windows T he previous day's high and low, draw on liquidity The indicator does not plot the FVGs to avoid cluttering the chart  Exi
200 USD
Estrategia de francotirador creada para brindarle los mejores puntos de entrada para todos los pares y todos los marcos de tiempo y siempre moviéndose con la dirección de la tendencia basada en la acción del precio. una vez que domine la estrategia, le permitirá tener más confianza con su operación para que sepa cuándo abrir y cerrar su operación con el máximo beneficio porque muestra el comienzo de la tendencia con entradas múltiples, por lo que si pierde la entrada al comienzo de La estrate
750 USD
**Presentando el Sistema Inteligente Binario: Tu Compañero Definitivo de Trading** El Sistema Inteligente Binario no es solo un indicador; es una herramienta de trading sofisticada diseñada meticulosamente para empoderar a los traders con precisión precisa y señales oportunas en diversos mercados. Construido sobre una base de algoritmos de vanguardia y una exhaustiva colección de indicadores técnicos, este sistema es tu clave para desbloquear el éxito en el trading. **Componentes del Indica
450 USD
Smart Ai Levels  Accumulation & Distribution indicator Smart Ai Levels are Ai controlled indicator which is based on Wyckoff Price cycle theory . It automatically scans the Accumulation & Distribution phases on chart and Ai draws the possible areas before Mark up and Mark down which acts as hot zones and can be traded with confirmation to catch those big price movements . It's a great tool for both Reversal and Breakout Trades suitable to all Trading Styles such as Scalping - Intraday - Swing 
249 USD
CyberZingFx Trend Reversal
Afsal Meerankutty
4.26 (19)
Indicator captures the trend reversals with no-repaint Buy and Sell Arrow signals. CyberZingFx Trend Reversal Indicator - your go-to solution for accurate and reliable trend reversal signals. With its  advanced trading strategy , the indicator offers you Buy and Sell Arrow signals that do not repaint, making it a reliable tool for catching Swing Highs and Swing Lows in any market and any time frame. Indicator works on  any market  and  any time frames . __________________________________________
149 USD
Price Action Sniper is designed to trade the Price Action on the desired chart time frame. - Trend Reversals. - Trend Continuation. - Brekaouts. - Good tool for Binary Options Price action forms the basis for all technical analysis of a currency pair, commodity or other asset chart. Many short-term traders rely exclusively on price action and the formations and trends extrapolated from it to make trading decisions. Technical analysis as a practice is a derivative of price action since it uses
150 USD
Otros productos de este autor
PTS - Buscador de Compras por Divergencia de Precision Trading Systems El Buscador de Divergencias de Precisión fue diseñado para encontrar los mínimos del mercado con una precisión milimétrica y lo hace con frecuencia. En el análisis técnico, la habilidad de identificar mínimos generalmente es mucho más fácil que identificar máximos, y este elemento está diseñado precisamente para esa tarea. Después de identificar una divergencia alcista, es prudente esperar a que la tendencia se vuelva al
147 USD
El Indicador de Venta PTS Divergence Finder de Roger Medcalf - Precision Trading Systems. Este indicador solo proporciona indicaciones bajistas - de venta. En primer lugar, muchas veces me han preguntado por qué no proporcioné un indicador de divergencia de venta mientras proporcionaba felizmente un buscador de divergencias de señal de compra durante muchos años. Di la respuesta de que las divergencias de venta son menos confiables que las divergencias de compra, lo cual sigue siendo cierto. Se
147 USD
Demand Index
PrecisionTradingSystems
Código del PTS Demand Index de Precision Trading Systems El Demand Index fue creado por James Sibbet y utiliza un código complejo para simplificar la interpretación de volumen y precio como una combinación. Entender los volúmenes nunca es una tarea fácil, pero esta hermosa pieza de programación ciertamente facilita mucho las cosas. Existen varias formas en las que este indicador puede beneficiar tanto a los traders como a los inversores. Divergencias (Como indicador líder) Después d
75 USD
El Oscilador de Índice de Precisión (Pi-Osc) de Roger Medcalf de Precision Trading Systems La versión 2 ha sido cuidadosamente recodificada para cargar rápidamente en su gráfico y se han incorporado algunas otras mejoras técnicas para mejorar la experiencia. El Pi-Osc fue creado para proporcionar señales precisas de temporización de operaciones diseñadas para encontrar puntos de agotamiento extremos, los puntos a los que los mercados se ven obligados a llegar solo para eliminar las órdenes
147 USD
PTS - Buscador de Compras por Divergencia de Precision Trading Systems El Buscador de Divergencias de Precisión fue diseñado para encontrar los mínimos del mercado con una precisión milimétrica y lo hace con frecuencia. En el análisis técnico, la habilidad de identificar mínimos generalmente es mucho más fácil que identificar máximos, y este elemento está diseñado precisamente para esa tarea. Después de identificar una divergencia alcista, es prudente esperar a que la tendencia se vuelva al
147 USD
PTS Demand Index MT5
PrecisionTradingSystems
Código del PTS Demand Index de Precision Trading Systems El Demand Index fue creado por James Sibbet y utiliza un código complejo para simplificar la interpretación de volumen y precio como una combinación. Entender los volúmenes nunca es una tarea fácil, pero esta hermosa pieza de programación ciertamente facilita mucho las cosas. Existen varias formas en las que este indicador puede beneficiar tanto a los traders como a los inversores. Divergencias (Como indicador líder) Después d
75 USD
Filtro:
trick 86
269
trick 86 2023.12.02 18:12 
 

great tool!

Respuesta al comentario