KT Triple Top Bottom MT5
- Indicadores
- KEENBASE SOFTWARE SOLUTIONS
- Versão: 1.0
- Ativações: 5
KT Triple Top-Bottom identifies the triple top/bottom pattern with a breakout signal in the opposite direction. It is used to identify potential trend reversals.
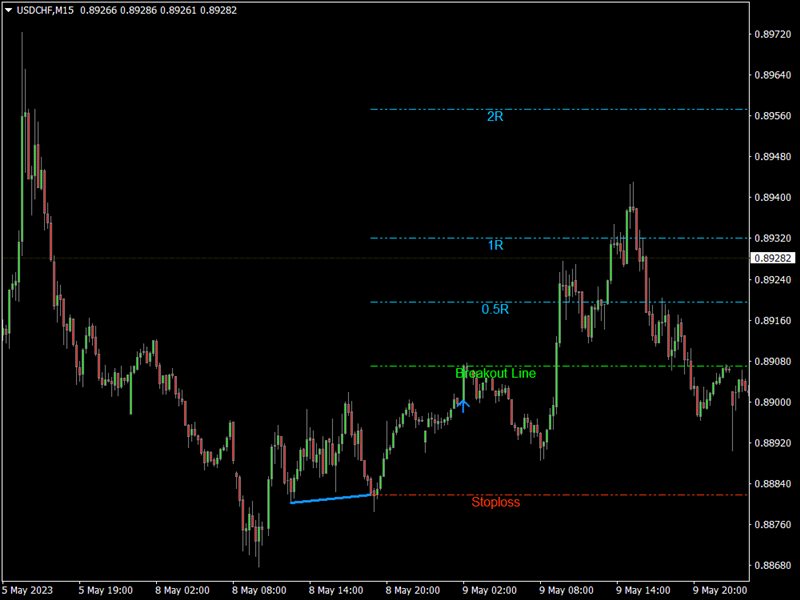
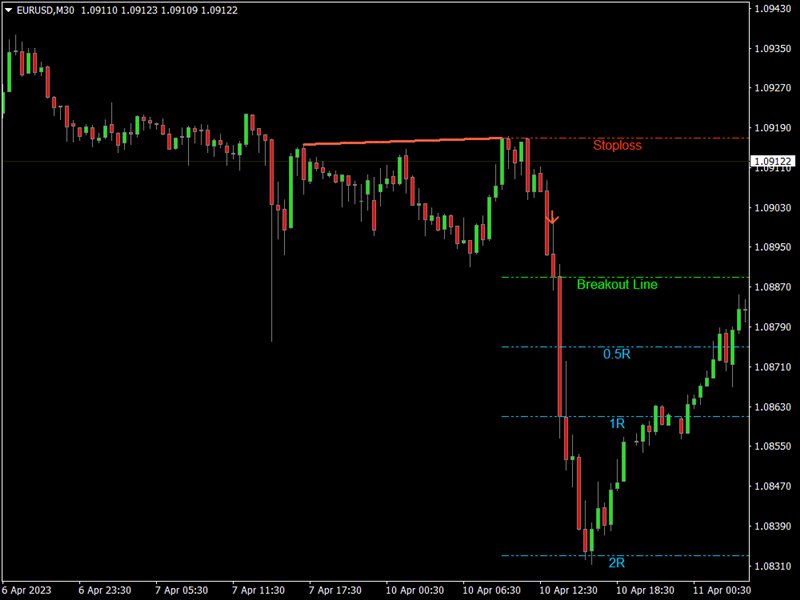
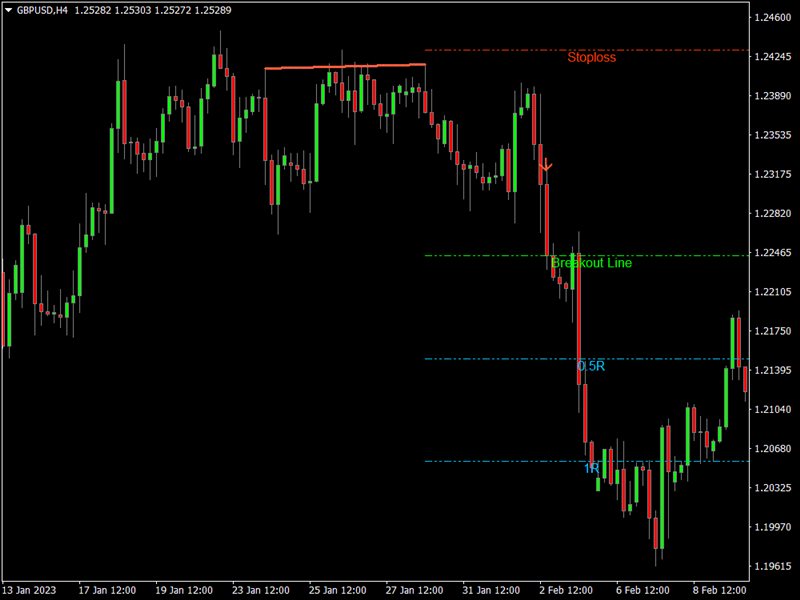
A Triple Top pattern is formed when the price reaches a high point three times, while a Triple Bottom pattern occurs when the price comes to a low point three times.
Features
- The indicator detects the triple top/bottom pattern with high precision and accuracy.
- The indicator suggests a shift in momentum, with sellers or buyers taking control.
- Indicates that the price has reached a resistance or support level multiple times and failed to break through it.
- It provides a clear visual representation of potential trend reversals.
- It may give traders an early indication of potential market movements, allowing for profitable trades.
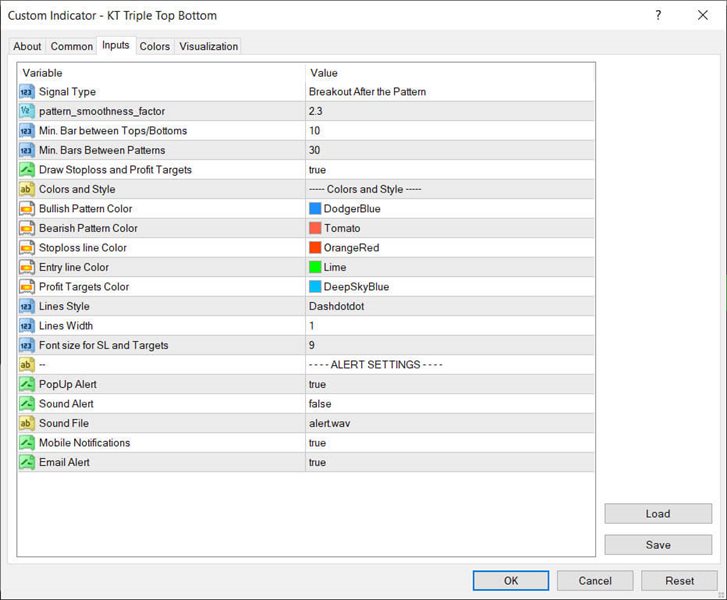
- It comes with all kind of Metatrader alerts.
The Triple Top Pattern
When a Triple Top pattern is formed, the price has reached a high point three times and failed to break through, suggesting significant resistance at that level.
This is a positive sign for traders looking to buy, as it clearly indicates where the market may be headed. By identifying the Triple Top pattern, traders can use it to set buy orders at a lower price point, expecting the price to bounce back up after hitting the support level.
The Triple Bottom Pattern
When a Triple Bottom pattern is formed, the price has reached a low point three times and failed to break through, suggesting significant support at that level.
This is a positive sign for traders looking to sell, indicating where the market may be headed. In addition, by identifying the Triple Bottom pattern, traders can use it to set sell orders at a higher price point, expecting the price to bounce back down after hitting the resistance level.


