Conheça o Mercado MQL5 no YouTube, assista aos vídeos tutoriais
Como comprar um robô de negociação ou indicador?
Execute seu EA na
hospedagem virtual
hospedagem virtual
Teste indicadores/robôs de negociação antes de comprá-los
Quer ganhar dinheiro no Mercado?
Como apresentar um produto para o consumidor final?
Expert Advisors e Indicadores para MetaTrader 5 - 2

This is the EA version of the Kenko Trend Indicator mt5. It follows the trend on all instruments and trading pairs according to my improved step and ladder technique.
INTRODUCTION For anyone studying forex charts, the aim is to identify trends, and spot reversals. If you have years of experience it may be easy, but most of us need something to make the trend apparent. If you're familiar with the popular renko charting method, you know that it was developed for this purpose. But renko cha

For anyone studying forex charts, the aim is to identify trends, and spot reversals. If you have years of experience it may be easy, but most of us need something to make the trend apparent. If you're familiar with the popular renko charting method, you know that it was developed for this purpose. But renko charting has a flaw; the trend is often broken by false reversals. So I developed my own version - the Kenko Trend Indicator. The kenko trend indicator draws renko style trend following block

Este indicador cria o RENKO perfeito para que possa trabalhar com esse tipo de Candle ATEMPORAL! Por ser atemporal, as setas indicativas de negociação ficariam perdidas, porém esse indicador as ajusta e as deixa exatamente onde ocorreu a negociação! Além de demonstrar exatamente a divisão entre os dias, de modo a deixar claro para o usuário onde começou e terminou cada pregão! Além disso, os seguintes indicadores foram incluídos, de modo a dar maior poder de análise em suas negociações: SuperTre

Este indicador cria o RENKO perfeito para que possa trabalhar com esse tipo de Candle ATEMPORAL! Por ser atemporal, as setas indicativas de negociação ficariam perdidas, porém esse indicador as ajusta e as deixa exatamente onde ocorreu a negociação! Além de demonstrar exatamente a divisão entre os dias, de modo a deixar claro para o usuário onde começou e terminou cada pregão!
Detalhes importantes: O RENKO gerado de forma automática possui acurácia de até 95% para renkos pequenos (5R) e 100% d
The Trade Tracker Library is used to automatically detect and display trade levels on custom charts.
It is an especially useful add-on for EAs that trade on custom charts in MT5. With the use of this library, the EA users can see trades as they are placed via the EA (Entry, SL & TP levels) in real-time.
The header file and two examples of EA skeleton files are attached in the comments section (first comment).
The library will automatically detect the tradable symbol for the following custom
The indicator displays a stock chart of a non-standard type, in which the price and time have the same value.
The usual chart of Japanese candlesticks does not take into account all the information that the time analysis can give. Renko charts do not use all the information that price can give in relation to time. The "Chart Price and Time" indicator takes into account price and time equally and shows the predominance of price or time.
Taking into account price and time equally gives an i

RENKO PRICE ACTION ATR é um "Expert Advisor" desenvolvido através da construção do Gráfico Renko aonde cada BRICK tem o tamanho calculado através do ATR do período selecionado pelo usuário. Os gráficos Renko são projetados para filtrar movimentos menores de preços, desta forma tornando mais fácil que os traders concentrem-se em tendências importantes. Devido à sua eficiência em detecção de tendências de preços é possível também identificar com muita clareza suportes e resistências assim como as
This non-trading expert utilizes so called custom symbols feature ( available in MQL API as well) to build custom charts based on history of real ticks of selected standard symbol. New charts imitate one of well-known graphic structures: Point-And-Figure (PnF) or Kagi. The result is not exactly PnF's X/O columns or rectangular waves of Kagi. Instead it consists of bars, calculated from and denoting stable unidirectional price moves (as multiples of the box size), which is equivalent to XO colum
In manual trading, many of the trading setups and opportunities provided by the KT Renko Patterns indicator are missed due to sudden price movements on the Renko charts.
KT Renko Patterns EA solves this problem by implementing a 100% automated trading strategy based on the "KT Renko Patterns indicator". After fetching the patterns formation and signals directly from the indicator, it performs some pre-checks and assessments to efficiently execute the trading positions.
All the dependencies

KT Renko Patterns scans the Renko chart brick by brick to find some famous chart patterns that are frequently used by traders across the various financial markets. Compared to the time-based charts, patterns based trading is easier and more evident on Renko charts due to their uncluttered appearance.
KT Renko Patterns features multiple Renko patterns, and many of these patterns are extensively explained in the book titled Profitable Trading with Renko Charts by Prashant Shah. A 100% automate
The utility allows you to build different types of graphs: Seconds chart from 1 second to 86400 seconds Tick chart from 1 tick and above The volume chart Delta chart Renko chart Range chart Product demo https://www.mql5.com/ru/channels/clustersecondforex Built-in indicators for volumetric analysis: daily market profile and market profile of the selected timeframe, Cluster Search Imbalance VWAP Dynamic POC, VAH, VAL the profile depth of the market vertical volume with various display options, del

Create and trade timeframes in seconds. The bar time duration is freely adjustable from 1 second and up. The chart is accurately constructed using real ticks from the broker's server. Main characteristics The indicator is an overlay on the main chart, making it possible to utilize one-click trading and on-chart order manipulation. History calculated using real tick data. Built-in technical studies: 4 moving averages (Simple, Exponential, Smooth, Linear-weighted, Volume-weighted using tick or rea

DYNAMIC SR TREND CHANNEL
Dynamic SR Trend Channel is a simple indicator for trend detection as well as resistance/support levels on the current timeframe. It shows you areas where to expect possible change in trend direction and trend continuation. It works with any trading system (both price action and other trading system that use indicators) and is also very good for renko charting system as well. In an uptrend, the red line (main line) serves as the support and the blue line serves as the

Renko Graph Gráfico de Renko O indicador Renko na janela do gráfico principal no local com o preço atual. O indicador exibe as mudanças de preço na forma de retângulos ("tijolos") contra o fundo de um gráfico de cotação regular. O movimento ascendente do preço, pelo número de pontos especificado nas configurações, é marcado pela adição acima do próximo retângulo anterior e movimento descendente - abaixo do retângulo anterior. O indicador é projetado para identificar visualmente a tendência pri

Renko is a well-known Japanese charting technique that removes time from the chart. Instead of drawing bars in constant intervals (time) as a normal chart would, a Renko chart does so only when price moves beyond a predefined amount.
In a Renko chart, a bar is created when price exceeds the previous bar’s high or low by a predefined amount or what we call the Box Size. The result is a chart with equally sized bars running up or down in 45 degree angles. Such a chart offers the following advant
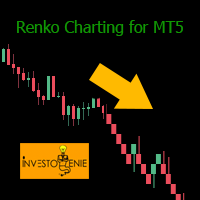
Renko indicator helps develop Renko charts on different symbols.
Advantages Drag and drop the indicator on M1 timeframe of the symbol chart Realtime updates Indicator can be used for Expert Advisors and technical analysis Backtest your strategy using Renko indicator
Parameters BOX SIZE: Input the number of box size. The box size reflects the difference of the symbol price. So, a 50 box size would reflect a 5 pip value difference in a currency pair symbol Show Wicks: If true , high or low of

The utility allows you to build different types of graphs: Seconds chart from 1 second to 86400 seconds Tick chart from 1 tick and above The volume chart Delta chart Renko chart Range chart Demo version of the utility https://www.mql5.com/ru/channels/clustersecond Built-in indicators for volumetric analysis: daily market profile and market profile of the selected timeframe, Cluster Search Imbalance VWAP Dynamic POC, VAH, VAL the profile depth of the market vertical volume with various display op

Introduction to Smart Renko The main characteristics of Renko Charting concern price movement. To give you some idea on its working principle, Renko chart is constructed by placing a brick over or below when the price make the movement beyond a predefined range, called brick height. Therefore, naturally one can see clear price movement with less noise than other charting type. Renko charting can provide much clearer trend direction and it helps to identify important support and resistance level

Price Breakout pattern Scanner is the automatic scanner for traders and investors. It can detect following patterns automatically from your chart. Head and Shoulder - Common tradable pattern. Reverse Head and Shoulder - This pattern is the reverse formation of the Head and Shoulder. Double Top - When the price hits resistance level twice and decline toward the support level, the trader can anticipate sudden bearish breakout through the support level. Double Bottom - The double bottom pattern is
Você sabe por que o mercado MetaTrader é o melhor lugar para vender as estratégias de negociação e indicadores técnicos? Não há necessidade de propaganda ou software de proteção, muito menos problemas de pagamentos. Tudo é providenciado no mercado MetaTrader.
Você está perdendo oportunidades de negociação:
- Aplicativos de negociação gratuitos
- 8 000+ sinais para cópia
- Notícias econômicas para análise dos mercados financeiros
Registro
Login
Se você não tem uma conta, por favor registre-se
Para login e uso do site MQL5.com, você deve ativar o uso de cookies.
Ative esta opção no seu navegador, caso contrário você não poderá fazer login.