Conheça o Mercado MQL5 no YouTube, assista aos vídeos tutoriais
Como comprar um robô de negociação ou indicador?
Execute seu EA na
hospedagem virtual
hospedagem virtual
Teste indicadores/robôs de negociação antes de comprá-los
Quer ganhar dinheiro no Mercado?
Como apresentar um produto para o consumidor final?
Indicadores Técnicos para MetaTrader 5 - 40

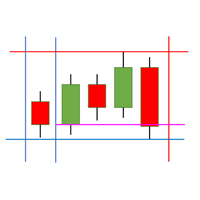
Plano de preços do padrão Koala Engulf
Passo 1: Gratuito para os primeiros 20 downloads.
Passo 2: Alugue 10 $ / ano para os próximos 20 downloads.
Passo 3: Alugue 20 $ / ano para os próximos 20 downloads.
Passo 4 ; Preço de compra para uso vitalício para os próximos 100 downloads 39 $.
Passo 5: O preço do tempo de vida final deste produto é 99 $.
Introdução ao padrão Koala Engulf
Indicador profissional MT5 para detectar o padrão de ação do preço.
Útil em
Hi, I'm a Japanese EA developer.
I made an indicator for MT5. It can be used as a guide for trends and as a guide for entry / exit.
Please use it by pasting it on a chart of about 1 minute to 15 minutes.
If you like, please watch the video.
Various usages 1. It is used to recognize the environmental advantage of buying or selling with the color of the line. If the line is red, it is advantageous to buy. If it is blue, it is advantageous to sell. Neither if there is no line. 2. Used as

O Chaikin Money Flow é um indicador criado nos anos de 1980 por Marc Chaikin para monitorar zonas de acumulação e distribuição de uma ação por um determinado período. O período padrão sugerido é de 21 dias. Esse indicador flutua em uma escala que parte de -1 até +1. Qualquer cruzamento da linha zero pode ser usado para confirmar mudanças no fluxo de dinheiro, que resulta em mudanças na direção do preço. Muitos traders usam esse indicador para medir a pressão de compra ou venda em um período, tam

painel para visão de tendência;
AutoSignals Trend O indicador rastreia a tendência em 5 tempos gráficos diferentes do mesmo ativo, tendo como base 6 sinais par cada tempo gráfico.
O indicador tem como principal objetivo, nos mostrar a tendência majoritária do ativo financeiro em que ele foi colocado. O sistema passa as informações das tendências em diversos tempos gráficos, dessa forma o usuário consegue ter uma visão ampla do movimento do ativo, este tipo de ferramenta faz com que o usuár

Size Bars – индикатор отображает на графике максимальный, минимальный, текущий и средний размер баров (свечей) за выбранный период.
Отображаемые параметры индикатора Size Bars: 1) Текущий размер бара в писах (по максимум/минимум, тело бара). 2) Максимальный, минимальный и средний размер свечей BUY . 3) Максимальный, минимальный, средний размер свечей SELL . 4) Количество свечей BUY и количество свечей SELL . 5) Среднее количество свечей подряд BUY и SELL . 6)

The 4 headed dragon is an indicator that has two functions. 1) Set the background trend. 2) Mark the predominant trend. By combining these two indicator signals, we will be able to trade for or against the trend, adapting the signals to your reading of the market.
You can download the demo and test it yourself.
1) Set the background trend.
Define four possibilities of trend that are the four heads of the dragon, marked by colors on the indicator, marking a) Powerful buying trend. b)
O indicador Volume Heatmap mostra visualmente a INTENSIDADE do volume levando em conta o conceito de desvio padrão. Finalidade do Indicador: Volumes altos são comuns onde há um forte consenso de que os preços irão aumentar. Um aumento no volume ocorre com frequência no início de uma nova tendência de alta no preço de um ativo. Alguns analistas técnicos não confiam em confirmações de tendências sem que exista um aumento significativo do volume. Volumes baixos geralmente ocorrem quando um ativo e

The algorithm of the Sup Trend indicator is to determine the dominant direction of price movement by algorithmic analysis of price values for a certain period of time. When calculating this indicator, logorithmic gains are first calculated at the closing price, which allows you to filter out the trend, seasonality and other inclusions that spoil the picture of volatility, then the standard deviation is plotted based on the data obtained. The algorithm takes into account the measurement of pri
Least Square MA Description: The Least Square Moving Average indicator allows you to assess the direction of the market movement and its possible reversals. The indicator is a line that is displayed in the price window. Input parameters: LSMA_Period - the period for calculating the moving average using the least squares method; Prediction - the number of candles used to construct the predicted moving average using the least squares method, provided that its rate (falling or growing remains); Dis

Indicator LTS for MT5 (Level + Trends + Speed)
The LTS indicator was specially created for quick analysis of consolidations on the chart, which greatly facilitates decision-making when trading. LTS marks resistance and gives information about the forces affecting it, as well as the current speed and average travel. The indicator is easily customizable and can analyze any timeframe. LTS uses a unique trend analysis algorithm based on 4 parameters from global to local.

Description
Volume Magic is an indicator that shows the value of the relative volume in conjunction with the direction of the current trend. The ratio of the current volume relative to the average volume for a certain period is displayed in the lower window as an oscillator. The direction of the current trend is displayed as two-color trend lines.
How to use?
First, use two-color trend lines to determine the direction of the current trend. Then look for areas of low volume and open positi

A média móvel aplicada ao gráfico de preços é uma das metodologias mais utilizadas dentro da análise técnica, desde os tempos em que surgiram os computadores pessoais. Existem diversas maneiras de utilizar as médias, entre elas, por meio da análise de cruzamentos.
Tradicionalmente, essa é uma das estratégias mais antigas que existe, ela consiste em utilizar duas médias móveis, uma de período rápida e uma de período lenta, o conceito é muito simples, quando houver um cruzamento da média móvel

O indicador CoioteAverageSpreed é uma releitura do indicador AverageSpreed. Ele mostra a relação de esforço x resultado entre o volume e a volatilidade do preço. Com o volume heatmap é possível identificar visualmente se o preço foi deslocado com uma quantidade maior de volume e se o deslocamento do preço apresentou maior resultado ou não. É possível identificar momentos de ignição e exaustão do movimento, além de injeções de fluxo para dar continuidade a um movimento.
Stochastic Pivot draws a point on the chart at Stochastic overbought or oversold. During overbought periods, this indicator will draw the pivot point at the high of the highest candle and at the low of the lowest candle during oversold periods. NB : All pivots are updated 'on tick' and 'on any chart event' immediately Settings Name Description Upper Limit Set Stochastic Overbought Level
Lower Limit
Set Stochastic Oversold Level %KPeriod Set Stochastic K Period %DPeriod Set Stochastic D Per

CoioteWeisWave é uma releitura do indicador de VSA WeisWave com indicação do estouro de fractal, método de analise dos TradersPiolhos e implementado originalmente pelo Trader Dario Junqueira. A versão Coiote foi reprojetada para indicação da volatilidade do volume no fractal. A coloração adicional (azul e magenta) dão sinais de entrada, saída e pontos de gerenciamento, podendo ser usados também como suporte e resistência.
Existem 3 modos de exibição do weis wave, por volume total, por range e p

Scanner de Ação de Preço Koala - Liberando o Poder da Ação de Preço Introdução: Descubra o novo Scanner de Ação de Preço Koala - uma ferramenta versátil, multi-moeda e multi-time frame projetada para detectar padrões essenciais de ação de preço e apresentá-los em uma tabela de scanner intuitiva. Resumo: Este indicador vai além do comum, oferecendo aos usuários a capacidade de identificar padrões-chave de ação de preço em várias moedas e time frames. Recursos: Padrão de Engolfo (Engulf Pattern) P

NOTA: Para testador de estratégias [DEMO] realizar o procedimento abaixo: Nos inputs do indicador selecionar a data e hora de ancoragem; No intervalo do teste (calendário) selecionar o dia onde a VWAP será ancorada...
Sobre a VWAP Custom Date Esse indicador pode ser ancorado a partir de uma data e hora específica, fazendo dessa VWAP um indicador tanto de Day-Trade quanto de Swing Trade. Funcionamento muito parecido, senão igual, às plataformas profissionais de trading como PF, Trd... O que é
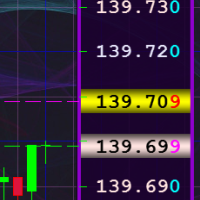
Индикатор предназначен для замены стандартной вертикальной ценовой шкалы, расположенной с правой стороны в окне графика клиентского терминала, на более удобную ценовую шкалу с возможностью детальной настройки параметров отображения этой шкалы. Кроме этого, индикатор позволяет делать фоновую заливку окна графика любым изображением по желанию пользователя и двухцветную сетку с элементами её тонкой настройки. В первую очередь, индикатор будет полезен трейдерам, обладающим не самым лучшим зрением,

The DYJ CandleShape contains 80 candlestick Patterns, such as MORNING STAR, DOJI STAR, HARAMI CROSS,INVERT HAMMER,ENGULFING..... candlestick is a valid form of market technical analysis. The recommended short stoploss is near the highest price of the first three to five candles The recommended long stoploss is near the lowest price of the first three to five candles Input
InpPeriodSMA =10 -- Period of averaging InpAlert =true -- Enable. alert InpCountBars =

O oscilador Haos codificado para o MT5! Este oscilador permite verificar regiões de sobrecompra/sobrevenda em dois períodos (14 e 96, por exemplo) possibilitando antecipar uma reversão.
Possiblidade de ativar um alerta sonoro quando atinge um nível definido. Possiblidade de escolher o som do alerta colocando uma música .wav em cada ativo ou timeframe. (salvar um arquivo .wav na pasta MQL5\Files)
Possibilidade de ativar/desativar histograma e níveis para deixar a tela mais limpa.
Cores persona

The background trend is an indicator that helps us to know the trend that is dragging the market. The indicator has 2 possibilities: 1) If the indicator is above zero the trend is buying and the indicator will be green.
2) If the indicator is below zero, the trend is selling and the indicator will be red.
You can download the demo and test it yourself.
The indicator has a text help in the upper right corner, in which it shows whether the indicator has a bullish or

O Initial Balance (Equilíbrio Inicial/Balanço inicial) é um conceito relacionado ao estudo de volume (para saber mais, estude sobre Market Profile e Auction Market Theory. É possível encontrar alguns vídeos em inglês ao pesquisar "Initial Balance Market Profile").
O IB define um range em que os preços foram negociados na primeira hora do pregão. A amplitude do range é importante e o rompimento do range definido pelo Initial Balance pode ter ocorrido pelo movimento de diversos players operando

O indicador VTC Vo latility foi escrito para auxiliar em uma estratégia da bolsa brasileira no WDO (USDBRL), mas pode ser adaptado para outras estratégias e mercados. Na nova atualização do indicador, agora é permitido escolher até 4 níveis para determinar o range, e assim ser mais versátil.
A bolsa brasileira (B3) possui o VTC que é uma "Operação Estruturada de Volatilidade de Taxa de Câmbio" (mais informações no site da B3). Próximo das 10:00 horas sai o "Call" do VTC e as corretoras brasi
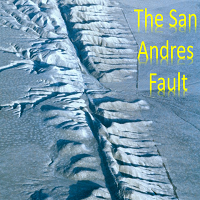
The San Andres Fault is an indicator designed to detect the movements that make the market tremble. This system detects a tremor and marks its intensity in real time to decide in your operation. In addition, the recording of the sismic signal allows us to interpret movement patterns that help us in decision making You can download the demo and test it yourself.
The indicator has a text help in the upper right corner, in which it shows whether the indicator has a bullish or bearish b

THE SOUND OF MARKET is an indicator designed to detect the sound produced for the market movement. This system detects the background sound produced by market movements in real time to decide in your operation. In addition, by analyzing the sound recorded in the indicator, we can detect operational patterns. You can download the demo and test it yourself.
The indicator has a text help in the upper right corner, in which it shows whether the indicator has a bullish or bearish backgro

TClusterSearch - индикатор для поиска кластеров согласно заданным критериям. Для работы индикатора требуются реальные биржевые обьемы. Основная функциональность
Поиск и визуализация кластеров с обьемом, задаваемым фильтрами (до трех). Для каждого фильтра можно задать свой цвет. Поиск и визуализация кластеров с дельтой большей значения задаваемым фильтром Поиск и визуализация кластеров по бид/аск согласно фильтру Возможность фильтровать кластера в зависимотсти от его положения относительно б
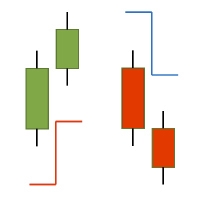
The ATR-StopLoss-Line indicator for MT5 calculates a stoploss line by the Average-True-Range (ATR) - Value of the particular candle. As point of reference you can choose the High/Low or Close of the particular candle. The indicator is suitable for scalping and intraday trading. The indicator does not redraw (recalculate). Signals are generated strictly on the "Close of the bar". It can be used as a standalone tool or together with other indicators. Alerts on Colorchanges are activatable.
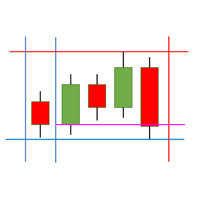
The SessionLines indicator for MT5 shows up the most important time intervalls and price levels in the DAX-Index. The following times get marked: Opening Time DAX Future, Opening Time DAX Kassa, Closing Time DAX Kassa, Closing Time DAX Future, Opening Time US Index Futures, Opening Time US Kassa Markets, Spezial Times, The following price levels get marked: Daily High/Low, Previous Daily High/Low, Weekly High/Low, Opening and Cloth Levels of Future and Kassa Daily (inkl. Previous Day).
The SessionLines indicator for MT5 shows up the most important time intervalls and price levels in the US- Indices .
The following times get marked: Opening Time US Futures, Opening Time US Kassas, Closing Time US Kassas, Spezial Times,
The following price levels get marked: Daily High/Low, Previous Daily High/Low, Weekly High/Low, Opening and Cloth Levels of Futures Daily (inkl. Previous Day).

MOUNTAINS:It is an indicator that detects market consolidations prior to a movement.
The objective of this indicator is to indicate the areas before the market makes a move.
The areas that we are interested in detecting are the PLATEAU, which are between the slopes.
When the system detects a PLATEAU , the trader must place his operation in that area, waiting for the increase in volatility to reach its target.
The best option to carry out the operation of the PLATEAU is th

Volume Analysis Trader looks at volume using a fixed average of volume. This averaging helps spot when volume is rising or declining. Also I have added volume spikes which are when volume suddenly is above the average. These help spot market reversals.
This will hep a trader look for the following in their trading:
Rising volume during a rally shows trend is strong. Falling volume on a rally shows trend is weakening. As a rule of thumb on daily charts if current volume is higher than yester
Pullback Probability It is an indicator that shows us the probability that the price will t urn around and we can operate that market turn.
The indicator marks a line that oscillates between a percentage of 0% to 100%.
The one indicated in the upper left corner shows us a help in which it informs us of the area in which the price is in real time, as well as the percentage that the candle is open. You can download the demo and test it yourself.
The indicator marks 6 work zones. 1) Above 80

Os Canais de Keltner, são poderosas ferramentas da análise técnica com o intuito de aproveitar as oportunidades criadas pela volatilidade dos preços. O indicador foi desenvolvido originalmente pelo americano Chester W. Keltner, na década de 1960, e é bastante utilizado, em especial no mercado americano.
Porém apesar da alta usabilidade no mercado, o Keltner Channel sofre com um problema de ter apenas 2 canais, o que dificulta muito saber a hora certa de entrar ou sair em uma posição. Sendo a

As Bandas de Bollinger estão entre os indicadores mais utilizados na análise técnica, o seu autor é o americano John Bollinger, analista financeiro e grande colaborador da área. John começou a desenvolver essa técnica na década de 1980 e em 2001 lançou o seu livro Bollinger on Bollinger Bands.
As bandas de Bollinger são muito úteis para indicar níveis de preço em que uma ação pode ter se valorizado ou desvalorizado demais, além de indicarem sinais de Topos e Fundos. O indicador é calculado a
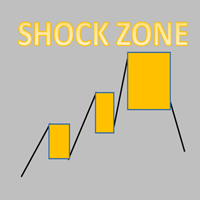
Every trading shock range is a point of gaining momentum!
The stop loss is generally the height of the shock zone.
Take profit depends on personal preference and market position. Generally at least double the height of the shock zone. Being in a good market position, it can have a profit-loss ratio of 5-10
Necessary for traders: tools and indicators Waves automatically calculate indicators, channel trend trading Perfect trend-wave automatic calculation channel calculation , MT4 Perfect

Provide ideas for trend trading.
Automatic calculation and generation of trend channels.
The channel line, also known as the pipeline line, is to draw a straight line parallel to the trend line in the opposite direction of the trend line, and the straight line crosses the highest or lowest price of the recent period. These two lines run the price in the middle and have obvious pipe or channel shapes. Necessary for traders: tools and indicators Waves automatically calculate indicators, chann
Este indicador determina os canais ao longo dos quais os preços se movem no histórico de negociação. Existem muitas estratégias de negociação que dependem da negociação de canal em um rompimento de canal. Este indicador pode desenhar canais de preços lendo informações de vários períodos de tempo ao mesmo tempo (do atual, do segundo e do terceiro). Você pode personalizar a cor e a espessura das linhas para cada período. Além disso, você pode definir uma distância diferente entre altos e baixos pa

O BTFX Pivot Points é um indicador que calcula os níveis de Suporte e Resistência para cada dia. Ao usar este indicador, os níveis de pivô apontam objetivos claros. Os níveis de resistência são mostrados em roxo acima da linha de pivô prateada. Os níveis de suporte são mostrados em laranja e podem ser encontrados abaixo da linha de pivô prateada. Este indicador funciona muito bem quando usado com o indicador BTFX Daybreak. Para uma explicação mais detalhada sobre esses indicadores, ass

The RealCryptoLevels indicator by downloading the order book of crypt exchanges with maximum depth shows horizontal volumes of popular crypto currencies on the chart, so you can see not only the volumes, but also the levels and them strength (see screenshots), which is very important for successful trading in all strategies from scalping to medium-term trading, because you can see the preferences of buyers and sellers at the moment and their mood for the future. The indicator pulls volume data

Genetic Code , is an indicator that differentiates two types of market: the market in range and the market with volatility.
This indicator allows the trader to choose whether to use a range trade or a volatility trade. You can download the demo and test it yourself.
When observing the trace of the indicator it shows us narrow areas that correspond to market ranges.
These ranges always end with a volatility process, so you can work with two conditional pending orders.
When th

Fluxo de ordens audível, podemos definir um tom diferente para até 12 tamanhos de ordens de compra e outros 12 tamanhos para ordens de venda.
Estão disponíveis até 84 notas musicais ou seja 7 oitavas.
As configurações padrão foram testadas no Forex (EURUSD, GBPUSD, XAUUSD, USDJPY, USDCHF andUSDMXN) e nos ativos futuros brasileiros (WDOFUT, DOLFUT, WINFUT e INDFUT).
Essa ferramenta foi inspirada em uma entrevista com um trader deficiente visual, como não existem ferramentas para esse tipo

DNA is an indicator that allows us to operate both in favor of a trend and a pullback.
You can download the demo and test it yourself.
Trend trading is above zero and pullback trading is below zero.
The direction of the operation is marked by the color of the line.
If the line is green it corresponds to purchases.
If the line is red it corresponds to sales.
For example, if the green line is above zero and growing, we will have an uptrend operation. If the red line is above zero and

DNA is an indicator that allows us to operate both in favor of a trend and a pullback. You can download the demo and test it yourself.
Trend trading is above zero and pullback trading is below zero.
The direction of the operation is marked by the color of the line.
If the line is green it corresponds to purchases.
If the line is red it corresponds to sales.
For example, if the green line is above zero and growing, we will have an uptrend operation. If the red line is above zero and

Indicador multimoeda e multitimeframe do Canal de Desvio Padrão. Exibe a direção atual do mercado. No painel você pode ver rompimentos e toques (por preço) dos níveis do canal de regressão linear. Nos parâmetros, você pode especificar quaisquer moedas e prazos desejados. Além disso, o indicador pode enviar notificações quando os níveis são atingidos. Ao clicar em uma célula, este símbolo e ponto final serão abertos. Este é o scanner MTF.
A chave para ocultar o painel do gráfico é “D” por padr
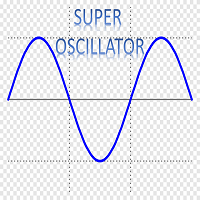
Super Oscillator , is a powerful indicator that vibrates along with the market, resulting in a very useful tool to improve and decide your trading.
You can download the demo and test it yourself.
In a versatile indicator that in a single graph shows us information about four different aspects of the market
1) 4 operational zones. The indicator divides the screen into 4 zones that allows us to properly assess the moment of the market. a) Pullback Buy Trend. If the indicator is ab

DAILY STATS PANEL is a small panel that shows some statistic of opened chart. For example: Fibonacci resistance and support, daily average moving points and today's moving range, etc. After applied this expert advisor to chart, a small panel will be shown on the right. ** NOTE: This is not an algo trading expert advisor. **
Input parameters show_pivot - Whether or not to show pivot, resistance and support line on the chart. Pivot Color - R1-R4, Pivot and S1-S4 horizontal line colors.
Stati

Swing Point Volume , o indicador que sinaliza fraqueza e força nos topos e fundos. Este indicador pode ser usado no Método Wyckoff.
Informações fornecidas; - Swing em ticks customizados. - Volume e pontos em cada Swing realizado. - Porcentagem de Deslocamento. - Opção de Alerta sonoro nas rupturas de topos e fundos. - Volume em ticks e Real Volume. - Volume HL(extremos) ou (abertura e fechamentos) - Formas de volume customizadas.

O Indicador ATR Projeção se destaca como uma ferramenta robusta na análise técnica, projetada para fornecer insights precisos sobre os limites potenciais de movimentação dos preços no mercado financeiro. Sua abordagem flexível permite aos usuários customizar as métricas de análise de forma intuitiva, adaptando-se às necessidades específicas de cada ativo operado. Funcionamento Personalizável: Por padrão, o ATR Projeção opera considerando 30% da média dos últimos 100 candles. Essa flexibilidade p

Se você é um trader ativo e busca uma maneira eficaz de interpretar os movimentos do mercado financeiro, você vai adorar conhecer o Weis Wave Box. Este incrível indicador foi projetado para oferecer uma análise visual clara e precisa das ondas de volume, juntamente com a plotagem dos pontos de swing correspondentes. Com suas cinco formas de swing personalizáveis e outras características exclusivas, o Weis Wave Box se destaca como uma ferramenta indispensável para traders experientes e novatos.

Smoothing Oscillator , is a powerful indicator that vibrates along with the market, resulting in a very useful tool to improve and decide your trading. This indicator is a smoothed version of the Super Oscillator MT5 that you can download at this link https://www.mql5.com/es/market/product/59071 The idea of this indicator is to smooth and limit the aggressiveness of the previous indicator, it has less power in terms of pullback points but has more power to detect trends and consolidations Yo

You ask yourself the question every time you open your charts: how to win in trading? Will using a lot of indicators work? well know that I also asked myself the same questions when I first started trading. After testing many indicators, I realized that winning trading is simple and accurate trading. after several months of thinking and optimizing I was able to find my solution: Candle Good Setup Candle Good setup is a trend and entry timing indicator analyzing the market in multi-frame to give

Are you tired of drawing Support & Resistance levels for all charts of the same Symbol while doing Multi-Timeframe analysis? Well, if you are Price Action trader then this indicator will solve your problem. Draw on 1 Timeframe and it will auto-sync with other charts of the same Symbol. You can draw rectangles, lines, arrows, and eclipse. It will give an alert when touched/break on line and arrow. It work's on all Timeframe.
Major Update
Added::
1}Triangle
2}Fibonacci Retracement
3}

This utility is a universal meta-indicator that enables you to use any other indicator calculated over the higher timeframe (HTF) data. Now you may find precise entries and exits on working timeframe with no need of switching to a higher timeframe. You no longer need to purchase HTF version of you favorite indicators.
Indicator parameters: inp_ind_name - name of the indicator that should be calculated on the selected timeframe. You can choose from: the list of built-in indicators (e.g. MA for

This indicator watch the Fibonacci retracement for levels and timeframes selected by the trader. In the workload of day trading, having your eyes on all the timeframes to validate some information, for Fibonacci traders, is really time consuming and requires constant focus. With this in mind, this tool allows you to have your attention on other trading details while this one monitors the retracements of each timeframe in real time. In the charts, this indicator data (retracement %, age of the r

Crash 1000 Alert is an indicator that alerts trader when price is in the CRASH ZONE. The defaults settings work best only on Crash 1000 Index but are also fully customizable.
How to use: When price enters the crash zone, the indicator will send out messages of a potential crash. Traders can use this info to enter sell trades and capitalize on the spike down. Notifications and alerts are sent to your mobile device and platforms respectively. NB: please make sure notifications are enabled

This utility is a universal meta-indicator that enables you to use any other indicator calculated over the higher timeframe (HTF) data. Now you may find precise entries and exits on working timeframe with no need of switching to a higher timeframe. You no longer need to purchase HTF version of you favorite indicators.
Indicator parameters: inp_ind_name - name of the indicator that should be calculated on the selected timeframe. You can choose from: the list of built-in indicators (e.g. M

Para utilizar o indicador Long e Short de forma eficaz e aproveitar as correlações entre diferentes ativos, é importante seguir algumas etapas fundamentais. Entenda a base do indicador: Familiarize-se com as métricas e cálculos subjacentes do indicador Long e Short. Compreenda como ele correlaciona os pares de moedas, índices ou criptomoedas e identifica as correlações positivas ou negativas entre esses ativos. Analise as correlações entre ativos: Utilize o indicador Long e Short para monitorar

Description
Money Zones is an indicator that determines accumulation/distribution zones in the market. Green zones make it possible to look for buy entry points or sell exit points. Red zones, on the contrary, define the opportunity for selling or closing buys. The indicator has the ability to define money zones for two timeframes simultaneously on the same chart.
How to use?
Use this indicator to identify market zones as support/resistance zones to determine the best conditions for marke
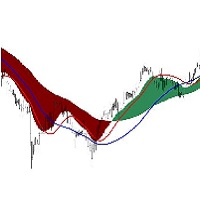
The Visual MACD Indicator is a forex technical analysis tool based on Moving Average Convergence Divergence, but it is plotted directly on the main trading chart with two macd signals. You should look for buy trades after the yellow line crosses the blue line and the MACD wave is blue. Similarly, you should look for sell trades after the yellow line crosses the blue when the MACD wave is red and the price is below the blue line . Go ahead and add it to your best trading system. It fits all
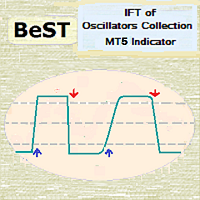
BeST_IFT of Oscillators Collection is a Composite MT4/5 Indicator that is based on the IFT ( Inverse Fisher Transformation ) applied to RSI , CCI , Stochastic and DeMarker Oscillators in order to find the best Entry and Exit points while using these Oscillators in our trading. The IFT was first used by John Ehlers to help clearly define the trigger points while using for this any common Oscillator ( TASC – May 2004 ). All Buy and Sell Signals are derived by the Indicator’s crossings of the Bu

Description :
VWAP (Volume-Weighted Average Price) is the ratio of the value traded to total volume traded over a particular time horizon. It is a measure of the average price at which pair is traded over the trading horizon. Read More.
All Symbols and All Timeframes are supported.
Indicator Inputs :
VWAP Mode : Mode of VWAP Calculation. Options can be selected : Single,Session,Daily,Weekly,Monthly
Volumes : Real Volumes,Tick Volumes
Price Type : Used price for cal

This is a momentum Indicator adapted to work on lower timeframes for Boom and Crash Indeecies. However the indicator can work with other Synthetic Indecies.
The indicator trend colour is set default to Aqua, then sell signal, the colour changes to red and blue signifies buy signals. .
For non Boom nor Crash Indecies use a smaller period and slightly increase the deviation.
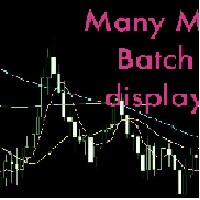
The moving average is the easiest indicator to recognize changes in the price of a currency.
It is excellent to set multiple indicators for each period or type and see the transition.
However, setting multiple moving averages is very troublesome, isn't it?
Moreover, displaying multiple currency pairs will increase the time and effort.
It is an indicator that saves you the trouble.
You can display multiple moving averages at once.
You can freely set up to 4 lines, line thickness,

Saiba em tempo real qual lado, compra ou venda, está exercendo maior pressão através de uma visualização simples e eficiente do Depth of Market. O indicador calcula a soma das ofertas nas profundidades especificadas e exibe o percentual de cada lado em relação ao total. O Indicador PressureBook é totalmente personalizável, nele você pode: Selecionar qual ativo deseja acompanhar. Por default, o ativo selecionado é o mesmo do gráfico em que o indicador foi inserido; Definir a quantidade de níveis
Imagine a support tool that Colors Up the candlesticks on your chart according to the market behavior, based on Trend , Momentum , Price Behavior, and/or Volume . You choose what to use! Well, welcome to the Minions Labs creation called Impulse Detector ! This flexible indicator is designed to give visual support on your chart using just colored candlesticks, so you can continue to draw your studies, use any other indicators in auxiliary sub-windows without affecting your screen real state. It d
O indicador do canal Forex é projetado com valores extremos de preço para um período específico em mente.
O indicador é composto por três linhas distintamente coloridas que se assemelham às das Bandas de Bollinger.
Sinais básicos de negociação
Buy Signal: Vá longo quando o preço abre e fecha acima da linha média média do indicador e negocia ao longo da borda superior do canal.
Sinal de venda: Vá curto quando o preço abre e fecha abaixo da linha azul média do indicador e negocia ao longo

Leave a review for this product, and receive another "Free" product that you choose. You can see my other products here: https://www.mql5.com/en/users/zakri/seller
Trend Detective is an advanced trend detection indicator which shows accurate entry points in direction of trend. It uses smart technology in order to detect entry points, trend changing points, and TP points. It also shows hit rate for current chart using selected parameters. Hit rate for this indicator on different charts can be

FXC iMACD-DivergencE MT5 Indicator
This is an advanced MACD indicator that finds trend-turn divergences on the current symbol. The indicator detects divergence between the MACD and the price movements as a strong trend-turn pattern.
Main features: Advanced divergence settings
Price based on Close, Open or High/Low prices Give Buy/Sell open signals PUSH notifications
E-mail sending Pop-up alert Customizeable Information panel Input parameters: MACD Fast-EMA: The Fast-EMA variable of the MACD
Concept of Market Profile was created at Chicago Board of Trade (CBOT) by trader Peter Steidlmayer and first published during the 1980s as CBOT product. Market profile by itself is not a stand-alone strategy, but a different way how you can view the market and make better trading decisions.
They have seen a market as an auction process which is affected by supply and demand the same way as every other auction, for example, development of prices of food, gas etc.
The price goes up as long th
Scan all your favorite pairs with RSI, and get notified on your preferred time frames.
Settings are Customizable
Click to change time frame or open new pairs
Notification: Phone/Popup/Email The relative strength index (RSI) is a technical indicator used in the analysis of financial markets. It is intended to chart the current and historical strength or weakness of a pair/stock based on the closing prices of a recent trading period. The RSI is most typically used on a 14 period, measured on
O mercado MetaTrader é um espaço, sem precedentes, para negociar robôs e indicadores técnicos.
Leia o artigo Manual do usuário da MQL5.community para saber mais sobre os serviços exclusivos que oferecemos aos traders: cópia de sinais de negociação, aplicativos personalizados desenvolvidos por freelances, pagamentos automáticos através de sistema de pagamento e a rede em nuvem MQL5.
Você está perdendo oportunidades de negociação:
- Aplicativos de negociação gratuitos
- 8 000+ sinais para cópia
- Notícias econômicas para análise dos mercados financeiros
Registro
Login
Se você não tem uma conta, por favor registre-se
Para login e uso do site MQL5.com, você deve ativar o uso de cookies.
Ative esta opção no seu navegador, caso contrário você não poderá fazer login.