Simple indicator to draw support and resistance lines on daily and monthly charts

MQL4 Indicadores

Trabalho concluído

Tempo de execução 1 dia
Comentário do desenvolvedor
Great customer

Termos de Referência

I need someone to help me program an indicator which can draw horizontal levels of support and resistance.

The levels I use are based off of the highs and lows occurring on the daily chart and monthly chart. Particularly, I am interested in seeing levels where price reverses and forms a top or bottom.

On the daily chart, I define a top as a candle high where there are 75 bars before and after the peak where there is no higher price. Conversely, a bottom is defined as a low where there are no lower lows +/- 75 bars about the candle. The indicator should draw horizontal levels/lines at these tops and bottoms. Here is an example:
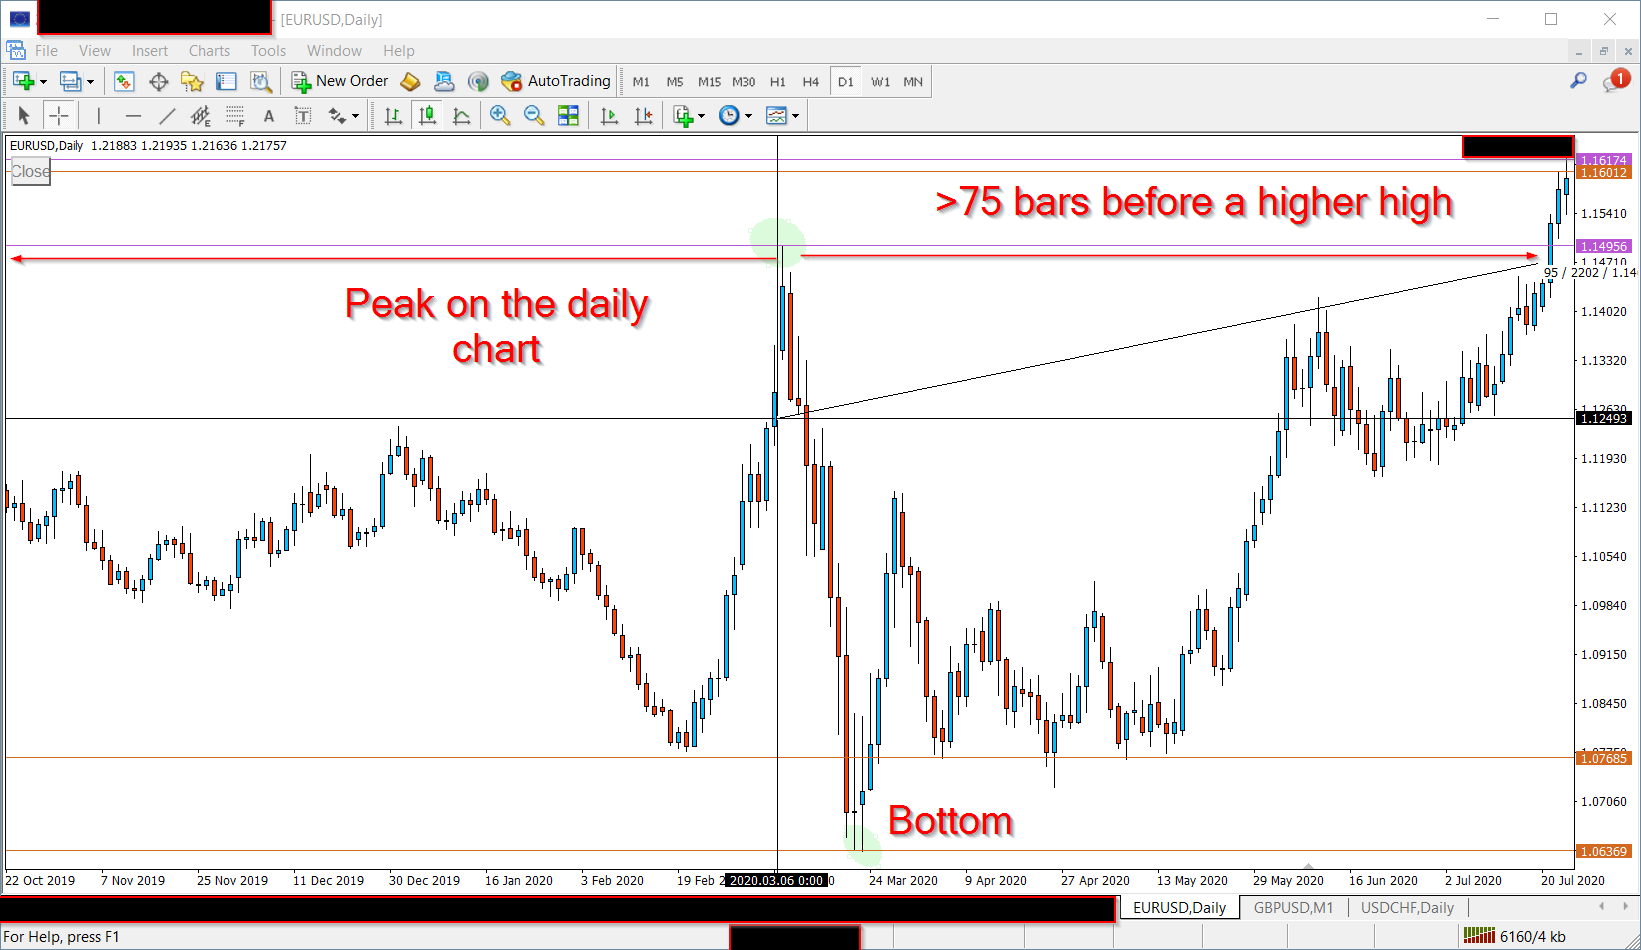

Daily levels example


On the monthly chart, the tops and bottoms are defined in the same way. However, depending on how many bars there are before a new high/low, I classify the top and bottom as either a “minor monthly levels” and “major monthly levels”. A minor monthly peak occurs when there is a candle high where the next 4 bars, and the previous 4 bars, are not higher than that candle high. A major monthly peak occurs when there is a candle high and the next 8 bars and previous 8 bars are below that high. The opposite definition applies for lows.


The major monthly levels, minor monthly levels, and daily levels should have different style properties (e.g. thicker lines, different colors).

To make it easier to see the peaks, colored circles should be drawn at the identified highs/lows (I put examples of how they should look on the top image above, but didn't bother drawingthem on the bottom image).


Here Is an example of a monthly chart with all the levels drawn in manually. Hopefully, the indicator can reproduce this.
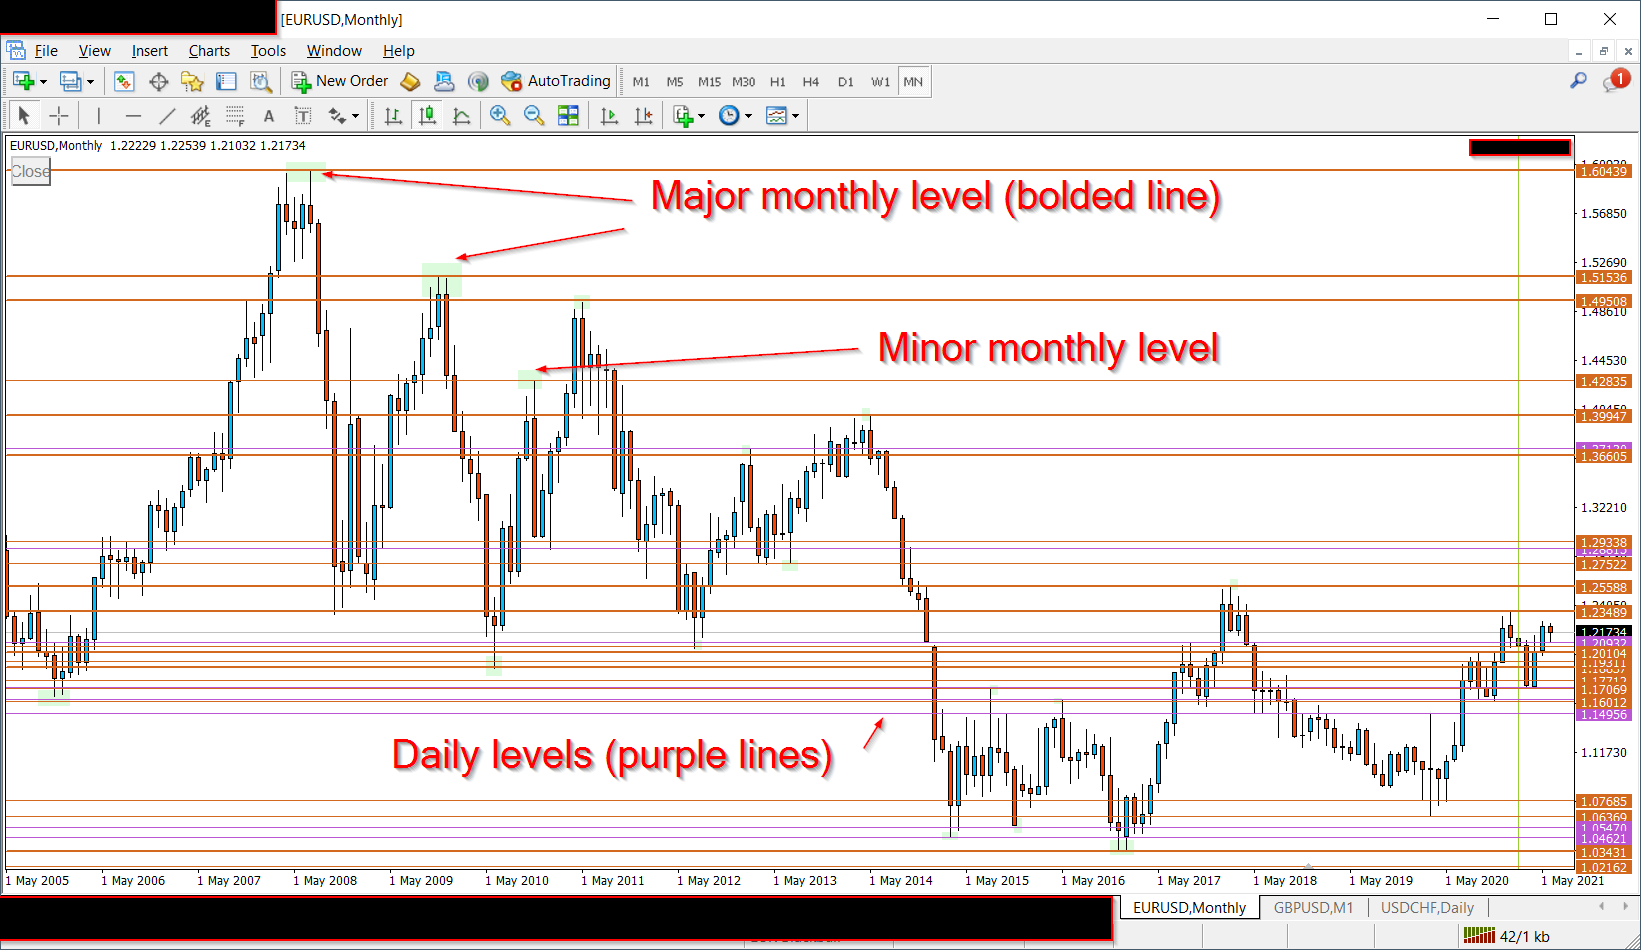
Monthly and daily levels example


Other requirements and notes:
•    Sometimes, a peak will meet the requirements for drawing a line on the daily chart and the monthly chart. In this case, the line should be drawn as a monthly level.
•    The date of the peak/bottom should be included in the line description.
•    Sometimes, I will need to edit the style of the lines (e.g. make the lines thicker or change their color). So that the indicator knows not to delete or change the edited line, I will add the word “EDITED” to the horizontal line name. The indicator should look for this word, and if it is present, not try to redraw the line or delete the line.
•    The number of bars which define a peak/bottom should be a parameter which can be changed.
•    To save on system resources, the indicator does not need to redraw the lines often. It would be okay for it to only check for new lines when the indicator is initialized (e.g. when the terminal starts or the timeframe is changed).
•    The indicator should be able to draw the lines without having to switch to the daily or monthly timeframes in the chart window (but if this is not possible, let me know. I can also switch to the higher timeframe charts periodically)

Thank you, I look forward to working with you

Respondido

1
Desenvolvedor 1
Classificação
(390)
Projetos
416
30%
Arbitragem
74
19% / 72%
Expirado
52
13%
Trabalhando
2
Desenvolvedor 2
Classificação
(68)
Projetos
127
41%
Arbitragem
19
47% / 53%
Expirado
33
26%
Livre
3
Desenvolvedor 3
Classificação
(1)
Projetos
2
0%
Arbitragem
3
0% / 100%
Expirado
0
Livre
4
Desenvolvedor 4
Classificação
(111)
Projetos
139
43%
Arbitragem
9
33% / 44%
Expirado
6
4%
Livre
5
Desenvolvedor 5
Classificação
(14)
Projetos
21
24%
Arbitragem
9
33% / 44%
Expirado
8
38%
Livre
6
Desenvolvedor 6
Classificação
(195)
Projetos
395
28%
Arbitragem
155
20% / 52%
Expirado
112
28%
Livre
7
Desenvolvedor 7
Classificação
(472)
Projetos
491
75%
Arbitragem
6
67% / 17%
Expirado
0
Trabalhando
8
Desenvolvedor 8
Classificação
(96)
Projetos
143
76%
Arbitragem
0
Expirado
2
1%
Livre
Pedidos semelhantes
Is there anyone with an indicator that give signal after head and shoulder pattern is formed in Volatility indices? The indicator will wait for the second shoulder to be formed before giving an arrow of buy or sell
Hi, I want to develop a highly accurate, custom technical indicator for MetaTrader 5 (MT5) specifically tailored for 1-minute Binary Options trading (Quotex). I do NOT need an automated trading bot. I only need visual buy/sell arrows on the chart, an advanced alert system, and an on-chart performance statistics dashboard. The indicator must be 100% non-repainting. --- 1. STRATEGY CONFLUENCE LOGIC The indicator should
Create a bot that can trade and read indicators easy to read for first time users. Bot that can be used on a phone and connect to MT5. It should be easy to install or use on any device especially phone and laptop, preferably the bot that can run over night and controllable when needed
These are orderflow footprint indicator I would like to know if you can algorithmisie and build a stacked imbalance bot from them .. Kindlt let me know if you can do it and check the file before replying me
I have 2 trading view indicators by GainzAlgo that I want code to mt5 , could u advise? I need you to give me response if you can convert This
I DO NOT need any programming or strategy development. I already have a working NinjaTrader 8 automated strategy based on a 3/5 EMA crossover. I need you to run my existing strategy through NinjaTrader Strategy Analyzer/Optimizer, test the existing adjustable parameters, and find robust settings with the best profit factor and lowest reasonable drawdown. I will provide the existing NinjaScript ZIP. I do not want the
Platform: TradingView Programming Language: Pine Script v6 Type: Custom Indicator Project Name: Scalping Reaction Zones + Valid Order Blocks MAIN GOAL I need a custom TradingView indicator for scalping. The indicator must detect: 1. Reaction / Explosion Zones 2. Valid Order Blocks 3. Combined Reaction Zone + Order Block zones The indicator should NOT generate: Buy signals Sell signals TP SL Entry signals Trading
Project Description I am looking for an experienced MQL5/MT5 Expert Advisor developer to develop an automated trading EA for XAUUSD on the M3 timeframe , running on an Exness account . The EA will automate a manual strategy based on SNR/GAP zones , using two setup types: Price Rejection Price Correction The EA should identify valid BUY/SELL setups around predefined SNR/GAP areas, apply configurable RSI, SMA, EMA and
Indicador Maximas e Minimas + Super Trend O Indicador MAX/MIN é um indicador de análise técnica para o MetaTrader 5 , desenvolvido para ajudar você a identificar regiões importantes de preço e possíveis oportunidades de compra e venda. O que ele faz MAX/MIN: identifica máximas e mínimas relevantes do mercado e mostra os preços no gráfico. HH / HL / LH / LL: ajuda a visualizar a estrutura do mercado, mostrando quando
Hello Traders, Have a trading strategy or idea you want to automate? I specialize exclusively in MQL5 development, helping traders turn their concepts into professional trading solutions. Custom Expert Advisors — automate your strategy and reduce manual execution Custom Indicators — transform your market ideas into powerful trading tools Fix & Debug — identify errors and get your existing code working properly

Informações sobre o projeto

Orçamento
30 - 40 USD
Prazo
para 5 dias