 모든 주문
모든 주문
 규칙
규칙
작업 종료됨

명시
I need someone to help me program an indicator which can draw horizontal levels of support and resistance.
The levels I use are based off of the highs and lows occurring on the daily chart and monthly chart. Particularly, I am interested in seeing levels where price reverses and forms a top or bottom.
On the daily chart, I define a top as a candle high where there are 75 bars before and after the peak where there is no higher price. Conversely, a bottom is defined as a low where there are no lower lows +/- 75 bars about the candle. The indicator should draw horizontal levels/lines at these tops and bottoms. Here is an example:
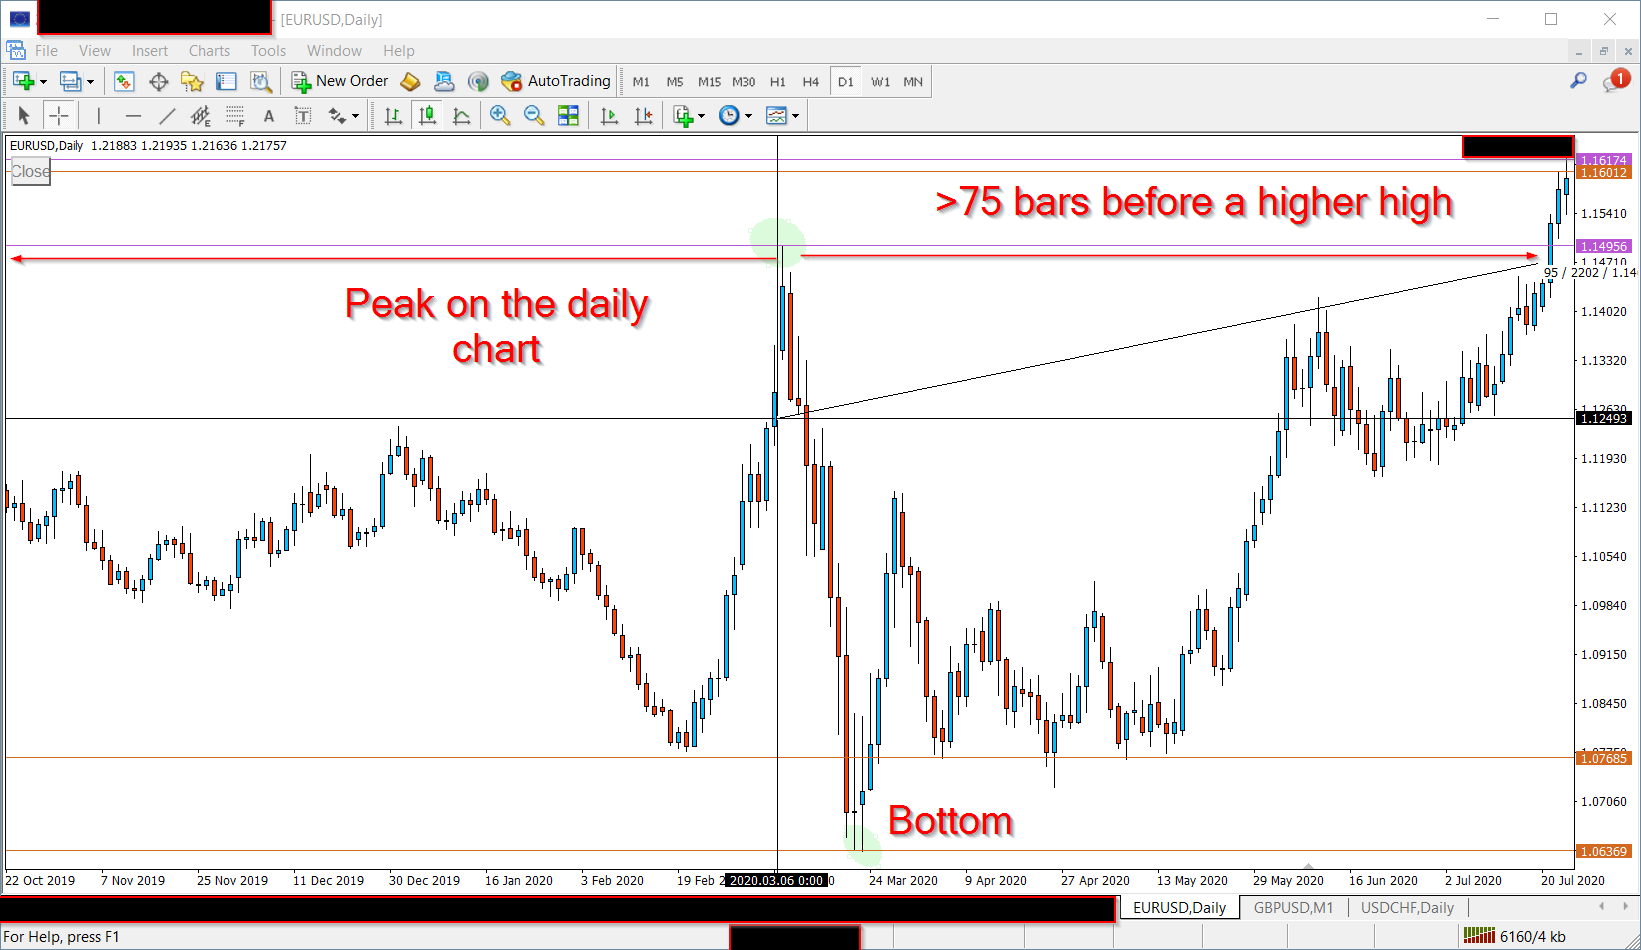
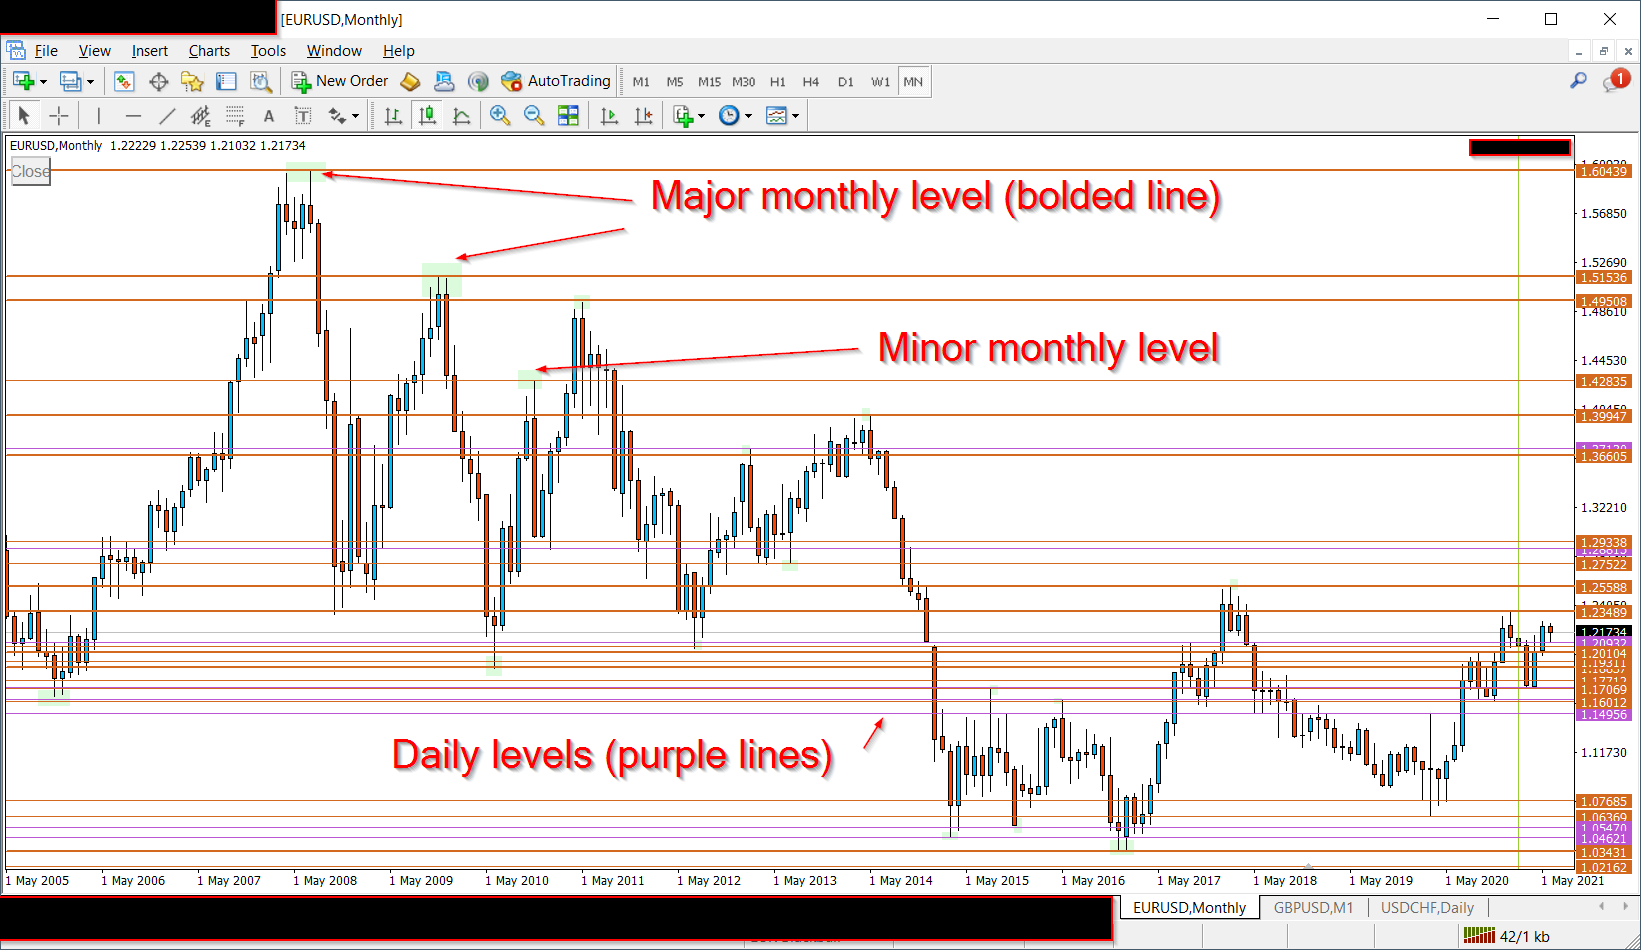
On the monthly chart, the tops and bottoms are defined in the same way. However, depending on how many bars there are before a new high/low, I classify the top and bottom as either a “minor monthly levels” and “major monthly levels”. A minor monthly peak occurs when there is a candle high where the next 4 bars, and the previous 4 bars, are not higher than that candle high. A major monthly peak occurs when there is a candle high and the next 8 bars and previous 8 bars are below that high. The opposite definition applies for lows.
The major monthly levels, minor monthly levels, and daily levels should have different style properties (e.g. thicker lines, different colors).
To make it easier to see the peaks, colored circles should be drawn at the identified highs/lows (I put examples of how they should look on the top image above, but didn't bother drawingthem on the bottom image).
Here Is an example of a monthly chart with all the levels drawn in manually. Hopefully, the indicator can reproduce this.
Other requirements and notes:
• Sometimes, a peak will meet the requirements for drawing a line on the daily chart and the monthly chart. In this case, the line should be drawn as a monthly level.
• The date of the peak/bottom should be included in the line description.
• Sometimes, I will need to edit the style of the lines (e.g. make the lines thicker or change their color). So that the indicator knows not to delete or change the edited line, I will add the word “EDITED” to the horizontal line name. The indicator should look for this word, and if it is present, not try to redraw the line or delete the line.
• The number of bars which define a peak/bottom should be a parameter which can be changed.
• To save on system resources, the indicator does not need to redraw the lines often. It would be okay for it to only check for new lines when the indicator is initialized (e.g. when the terminal starts or the timeframe is changed).
• The indicator should be able to draw the lines without having to switch to the daily or monthly timeframes in the chart window (but if this is not possible, let me know. I can also switch to the higher timeframe charts periodically)
Thank you, I look forward to working with you