Simple indicator to draw support and resistance lines on daily and monthly charts

MQL4 Indikatoren

Auftrag beendet

Ausführungszeit 1 Tag
Bewertung des Entwicklers
Great customer

Spezifikation

I need someone to help me program an indicator which can draw horizontal levels of support and resistance.

The levels I use are based off of the highs and lows occurring on the daily chart and monthly chart. Particularly, I am interested in seeing levels where price reverses and forms a top or bottom.

On the daily chart, I define a top as a candle high where there are 75 bars before and after the peak where there is no higher price. Conversely, a bottom is defined as a low where there are no lower lows +/- 75 bars about the candle. The indicator should draw horizontal levels/lines at these tops and bottoms. Here is an example:
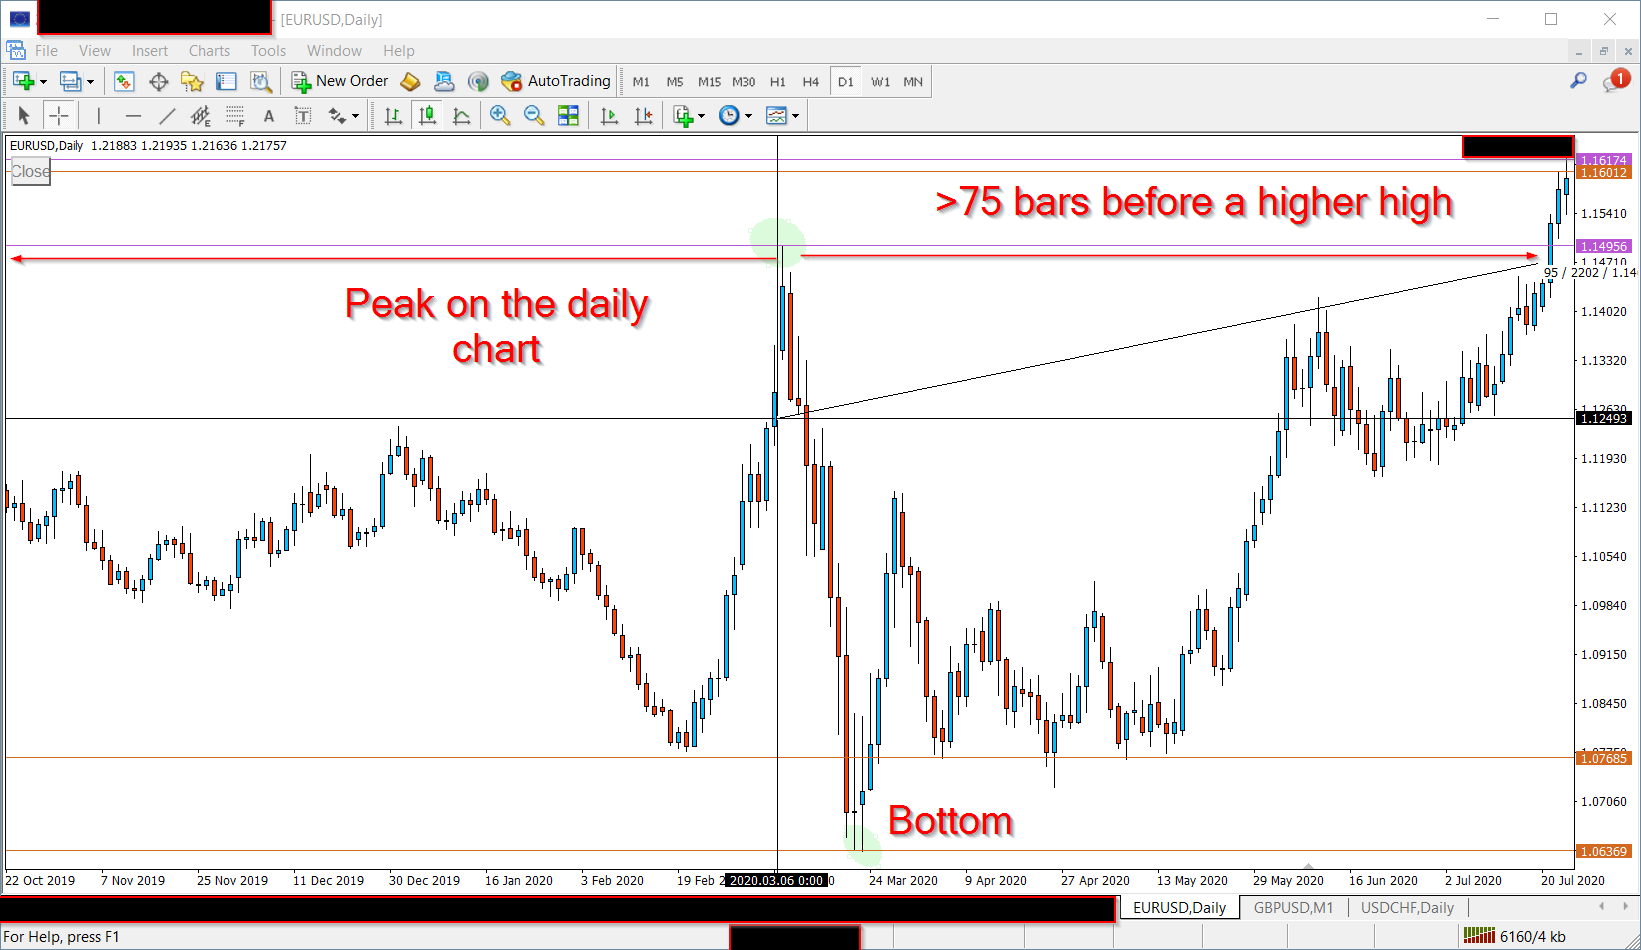

Daily levels example


On the monthly chart, the tops and bottoms are defined in the same way. However, depending on how many bars there are before a new high/low, I classify the top and bottom as either a “minor monthly levels” and “major monthly levels”. A minor monthly peak occurs when there is a candle high where the next 4 bars, and the previous 4 bars, are not higher than that candle high. A major monthly peak occurs when there is a candle high and the next 8 bars and previous 8 bars are below that high. The opposite definition applies for lows.


The major monthly levels, minor monthly levels, and daily levels should have different style properties (e.g. thicker lines, different colors).

To make it easier to see the peaks, colored circles should be drawn at the identified highs/lows (I put examples of how they should look on the top image above, but didn't bother drawingthem on the bottom image).


Here Is an example of a monthly chart with all the levels drawn in manually. Hopefully, the indicator can reproduce this.
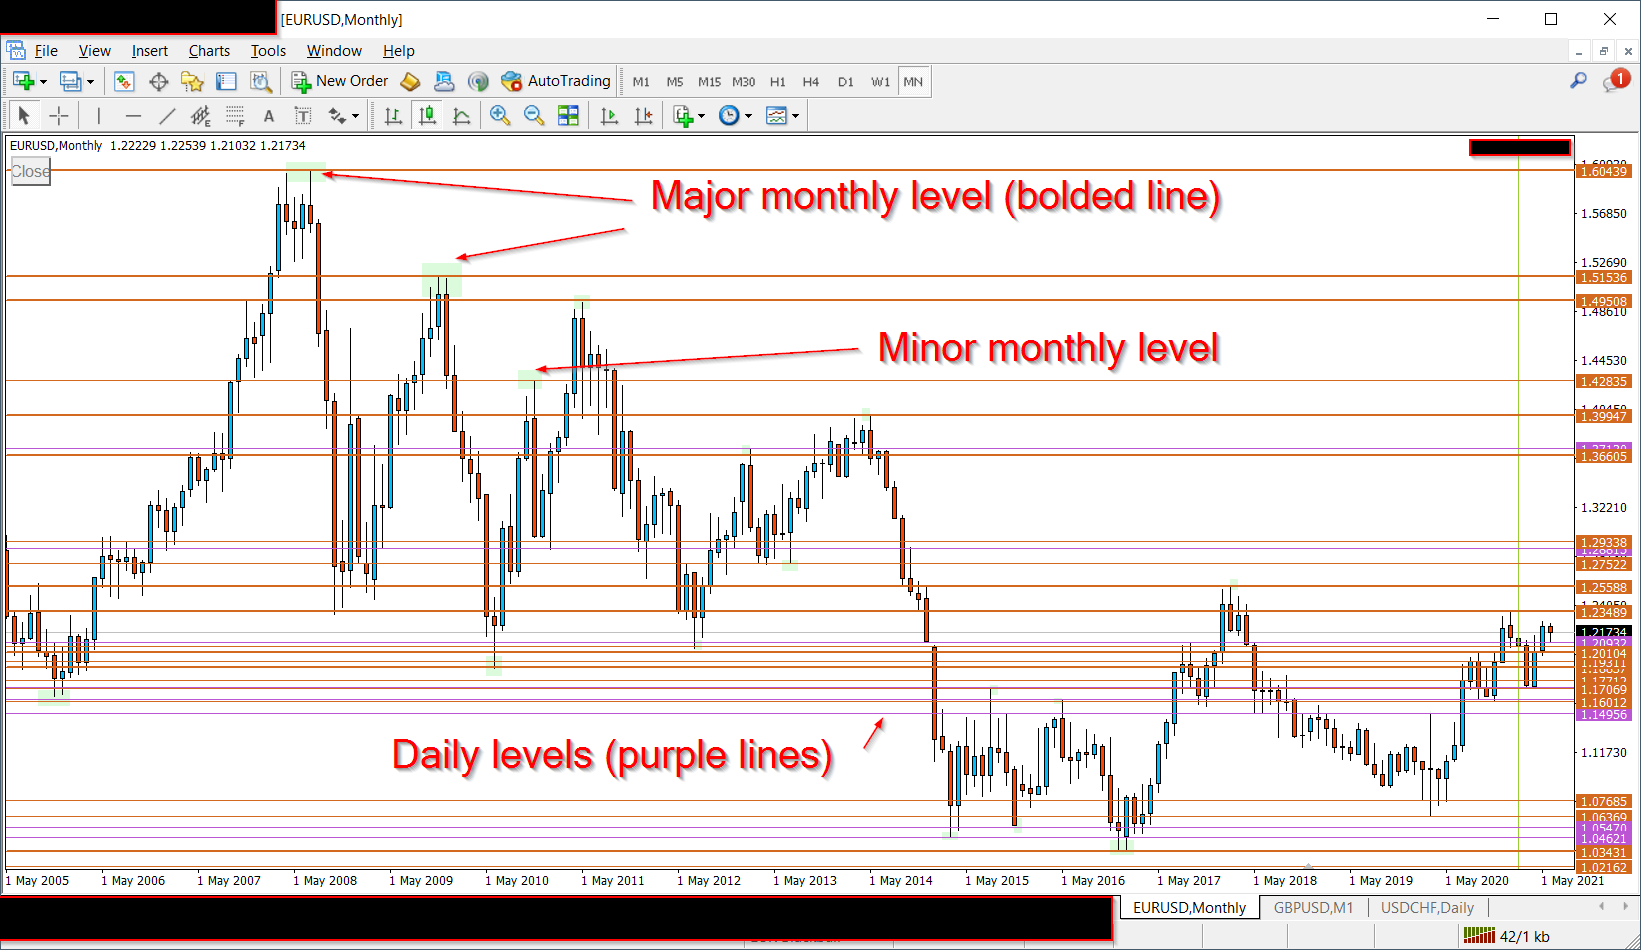
Monthly and daily levels example


Other requirements and notes:
•    Sometimes, a peak will meet the requirements for drawing a line on the daily chart and the monthly chart. In this case, the line should be drawn as a monthly level.
•    The date of the peak/bottom should be included in the line description.
•    Sometimes, I will need to edit the style of the lines (e.g. make the lines thicker or change their color). So that the indicator knows not to delete or change the edited line, I will add the word “EDITED” to the horizontal line name. The indicator should look for this word, and if it is present, not try to redraw the line or delete the line.
•    The number of bars which define a peak/bottom should be a parameter which can be changed.
•    To save on system resources, the indicator does not need to redraw the lines often. It would be okay for it to only check for new lines when the indicator is initialized (e.g. when the terminal starts or the timeframe is changed).
•    The indicator should be able to draw the lines without having to switch to the daily or monthly timeframes in the chart window (but if this is not possible, let me know. I can also switch to the higher timeframe charts periodically)

Thank you, I look forward to working with you

Bewerbungen

1
Entwickler 1
Bewertung
(390)
Projekte
416
30%
Schlichtung
74
19% / 72%
Frist nicht eingehalten
52
13%
Arbeitet
2
Entwickler 2
Bewertung
(68)
Projekte
126
40%
Schlichtung
18
44% / 56%
Frist nicht eingehalten
33
26%
Arbeitet
3
Entwickler 3
Bewertung
(1)
Projekte
2
0%
Schlichtung
3
0% / 100%
Frist nicht eingehalten
0
Frei
4
Entwickler 4
Bewertung
(111)
Projekte
139
43%
Schlichtung
9
33% / 44%
Frist nicht eingehalten
6
4%
Frei
5
Entwickler 5
Bewertung
(14)
Projekte
21
24%
Schlichtung
9
33% / 44%
Frist nicht eingehalten
8
38%
Frei
6
Entwickler 6
Bewertung
(195)
Projekte
395
28%
Schlichtung
155
20% / 52%
Frist nicht eingehalten
112
28%
Frei
7
Entwickler 7
Bewertung
(471)
Projekte
490
75%
Schlichtung
6
67% / 17%
Frist nicht eingehalten
0
Arbeitet
8
Entwickler 8
Bewertung
(96)
Projekte
143
76%
Schlichtung
0
Frist nicht eingehalten
2
1%
Frei
Ähnliche Aufträge
Version document : 1.0 Plateforme : TradingView Langage : Pine Script v6 Type : Indicateur d'analyse et d'aide à la décision (non-exécutant) 1. Présentation du projet Nom du produit ONYX SR V2 — Intelligent Support & Resistance Scalping System Objectif Créer un indicateur TradingView capable d'identifier automatiquement des opportunités de scalping basées sur : supports et résistances dynamiques ; action du prix ;
I have a EA/indicator that I want built. I should say 1st off dont know how to code myself so I will be using AI to verify that the source code is complete and matches the documents spec or if better so if you can not truly do the job do not waste either of out time. This is a idea I came.up wit and used AI to produce a framework for it.... and of course AI isn't 100% accurate so I need a knowledgeable quantitative
TumiiFX 30 - 20000 USD
1. Use two EMAs: 20 and 50. If EMA 20 is above EMA 50 → uptrend (look for buys) If EMA 20 is below EMA 50 → downtrend (look for sells) 2. Wait for a pullback into the area between the two EMAs. - For buys: price must touch or move between EMA 20 and EMA 50 during the last few candles. - For stils: same idea, but in a downtrend. 3. Entry signal: Buy: a bullish engulfing candle in an uptrend after the pullback
I am looking for an experienced MQL4 developer to build a professional High-Frequency Trading (HFT) / Low-Latency Expert Advisor for MetaTrader 4 (MT4) . The EA will be deployed on an IC Markets Live account and should be optimized for the fastest possible execution using a low-latency VPS located in LD4 or NY4 . The primary instruments will be US30 and XAUUSD (Gold) . The goal is to create an EA capable of
A robot 50+ USD
HIGH-FREQUENCY M5/M15 CONCURRENT ENTRY SNIPER import time class HighFrequencySniper: def __init__(self): self.target_profit = 25.00 # Targeted Delta Move self.max_execution_time = 3600 # 1 Hour Sandbox (Seconds) self.lot_allocation = "CALIBRATED_TO_RISK" def execute_hft_scan(self, current_price, m5_rsi, m15_order_block): print(f"[SCANNING] Current Kernel Metric: ${current_price:.2f
I need a trading bot, please i need this project urgently and when messaing me kindly send me samples of past works and dont forget i need the project to be done as soon as possible
A lightweight MT5 chart overlay displaying total floating P&L, average entry price, combined lot size, and current symbol exposure as a percentage of account balance, all updating in real time with color-coded profit/loss indicators, delivered with clean object-oriented source code and no DLL dependencies
QUIERO CONSEGUIR EL CODIGO FUENTE DE ESTE INDICADOR QUE ME GUSTA MUCHO TAMBIEN TIENE EL NOMBRE DE ET BANDS O ENTRY EXIT TIMING . no se los componentes pero estas son las imagenes. que mejor lo describen
I am looking to convert my existing TradingView Pine Script (v5) strategy into an MQL5 Expert Advisor (EA) for MetaTrader 5. Strategy Details: Asset: Gold (XAUUSD) Timeframe: 15-minute Strategy Logic: The strategy is based on a breakout concept. Anchor Candle: The base calculation starts from the Specified Candle Entry Window: The EA should only look for entries As Per Indicator Risk Management: The strategy
I want to find a Developer to perform this work and settle payments in this Application. I undertake not to communicate with Applicants anywhere else except this Application, including third-party messengers, personal correspondence or emails. I understand that violators will be banned from publishing Orders in the Freelance

Projektdetails

Budget
30 - 40 USD
Ausführungsfristen
bis 5 Tag(e)