Assista a como encomendar um robô de negociação
Leia as Regras antes começar a trabalhar
Como Encomendar um Robô de Negociação em MQL5 e MQL4
Consulte o exemplo de Termos de Referência para solicitar um robô
Novo na categoria:
30 - 100 USD
31 - 200 USD
Trabalho concluído
Tempo de execução 21 horas
Comentário do cliente
Super fast and supportive developer!
Comentário do desenvolvedor
Thank you for your trust!
Termos de Referência
I have csv file with certain dates and times (60 min). Example of few lines in csv =>
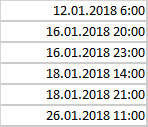
I need a tool (script, indicator) which takes my data and for 60m candle graph draws an arrow down above candle as indicated in my file . For each file load I should be able to chose color of arrows - i can load several csv files with different date_times. Since files may contain 2-3 years - i need simple way also to wipe the arrows (if not possible i can then just delete the chart).
Respondido
1
Classificação
Projetos
644
26%
Arbitragem
92
72%
/
14%
Expirado
12
2%
Trabalhando
Publicou: 1 código
2
Classificação
Projetos
8
13%
Arbitragem
1
0%
/
100%
Expirado
0
Livre
3
Classificação
Projetos
258
61%
Arbitragem
4
50%
/
25%
Expirado
10
4%
Livre
4
Classificação
Projetos
146
34%
Arbitragem
13
8%
/
62%
Expirado
26
18%
Livre
Publicou: 6 códigos
Informações sobre o projeto
Orçamento
30+ USD
Prazo
para 1 dias