Смотри, как быстро заказать торгового робота
Ознакомьтесь с правилами перед работой
Как заказать торгового робота на MQL5 и MQL4
Посмотри пример Технического задания для заказа робота
Новое в категории:
30 - 100 USD
31 - 200 USD
30 - 80 USD
Работа завершена
Время выполнения 21 час
Отзыв от заказчика
Super fast and supportive developer!
Отзыв от исполнителя
Thank you for your trust!
Техническое задание
I have csv file with certain dates and times (60 min). Example of few lines in csv =>
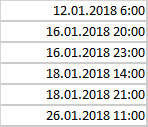
I need a tool (script, indicator) which takes my data and for 60m candle graph draws an arrow down above candle as indicated in my file . For each file load I should be able to chose color of arrows - i can load several csv files with different date_times. Since files may contain 2-3 years - i need simple way also to wipe the arrows (if not possible i can then just delete the chart).
Откликнулись
1
Оценка
Проекты
644
26%
Арбитраж
92
72%
/
14%
Просрочено
12
2%
Работает
Опубликовал: 1 пример
2
Оценка
Проекты
8
13%
Арбитраж
1
0%
/
100%
Просрочено
0
Свободен
3
Оценка
Проекты
258
61%
Арбитраж
4
50%
/
25%
Просрочено
10
4%
Свободен
4
Оценка
Проекты
146
34%
Арбитраж
13
8%
/
62%
Просрочено
26
18%
Свободен
Опубликовал: 6 примеров
Информация о проекте
Бюджет
30+ USD
Сроки выполнения
до 1 дн.