Wie man einen Handelsroboter schnell bestellen kann
Lesen Sie bitte zuerst die Regeln durch
Wie man einen Handelsroboter in MQL5 und MQL4 in Auftrag gibt
Hier ist das Muster einer Anforderungsspezifikation, um einen Roboter zu bestellen
Auftrag beendet
Ausführungszeit 21 Stunden
Bewertung des Kunden
Super fast and supportive developer!
Bewertung des Entwicklers
Thank you for your trust!
Spezifikation
I have csv file with certain dates and times (60 min). Example of few lines in csv =>
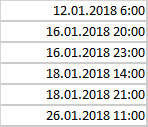
I need a tool (script, indicator) which takes my data and for 60m candle graph draws an arrow down above candle as indicated in my file . For each file load I should be able to chose color of arrows - i can load several csv files with different date_times. Since files may contain 2-3 years - i need simple way also to wipe the arrows (if not possible i can then just delete the chart).
Bewerbungen
1
Bewertung
Projekte
644
26%
Schlichtung
92
72%
/
14%
Frist nicht eingehalten
12
2%
Arbeitet
Veröffentlicht: 1 Beispiel
2
Bewertung
Projekte
8
13%
Schlichtung
1
0%
/
100%
Frist nicht eingehalten
0
Frei
3
Bewertung
Projekte
258
61%
Schlichtung
4
50%
/
25%
Frist nicht eingehalten
10
4%
Frei
4
Bewertung
Projekte
146
34%
Schlichtung
13
8%
/
62%
Frist nicht eingehalten
26
18%
Frei
Veröffentlicht: 6 Beispiele
Projektdetails
Budget
30+ USD
Ausführungsfristen
bis 1 Tag(e)