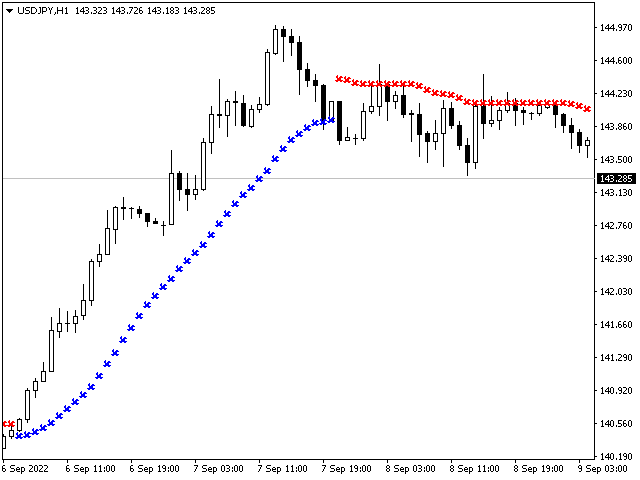
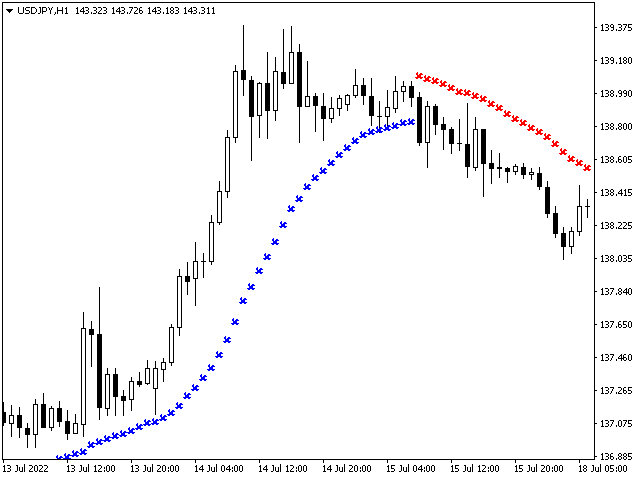
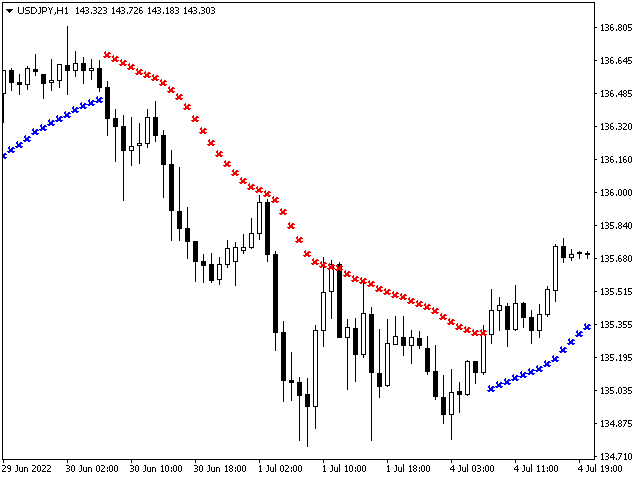
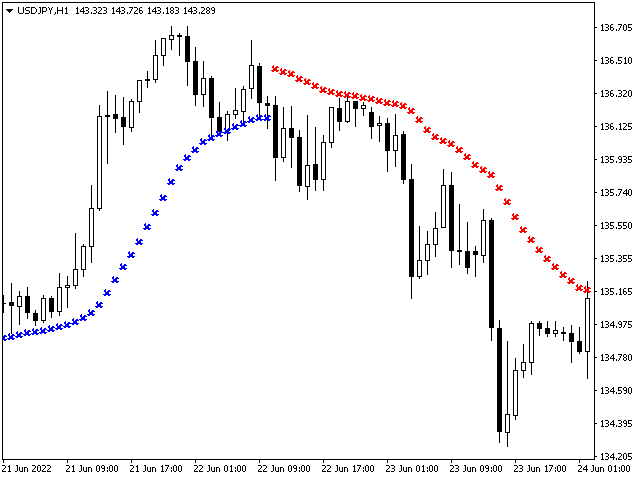
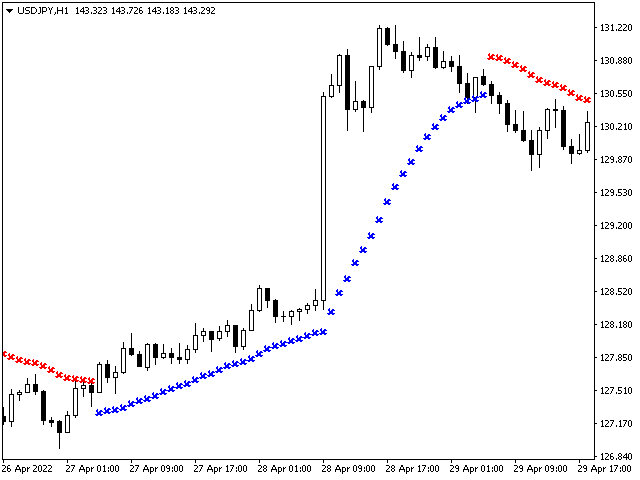
Recommendation Trend
- 지표
- 버전: 1.1
- 활성화: 5

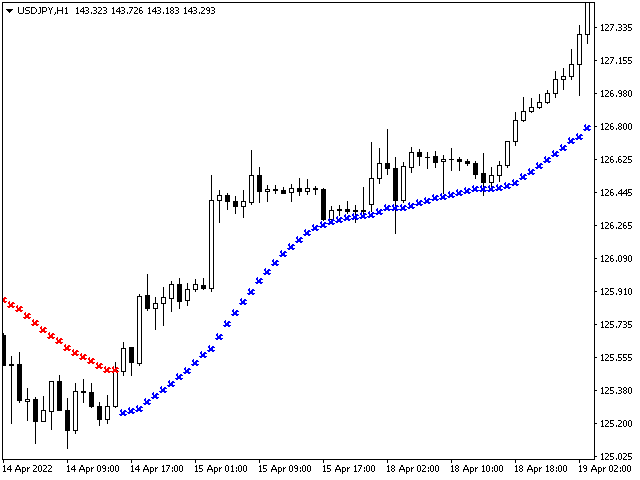
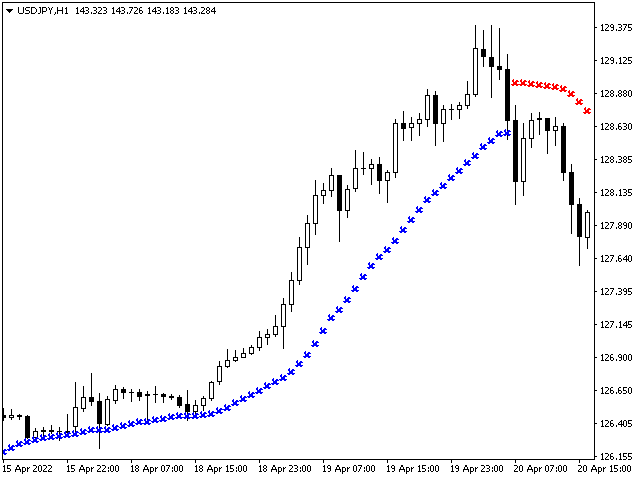
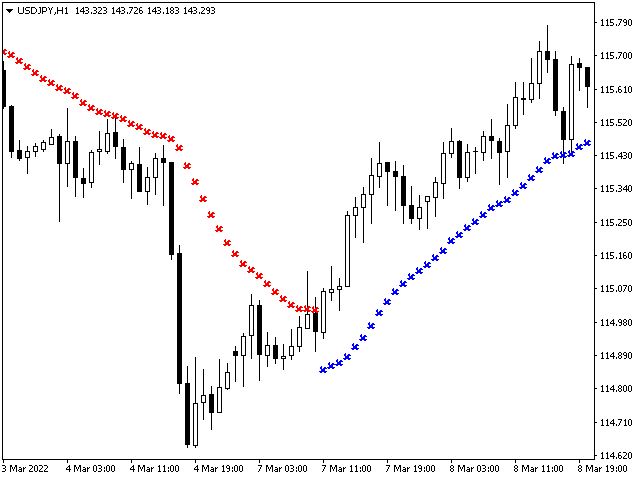
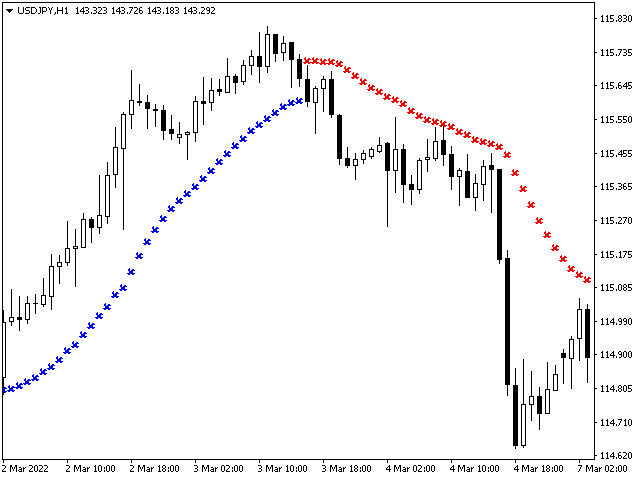
The Recommendation Trend indicator reflects price fluctuations, which already contain all the information about the market. For many traders, this postulate is a reasonable justification not to use fundamental analysis when working in the stock market, focusing only on what is happening on the chart, but using this indicator you will not regret the tips. The indicator shows favorable moments for entering the market. The intelligent algorithm of the indicator determines the trend, filters out market noise and generates entry signals. You can use the indicator as the main one to determine the trend. The indicator can work both for entry points and as a filter. The indicator reflects information in a visual form; it can be used both for pipsing on short periods and for long-term trading.