Heiken Ashi MultiTime
- 지표
- 버전: 2.1
- 업데이트됨: 10 7월 2021
- 활성화: 5

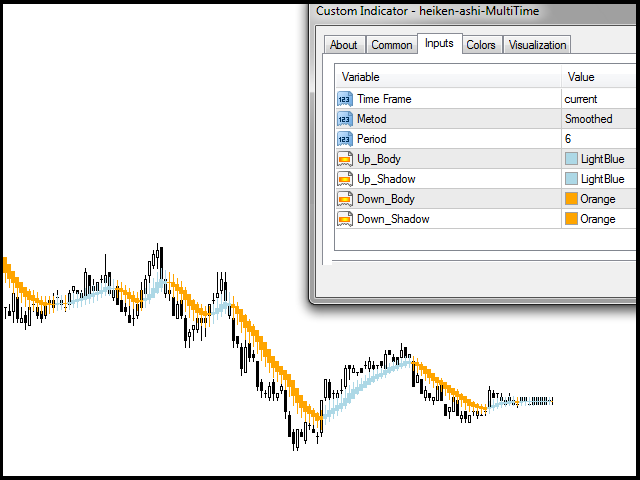
- In this indicator, Heiken Ashi candles are calculated with the most optimal method. You can also customize the results by adjusting the amount of period and method input.
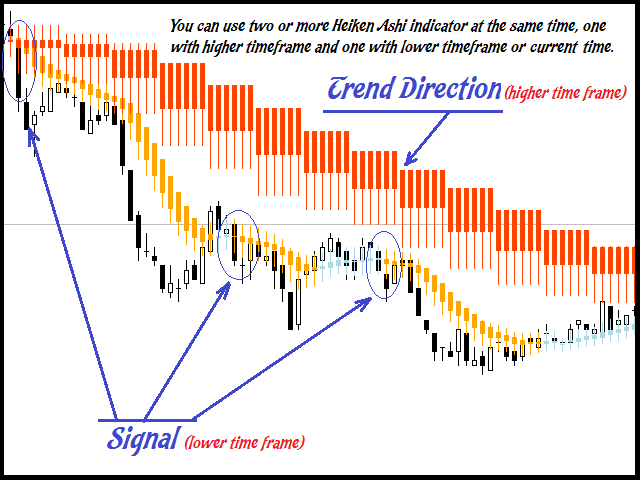
- But the most important advantage of this indicator is the adjustment of the time frame value. You can use this to calculate the Heiken Ashi chandels to See in time frames with lottery in the lower time chart. In this case, you get the best signal to buy or sell using two or more Heiken Ashi indicators with different timeframes.
- You can use the Heiken Ashi indicator with time frames with latter to detect the trend direction and the Heiken Ashi indicator with lower time frames to find the signal in the trend direction. The higher these signals are issued in areas closer to the Heiken Ashi indicator candles with a higher time frame, the more valid they are.
Benefits of the Heiken Ashi Multi Time indicator :
- Entry signals without repainting
If a signal appears and is confirmed, it does NOT disappear anymore, unlike indicators with repainting, which lead to major financial losses because they can show a signal and then remove it.
- Multi Time display
By setting the indicator time, you can see the inductor at a higher time in the current time. This feature is very useful for finding trend direction.
- Customization of computational method
Improve your results by determining Heiken Ashi calculation factors.
- perfect opening of trades
The indicator algorithms allow you to find the Peak and floor position to enter a deal (buy or sell an asset), which increases the success rate for each and every trader using it.
- Heiken Ashi Multi Time works with any asset
It allows you to trade cryptocurrencies, stocks, metals, indices, commodities, and currencies with any broker using the MT4 platform.
- Provides signals for any direction
The Heiken Ashi Multi Time indicator provides signals to enter a trade at any price movement - up, down, or flat (sideways).
- Any chart timeframes will do
The Heiken Ashi Multi Time indicator works on all timeframes - from minute (M1) to monthly (MN).
- Visual and sound alerts
You'll not miss another signals because each of them is displayed on the screen and comes with a sound notification.
- Minimal risks
Extra settings and filters makes it possible to filter out false signals, signals against the trend and other risky trades.