AIS Trade Channel Index MT4

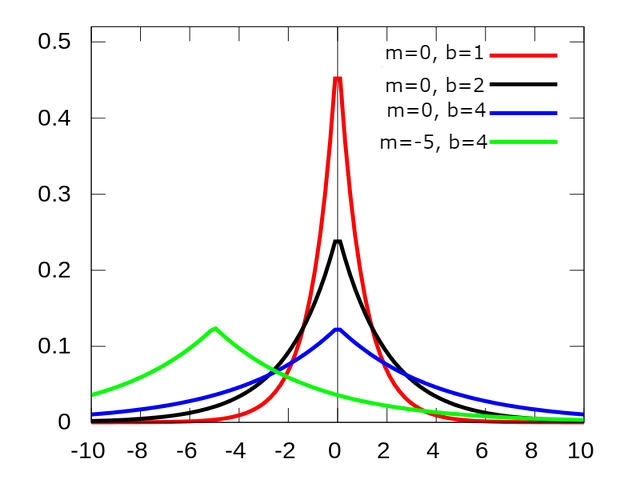
When analyzing financial time series, researchers most often make a preliminary assumption that prices are distributed according to the normal (Gaussian) law. This approach is due to the fact that a large number of real processes can be simulated using the normal distribution. Moreover, the calculation of the parameters of this distribution presents no great difficulties. However, when applied to financial markets, normal distribution does not always work. The returns on financial instruments often have a form that differs from normal. Too frequent and / or large emissions lead to the use of so-called "heavy tails" distributions. When constructing this indicator, we will assume that price levels are subject to the Laplace distribution. The main difference between this distribution is that it allows for a much wider range of values. Thanks to this, the Laplace distribution makes it possible to simulate price movements. In addition, the Laplace distribution is composite and therefore can be used in situations where low and high values ​​occur under different conditions. Distribution itself In appearance, it differs significantly from normal. And the shape and location of the graph depends on two parameters - b and m.

Level setting

The main advantage of the Laplace distribution is the large range of argument values. So, when using the normal distribution, the majority of the values ​​fall in the range from –3 to +3. And when using the Laplace distribution, the range expands to –5 ... + 5. Thus, it becomes possible to more accurately classify price changes and make more informed trading decisions. The approximate probability that the price will be within the specified limits is shown in the table.

Range Probability,% Subrange Probability,%
1…+1 
63,2 
0…1 
31,6 
2…+2 
86,5 
1…2 
11,6 
3…+3 
95,0 
2…3 
4,3 
4…+4 
98,2 
3…4 
1,6 
5…+5 
99,3 
4…5 
0,6 

In general, the probability that the indicator value will reach the z value can be calculated using the formula:

Probability = (1-exp⁡ (- | z |)) * 100% / 2

And the boundaries of the range that correspond to a given probability can be calculated as follows:

Level = ± ln⁡ (1-Probability / 100), 0≤Probability <100

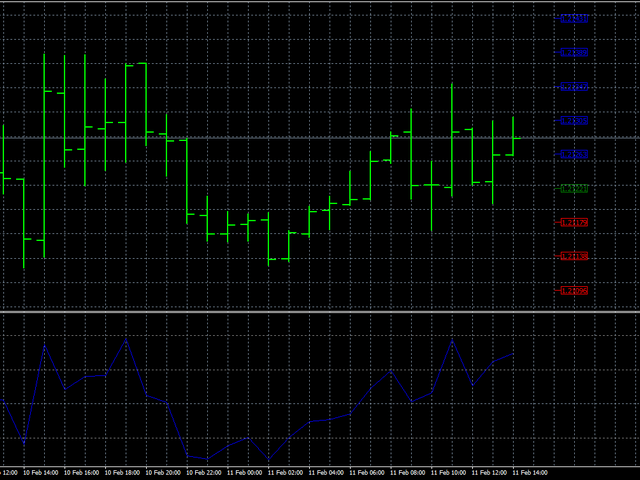
There are two types of levels that can be used for trading.

Type I
Type II
Probability Range Probability 
Range 
1/2 
±0.693 2/3 
±1.099
3/4 
±1.386 8/9 
±2.198
7/8 
±2.079 26/27 
±3.297
15/16 
±2.772 80/81 
±4.396
31/32 
±3.466 242/243 
±5.495

The first type of levels can be used as an additional filter as part of an existing trading strategy. The second type of levels can be used to make independent trading decisions.


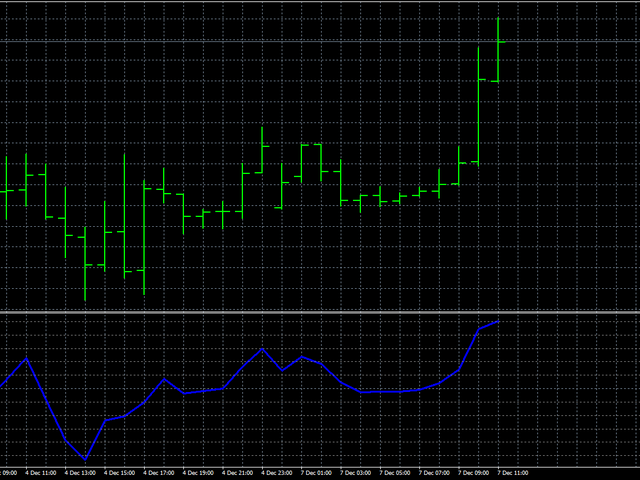
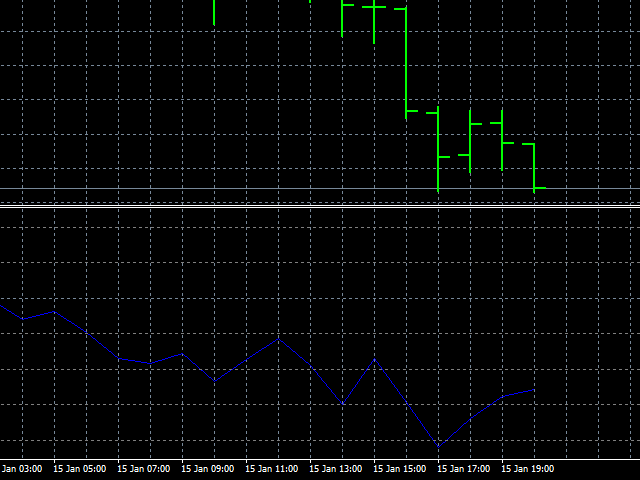
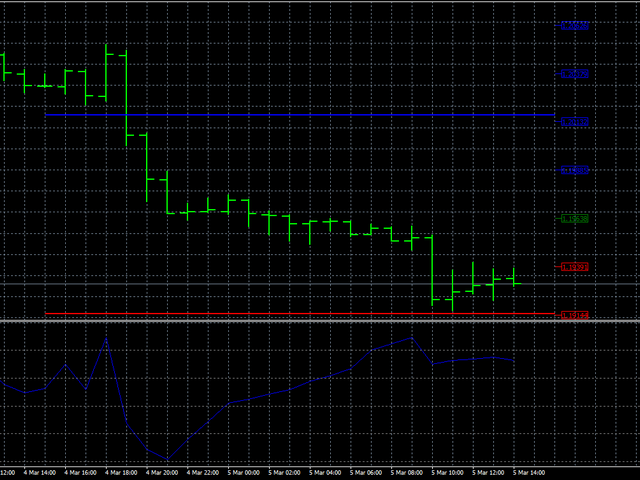
Interpreting Results

When using the indicator in trading, two basic rules apply:

  • opening a Buy position with a negative value;
  • opening a Sell position with a positive value.

It should be remembered that the further the indicator deviates from the zero line, the higher the probability of success.

Indicator setting

To configure the indicator, you need to set the values ​​of the levels (you can use both the recommended ones and calculate them yourself).

Considering the specifics of calculations, iPeriod should be higher than 5.

The choice of the price constant depends on the trading strategy.

추천 제품
ZuperSymbols Linker
Manuel Francisco Gaitan
El ZuperSymbols Link  es el indicador de sincronización táctica definitivo para scalpers que operan bajo l a estrategia de Triple Pantalla ( Triple Screen Trading System ) fue creada por el Dr. Alexander Elder . Su función es radical: tú cambias el instrumento en tu gráfico principal de 1 o 5 minutos y, con ese único clic , tus ventanas de temporalidad intermedia y mayor se sincronizan al instante. Sin esperas, sin errores, sin navegar por menús. La ventaja del Scalper: Flujo de Trabajo Totalmen
MT4용 Crypto_Forex 지표 "Trend Flat Pro Histogram", 리페인트 없음. - "Trend Flat Pro Histogram" 지표는 매우 민감하고 일반적인 이동 평균보다 훨씬 효율적입니다. - 현재 시장 상황(플랫, 상승 추세, 하락 추세)을 보여주도록 설계되었습니다. - 지표는 세 가지 색상으로 표시됩니다. 플랫 시장 상황은 노란색, 하락 추세는 빨간색, 상승 추세는 녹색입니다(색상은 설정에서 변경 가능). - 모바일 및 PC 알림 기능 제공. - 이 지표는 가격 변동, 스캘핑, 모멘텀 트레이딩 등 다른 거래 방식과 결합하면 유용합니다. - 지표에 정보 표시 기능이 있어, 지표가 연결된 외환 통화쌍의 현재 스프레드와 스왑을 표시합니다. - 계좌 잔액, 자본금, 증거금도 표시됩니다. - 차트의 어느 곳에서나 정보 표시를 찾을 수 있습니다. 여기를 클릭하여 고품질 트레이딩 로봇과 지표를 확인하세요! 이 제품은 MQL5 웹사이트에서만 제공되는 오리지널 제
Accumulation Basic
Thanh Quang Huynh
Accumulation/Distribution Technical Indicator is determined by the changes in price and volume. The volume acts as a weighting coefficient at the change of price – the higher the coefficient (the volume) is, the greater the contribution of the price change (for this period of time) will be in the value of the indicator. In fact, this indicator is a variant of the more commonly used indicator   On Balance Volume . They are both used to confirm price changes by means of measuring the respective vo
Bull Bear Easy MTF
Naththapach Thanakulchayanan
This indicator, Bull Bear Easy MTF, summarise the strength color graphic and percentage of power for both  Bull and Bear in current market emotion stage which will show you in multi time frames and sum of the total Bull and Bear power strength which is an important information for traders especially you can see all Bull and Bear power in visualized graphic easily, Hope it will be helpful tool for you for making a good decision in trading.
TrendTrade
Alexey Surkov
5 (2)
The Trend Trade indicator displays assumed turning points of the price on the chart in the direction of the trend after correction. It is based on data of the Prise Reversal oscillator with the period 6 and indicators which characterize strength and availability of the trend. When the value of Prise Reversal is in overbought or oversold area (area size is set by a user), and the current trend is confirmed, the Trend Trade indicator draws an arrow pointed to the further assumed price movement. I
Scorpion Scalper Pro
Mohamed Amine Talbi
In the age of speed, everyone wants to gets what he/she wants quickly. Trading is all about gaining money, and scalping is a way of doing it in a short time. The "Scorpion Scalper Pro" has been named on the scorpion because of its speed. The indicator serves to provide signals for the M15 timeframe. It also sends Alerts (window alert, email alert, push notification alert) whenever a buy/sell signal occurs, and the alerts are customizable (they can be turned ON or OFF). Indicator inputs : - Buy
This indicator draws Fibonacci level automatically from higher high to lower low or from lower low to higher high. With adjustable Fibonacci range and has an alert function. How to use Fibonacci Risk Reward Ration (R3) into trading strategy Forex traders use Fibonacci-R3 to pinpoint where to place orders for market entry, for taking profits and for stop-loss orders. Fibonacci levels are commonly used in forex trading to identify and trade off of support and resistance levels. Fibonacci retracem
거래 시간을 완벽하게 통제하고, 효율성을 극대화하세요. 데이 트레이딩에서 바(캔들)의 수를 정확하게 세는 것은 시간 소모적이고 오류가 발생하기 쉬운 일이었습니다. BarCounter가 이 문제를 해결해 드립니다. 이 스마트하고 가벼운 지표는 하루가 시작된 이후 생성된 모든 캔들을 자동으로 정확하게 계산하여, 세션 진행 상황을 완전히 확신하며 모니터링할 수 있게 해줍니다. 수동 계산의 번거로움을 자동화된 과정으로 바꾸고, 불확실성을 명확한 통찰력으로 전환해 줍니다. BarCounter는 엄격한 시간 관리가 필요한 모든 트레이더에게 필수적인 도구입니다. __________________________________________________________________________________________________________________________________________________________________________
Market Profile
Artem Titarenko
5 (1)
The "Market Profile" indicator displays the profiles and volumes of periods – weekly, daily, session (8-hour), 4-hour, hour, summary. The VAH/VAL price area is automatically highlighted by a dotted line for each profile (except for the summary). The indicator includes chroma Delta, which colors the profile areas. The areas of prevailing Buys is colored in green, that of Sells - in red. The intensity histogram features blue/red respectively. In the filter mode, the indicator displays the volume a
Alpha Trend sign has been a very popular trading tool in our company for a long time. It can verify our trading system and clearly indicate trading signals, and the signals will not drift. Main functions: Based on the market display of active areas, indicators can be used to intuitively determine whether the current market trend belongs to a trend market or a volatile market. And enter the market according to the indicator arrows, with green arrows indicating buy and red arrows indicating se
Smart Trend Pro - Intelligent Trend Navigation System (Buy One Get One Free Limited Offer) Ultimate Trend Solution: Get Complete Trading System for $69 Purchase Smart Trend Pro, immediately receive BreakoutIgnition Pro (value $69) for FREE! Two professional indicators originally priced at $138, now only $69! Why Choose Smart Trend Pro? Three Core Advantages Visual Trend Navigation - See market direction at a glance Intelligent Signal Filtering - Trade only high-probability opportunities All T
MR Volume POC Levels 4
Sergey Khramchenkov
5 (3)
The most important price level in any "Volume profile" is the "Point of Control" . This is the price level with the highest trading volume. It is primarily the level where large players initiate their positions, making it the accumulation/distribution level for the "Smart money" . The idea of the indicator arose after the "MR Volume Profile 4" indicator was made. When creating the "MR Volume Profile 4" indicator, we spent a lot of time comparing the volumes with those from the volume profile in
Check My Other Products Contact me to discover all my services  This indicator is very useful to have a better understanding of the current trend. With the integration of a trend color cloud it makes it easy to see the price trend immediately on the eye and this allows the trader to make more accurate assessments. I have been using this indicator for years and I must say that it greatly limits chart errors and trades against the trend
Flat Reminder
Chi Sum Poon
Flat Reminder Overview Flat Reminder is a powerful technical analysis tool that identifies and highlights price consolidation zones on your chart. It detects when price action slows down and moves sideways, indicating potential reversal points, continuation setups, or key decision zones in the market. Key Features Consolidation Detection : Automatically identifies flat price zones where market momentum decreases Range Measurement : Calculates and displays the exact range of each consolidation in
FREE
Spread and Close MT4
Alexander Denisovich Jegorov
Spread & Candle Close Timer Indicator for MT4  Optimize your trading with this lightweight and efficient indicator, designed to display the real-time spread and candle close countdown directly on your MT4 chart. Features: Live Spread Monitoring – Instantly see market conditions. Candle Close Timer – Stay prepared for the next price movement. Simple & Non-Intrusive Design – No unnecessary settings, just clear and accurate data. Ideal for scalpers, day traders, and those who need real-time exec
Entry Volume Zones mt4
Part-time Day Trader
Entry Volume Zones helps traders find better trade entry locations by highlighting recent volume-based support and resistance zones and key volume levels. The tool is designed mainly for planning trade entries, but it can also be used as a broader support and resistance indicator based on volume. Built for Traders Who Want To: Plan cleaner entries   from strong volume-based support and resistance zones. Improve reward-to-risk potential   by finding better entry locations, while keeping the ori
TrendMaster MT4
Giacomo Donati
How TrendMaster Works TrendMaster is a trading indicator designed to streamline and enhance your chart analysis. Using algorithmic logic, it reviews historical price data to generate a dynamic reference line. When price action crosses this line, a "BUY" or "SELL" signal is displayed on your chart. The goal is to assist in identifying potential shifts in price behavior with a clear and user-friendly visual approach. Why Use TrendMaster? The TrendMaster MT4 Indicator helps highlight potential tre
Closing Average
Yaroslav Varankin
Closing average This is a completely new indicator in technical analysis. It is based solely on mathematical calculation. about signals It’s worth going into a buy transaction when the price has crossed the indicator line from bottom to top and it is under the price it is worth entering a deal on sell when the price is below the indicator line This author’s development, he doesn’t use any indicators of technical analysis in his analysis.
Weis Wave Indicator
Dhabaleswar Prasad Jena
This indicator is based on the Weis wave principle of wave volume. Below are few features of the indicator It draws the wave on the chart while the accumulated volume per wave in a different window at the bottom of the chart You can configure the turning point move It displays the accumulated volume (in thousands, eg for 15000 volume it will show 15) at the end of each wave You can also configure to show number of candles in the wave along with the wave volume The indicator calculates the distin
Constantly checking multiple pair & charts during day and still missing trade opportunities ? Let Market scanner do this job and you just focus on analysing opportunities and making trading decisions. Specially developed for need of intraday & scalping Traders . Must have tools for active traders. Market scanner indicator constantly monitors all Pairs from your MT4 watchlist for 9 /20 /50 Moving Average crosses in 1HR ,4HR & Daily Chart along with Closing price of last candle and alerts you if
Trend Hunter Pro
Yaroslav Varankin
The indicator is designed for opening trades for a long period. he is set up to get as many points from each trade as possible. he uses the scalping method... you can trade on any currency pairs indicator is already  you can trade at any time of the day but the preferred time of trading during the European American session. currency pairs eur / jpy, eur / usd currency pairs with high volatility then the results are much better.
Smart Money Trap Detector 는 스윙 고점과 스윙 저점에서 유동성 함정을 식별합니다 . 가격이 핵심 수준을 돌파한 후 반전할 때 기관 투자자가 설정한 잠재적 불 트랩 또는 베어 트랩을 감지합니다 . 각 감지된 트랩은 꼬리 크기 , 반전 속도 , 거래량에 기반한 1~5 의 강도 점수를 받습니다 .   작동 원리 인디케이터는 설정 가능한 룩백 기간을 사용하여 스윙 고저점을 추적합니다 . 가격이 스윙 고점 또는 저점을 돌파하면 , 설정된 확인 캔들 수 내에 가격이 수준을 다시 통과하여 반전하는지 모니터링합니다 . 돌파 꼬리가 최소 ATR 비율 임계값을 충족하고 가격이 범위 내로 되돌아 마감하면 트랩이 확인됩니다 . 모든 신호는 리페인팅을 방지하기 위해 확인된 종가 바에 배치됩니다 .   시각적 기능 차트의 화살표가 확인된 불 트랩 ( 위쪽 화살표 ) 과 베어 트랩 ( 아래쪽 화살표 ) 을 표시 . 유동성 영역이 스윙 포인트 주변에 색상 사각형으로 그려짐 . 텍스트 레이블
Chart Local Time
Rider Capital Group
4.86 (14)
Display your Local Time on your charts Display your local time   instead of (or along with) MT4 server time. Display crosshair   which highlights current candle time. Automatically adjusts based on chart zoom (zooming in or out). Displays on every timeframe (M1 – Month), and auto-adjusts as chart timeframe is changed. Handles special ½ hour time zones , such as India.  Renders   fast   (no lag) as you scroll charts. Customize the font family, font size, background color, and crosshair col
SuperRSI
Andriy Sydoruk
The SuperRSI indicator is an advanced index of internal strength. The indicator shows not the relative strength of the trading instruments being compared, but the internal strength of a single instrument, therefore, it is the “Internal Strength Index”. This is an advanced form of the SuperRSI indicator. It converts the signal so that low-frequency components are delayed much more than high-frequency components. In general, the data of the last bar have more weight than previous data, like an exp
The indicator determines the state of the market: trend or flat. The state of the market is determined by taking into account volatility. The flat (trading corridor)is displayed in yellow. The green color shows the upward trend. The red color shows the downward trend. The height of the label corresponds to the volatility in the market. The indicator does not redraw . Settings History_Size   - the amount of history for calculation. Period_Candles  - the number of candles to calculate the indicat
FusionAlert StochRSI Master is an indicator available for MT4/MT5 platforms, it is a combination of RSI & Stochastic indicator which provide "alerts" when the market is inside "overbought and oversold" regions combined for both indicators, results in more precise and accurate signals to be used as a wonderful tool, in the form of "buy or sell" signals. This indicator comes with many customization options mentioned in the parameter section below, user can customise these parameters as needful. Jo
FREE
The indicator allows you to trade binary options. The recommended time frame is М1 and the expiration time is 1,2,3 minutes. The indicator suitable for auto and manual trading. A possible signal is specified as a arrows above/under a candle. You should wait until the candle closes! Arrows are not re-painted Trade sessions: TOKYO section (Half-end) Currency pairs: USD/JPY Working time frame: M1 Expiration time: 1,2,3 minutes. The indicator also shows good results when using the martingale strateg
FREE
VWAP Trend Dashboard MT4
Frank Jose Olivo Flores
# VWAP Trend Dashboard  --- ## What It Does Displays a compact dashboard on any MT5 chart showing the **VWAP-based bias** for up to **5 symbols simultaneously**. For each symbol it checks the current price against four VWAP levels and summarises the overall directional bias in a single Trend column. --- ## Dashboard Columns | Column | What It Means | |---|---| | **Symbol** | Your custom display label | | **NY VWAP** | VWAP anchored at NY session open today | | **Day VWAP** | VWAP anchored
Rira Renko
Vitor Palmeira Abbehusen
RENKO on Time Chart This indicator is an enhanced Renko, so you can watch the Renko bricks on the chart to understand price movement more clearly the other improvement is automated box size according to ATR (Average True Range) period you can set the ATR number as you want and the box size of Renko changes automatically based on price movement Inputs Mode: Box size is the input to specify the size of the Renko box you want to print on the chart. This input lets you choose the fixed box siz
This indicator allows you to determine the likelihood that the price will reach one or another level. Its algorithm is quite simple and is based on the use of statistical data on the price levels of a particular currency pair. Thanks to the collected historical data, it is possible to determine the extent to which the price will change during the current bar. Despite its simplicity, this indicator can provide invaluable assistance in trading. So, with its help it is possible to determine TakePr
이 제품의 구매자들이 또한 구매함
Neuro Poseidon MT4
Daria Rezueva
4.95 (38)
Neuro Poseidon is a new indicator by Daria Rezueva. It combines precise trading signals with adaptive TP/SL levels - creating best possible trades as a result! Message me and get  Neuro Poseidon Assistant  as a gift to automize your trading process! What makes it stand out? 1. Proven profitability on all assets and timeframes 2. Only confirmed BUY and SELL signals present on the chart 3. Adaptive TP & SL levels generated by the software for each trade 4. Easy to understand - suitable for all
Miraculous Indicator – Gann Square of Nine 기반 100% 비리페인트 Forex 및 바이너리 도구 이 영상은 Miraculous Indicator 를 소개합니다. 이 지표는 Forex 및 바이너리 옵션 트레이더를 위해 특별히 개발된 매우 정확하고 강력한 트레이딩 도구입니다. 이 지표가 독특한 이유는 전설적인 **Gann Square of Nine(Gann 9의 사각형)**과 **Gann's Law of Vibration(Gann 진동의 법칙)**에 기반을 두고 있기 때문입니다. 이는 현대 트레이딩에서 가장 정밀한 예측 도구 중 하나로 손꼽힙니다. Miraculous Indicator는 완전히 비리페인트(non-repaint) 됩니다. 즉, 캔들이 마감된 후에도 신호가 변경되거나 사라지지 않습니다. 보이는 것이 곧 결과입니다. 이는 트레이더가 자신감을 가지고 거래에 진입하고 청산할 수 있는 신뢰할 수 있고 일관된 기반을 제공합니다. 주요 특징: Gann
Trend Catcher ind
Ramil Minniakhmetov
5 (7)
트렌드 캐처 인디케이터 트렌드 캐처 인디케이터는 개발자가 자체 개발한 맞춤형 적응형 트렌드 분석 지표들을 조합하여 시장 가격 움직임을 분석합니다. 단기적인 노이즈를 제거하고 근본적인 모멘텀 강도, 변동성 확대, 가격 구조 움직임에 집중하여 진정한 시장 방향을 파악합니다. 또한 이동 평균, RSI, 변동성 필터와 같은 맞춤형 지표들을 활용하여 가격을 평활화하고 트렌드를 필터링합니다. 실제 운영 모니터링 및 기타 제품은 다음 링크에서 확인하실 수 있습니다: https://www.mql5.com/en/users/mechanic/seller 텔레그램에서는 EA나 설정 파일을 판매하지 않습니다. 사기이니 주의하세요. 모든 설정 파일은 블로그에서 무료로 제공됩니다. 중요! 구매 후 즉시 연락 주시면 사용 방법 및 보너스를 드립니다!
Gann Made Easy
Oleg Rodin
4.84 (165)
Gann Made Easy 는 mr.의 이론을 사용하여 최고의 거래 원칙을 기반으로 하는 전문적이고 사용하기 쉬운 Forex 거래 시스템입니다. W.D. 간. 이 표시기는 Stop Loss 및 Take Profit Levels를 포함하여 정확한 BUY 및 SELL 신호를 제공합니다. PUSH 알림을 사용하여 이동 중에도 거래할 수 있습니다. 구매 후 거래 방법 안내 및 유용한 추가 지표를 무료로 받으시려면 저에게 연락주세요! 아마도 Gann 거래 방법에 대해 이미 여러 번 들었을 것입니다. 일반적으로 Gann의 이론은 초보자 거래자뿐만 아니라 이미 거래 경험이 있는 사람들에게도 매우 복잡한 것입니다. Gann의 거래 방식은 이론적으로 적용하기 쉽지 않기 때문입니다. 나는 그 지식을 연마하고 Forex 지표에 최고의 원칙을 적용하기 위해 몇 년을 보냈습니다. 표시기는 적용하기가 매우 쉽습니다. 차트에 첨부하고 간단한 거래 권장 사항을 따르기만 하면 됩니다. 지표는 지속적으로 시장 분석
Prop Firm Sniper
Mohamed Hassan
Prop Firm Sniper MT4  is a professional market structure indicator that automatically identifies high-probability BUY and SELL opportunities using BOS and CHoCH analysis. Recommended Timeframes: For backtesting, use the indicator on   M5 or M15   for Gold (XAUUSD), and   M15 or H1   for more volatile Forex pairs such as   GBPUSD, USDJPY, EURGBP , and similar markets. CONTACT ME AFTER PURCHASE TO CLAIM YOUR FREE BONUSES! Prop Firm Sniper  is a professional market structure indicator designed t
M1 Sniper
Oleg Rodin
5 (24)
M1 SNIPER 는 사용하기 쉬운 거래 지표 시스템입니다. M1 시간대에 맞춰 설계된 화살표 지표입니다. 이 지표는 M1 시간대 스캘핑을 위한 단독 시스템으로 사용할 수 있으며, 기존 거래 시스템의 일부로도 사용할 수 있습니다. 이 거래 시스템은 M1 시간대 거래용으로 특별히 설계되었지만, 다른 시간대에도 사용할 수 있습니다. 원래는 XAUUSD와 BTCUSD 거래를 위해 이 방법을 설계했지만, 다른 시장 거래에도 유용하다는 것을 알게 되었습니다. 이 지표의 신호는 추세 방향과 반대로 거래될 수 있습니다. 저는 지표의 신호를 활용하여 양방향으로 거래할 수 있도록 돕는 특별한 거래 기법을 알려드립니다. 이 방법은 특별한 동적 지지선과 저항선 가격 영역을 활용하는 것을 기반으로 합니다. 구매하시면 M1 SNIPER 화살표 지표를 바로 다운로드하실 수 있습니다. 또한, 아래 스크린샷에 표시된 Apollo Dynamic SR 지표는 M1 SNIPER 도구를 사용하는 모든 사용자에게 무료로
Dynamic Forex28 Navigator
Bernhard Schweigert
4.43 (7)
Dynamic Forex28 Navigator - 차세대 외환 거래 도구. 현재 49% 할인. Dynamic Forex28 Navigator는 오랫동안 인기 있는 지표의 진화형으로, 세 가지의 힘을 하나로 결합했습니다. 고급 통화 Strength28 지표(695개 리뷰) + 고급 통화 IMPULSE with ALERT(520개 리뷰) + CS28 콤보 신호(보너스). 지표에 대한 자세한 정보 https://www.mql5.com/en/blogs/post/758844 차세대 Strength 지표는 무엇을 제공합니까?  원래 지표에서 좋아했던 모든 것이 새로운 기능과 더 높은 정확도로 강화되었습니다. 주요 기능: 독점적인 통화 Strength 공식.  모든 시간대에 걸쳐 부드럽고 정확한 강도선. 추세와 정확한 진입을 식별하는 데 이상적입니다. 역동적인 시장 피보나치 수준(시장 피보나치).  이 지표에만 있는 고유한 기능. 가격 차트가 아닌 통화 강도에 피보나치가 적용됩니다.
RelicusRoad Pro
Relicus LLC
4.65 (107)
RelicusRoad Pro: 퀀트 시장 운영 체제 70% 할인 평생 이용권 (한정 시간) - 2,000명 이상의 트레이더와 함께하세요 왜 대부분의 트레이더는 "완벽한" 지표를 가지고도 실패할까요? 진공 상태에서 단일 개념 만으로 거래하기 때문입니다. 문맥 없는 신호는 도박입니다. 지속적인 승리를 위해서는 컨플루언스(중첩) 가 필요합니다. RelicusRoad Pro는 단순한 화살표 지표가 아닙니다. 완전한 퀀트 시장 생태계 입니다. 독점적인 변동성 모델링을 사용하여 가격이 이동하는 "공정 가치 로드"를 매핑하고, 단순 노이즈와 실제 구조적 돌파를 구분합니다. 추측은 그만두세요. 기관급 로드 로직으로 거래를 시작하세요. 핵심 엔진: "Road" 알고리즘 시스템의 중심에는 시장 상황에 실시간으로 적응하는 동적 변동성 채널인 Road Algo 가 있습니다. 세이프 라인(평형) 과 가격이 수학적으로 반전될 가능성이 높은 확장 레벨 을 투영합니다. Simple Road: 일반적인 시장을 위
Scalper Inside PRO
Alexey Minkov
4.68 (69)
Scalper Inside PRO Scalper Inside PRO is an intraday trend and scalping indicator that uses exclusive built-in algorithms to evaluate market direction and key target levels. The indicator automatically calculates entry and exit points and several profit target levels, and it shows detailed performance statistics, so you can see how different instruments and strategies behaved on historical data. This helps you select instruments that fit current market conditions. You can also connect your own a
MetaBands M4
Vahidreza Heidar Gholami
3.5 (6)
MetaBands uses powerful and unique algorithms to draw channels and detect trends so that it can provide traders with potential points for entering and exiting trades. It’s a channel indicator plus a powerful trend indicator. It includes different types of channels which can be merged to create new channels simply by using the input parameters. MetaBands uses all types of alerts to notify users about market events. Features Supports most of the channel algorithms Powerful trend detection algorith
Genesis Matrix Pro is a professional multi-timeframe trend detection indicator designed to help traders identify high-quality market alignment with clarity and structure. It combines 12 different technical indicators into one visual alignment matrix, allowing traders to quickly see when market conditions are bullish, bearish, or neutral. A signal is generated only when the selected strategies are aligned, helping reduce noise and improve decision-making. PLEASE CONTACT ME AFTER PURCHASE TO GET
이 제품은 2026년 시장에 맞게 업데이트되었으며 최신 MT5 빌드에 최적화되었습니다. 가격 업데이트 안내: Smart Trend Trading System은 현재 $99 에 제공됩니다. 다음 30회 구매 후 가격은 $199 로 인상됩니다. 특별 혜택: Smart Trend Trading System 구매 후 저에게 개인 메시지를 보내시면 Smart Universal EA를 무료 로 받을 수 있으며, Smart Trend 신호를 자동 거래로 전환할 수 있습니다. Smart Trend Trading System은 리페인트 없음, 재그리기 없음, 지연 없음의 완전한 트레이딩 시스템으로, 더 깨끗한 신호, 더 나은 추세 방향, 그리고 더 체계적인 시장 거래 방식을 원하는 트레이더를 위해 제작되었습니다. Online course , manual and download presets . 이 시스템은 추세 감지, 반전 구간, Smart Cloud, 트레일링 스톱 로직, 지지와 저항, 캔들 색
BTMM State Engine Pro MT4
Garry James Goodchild
BTMM State Engine Pro is a MetaTrader 4 indicator for traders who use the Beat The Market Maker approach: Asian session context, kill zone timing, level progression, peak formation detection, and a multi-pair scanner from a single chart. It combines cycle state logic with a built-in scanner dashboard so you do not need the same tool on many charts at once. What it does Draws the Asian session range; session times can follow broker server offset or be set in inputs. Tracks level progression (L
Advanced Supply Demand
Bernhard Schweigert
4.91 (300)
현재 30% 할인! 초보자나 전문 트레이더를 위한 최고의 솔루션! 이 보조지표는 우리가 다수의 독창적 기능과 새로운 공식을 통합한 독특하고 고품질이며 저렴한 거래 도구입니다. 이 업데이트를 통해 이중 시간대를 표시할 수 있습니다. 더 높은 TF를 표시할 수 있을 뿐만 아니라 차트 TF와 더 높은 TF 모두를 표시할 수 있습니다: 중첩 영역 표시. 모든 Supply Demand 트레이더들이 좋아할 것입니다. :) 중요한 정보 공개 Advanced Supply Demand의 잠재력을 극대화하려면 다음을 방문하십시오. https://www.mql5.com/ko/blogs/post/720245   진입 또는 목표의 명확한 트리거 포인트를 정확히 찾아냄으로 해서 거래가 어떻게 개선될지 상상해 보십시오. 새로운 알고리즘을 기반으로 매수자와 매도자 간의 잠재적인 불균형을 훨씬 더 쉽게 분간할 수 있습니다. 왜냐하면 가장 강한 공급영역과 가장 강한 수요 영역과 과거에 어떻게 진행 되었는지를(이전
간 스퀘어 지표는 W.D. 간이 쓴 "시장 예측을 위한 수학적 공식" 기사에 기반한 강력한 시장 분석 도구입니다. 이 도구는 수학적 개념과 간 이론을 사용하여 정확한 시장 분석을 수행합니다. 144, 90, 52의 제곱과 9의 제곱을 사용합니다. 또한 의 9의 제곱근 및 해당 제곱의 채널 및 스타 패턴과의 관련성을 통합합니다. 사용자 메뉴얼 및 적용: 이 지표를 사용하기 전에 사용자 메뉴얼을 읽고 질문이 있을 경우 문의하시기 바랍니다. 전체 메뉴얼은 웹사이트에서 제공됩니다. MT5의 전체 버전을 구매하거나 MT4의 무료 버전을 테스트할 수 있습니다. 두 버전 모두 링크에서 확인하실 수 있습니다. 주요 기능 및 기능: 간 스퀘어 지표는 정확한 결정을 위해 기하학적 개념과 간 이론을 활용하는 시장 분석을 위한 포괄적인 도구 집합을 제공합니다. 주요 기능은 다음과 같습니다. 9의 제곱 분석: 이 지표는 9의 제곱에 대한 수평 선, 스타 패턴, 그리드 및 간 팬을 그릴 수 있습니다. 간 이
Neo Wave PRO
Nikolay Raykov
5 (1)
Price & Time Market Structure Indicator A professional market structure tool that analyzes waves through both price and time — not price alone. Main Description NeoWave PRO is a professional market structure indicator for MetaTrader 4 designed for traders who want to move beyond traditional one-dimensional wave tools such as ZigZag, swing indicators, and basic high/low systems. Most wave indicators analyze only one thing: Price. But a real market wave is not only a price movement. A true wave de
Enigma scalper fx
Yonny Pascal Ekwa Mezui
Enigma Scalper  Overview Enigma Scalper Pro is a multi-filter breakout indicator designed for traders who want clean entry signals with confirmation from several technical conditions instead of relying on a single trigger. The indicator combines: 3-Bar Breakout pattern detection Higher Timeframe confluence Bollinger Band extreme filtering RSI momentum analysis Optional EMA trend filtering ATR-based SL/TP projection Signals are generated only after candle close to ensure stable non-repainting beh
PRO Renko System
Oleg Rodin
5 (30)
PRO Renko System 은 RENKO 차트 거래를 위해 특별히 고안된 매우 정확한 거래 시스템입니다. 이것은 다양한 거래 상품에 적용될 수있는 보편적 인 시스템입니다. 체계는 효과적으로 당신에게 정확한 반전 신호에 접근을 주는 소위 시장 소음을 중화합니다. 이 표시기는 사용하기가 매우 쉽고 신호 생성을 담당하는 매개 변수가 하나만 있습니다. 당신은 쉽게 당신의 선택의 어떤 무역 계기에 공구를 적응시킬 수 있고 renko 막대기의 크기. 나는 항상 당신이 내 소프트웨어로 수익성있게 거래 할 수 있도록 추가 지원을 제공 할 준비가되어 있습니다! 나는 당신에게 행복하고 수익성있는 거래를 기원합니다! 구매 후 저에게 연락하십시오! 내 렌코 차트 생성기를 보내드립니다. 또한 내 개인 권장 사항 및 시스템의 다른 모듈을 무료로 공유 할 것입니다!
Scalper Vault
Oleg Rodin
5 (37)
Scalper Vault 는 성공적인 스캘핑에 필요한 모든 것을 제공하는 전문 스캘핑 시스템입니다. 이 표시기는 외환 및 바이너리 옵션 거래자가 사용할 수 있는 완전한 거래 시스템입니다. 권장 시간 프레임은 M5입니다. 시스템은 추세 방향으로 정확한 화살표 신호를 제공합니다. 또한 상단 및 하단 신호와 Gann 시장 수준을 제공합니다.  이 시스템은 사용하기가 매우 쉽습니다. 원하는 시장 지역의 화살표만 따라가면 됩니다. 엑시트는 가격이 적정 수준에 도달하거나 시장의 고점 또는 저점 신호가 나타날 때 수행됩니다.  표시기는 PUSH 알림을 포함한 모든 유형의 경고를 제공합니다. 인디케이터 구매 후 연락주세요. 내 개인 거래 권장 사항과 훌륭한 보너스 지표를 무료로 공유합니다! 나는 당신에게 행복하고 유익한 거래를 기원합니다!
CRT Candle Range Theory HTF MT4.   Ultimate CRT Indicator: Advanced ICT Concepts and Malaysian SnR Trading System Discounted   Price   $50  !!     Secure your lifetime access   now   before it switches to   subscription-only ! Master the Market Maker's Footprints with the Most Advanced Candle Range Theory Indicator Unlock the true power of   Smart Money Concepts (SMC)   and trade precisely like the institutions with the   Ultimate CRT Indicator . Built exclusively for serious traders, this indic
Pinpoint 는 금에 대한 정확한 구매 및 판매 신호를 위해 설계된 다시 그리기 및 지연없이 매우 효율적인 거래 지표입니다. 표시기는 빠르게 변화하는 시장에서 실시간으로,빠르고 정확하고 시각적 인 솔루션을 원하는 상인을 위해 설계되었습니다. 이 지표는 기성품 거래 전략으로 작동합니다. 그것은 내장 된 알고리즘에 따라 자산의 가격의 동작을 분석하고 이상적인 진입 점을 결정뿐만 아니라,이익을 잠글 위치를 보여줍니다. 잠재적 인 변화를보다 정확하게 식별하기 위해 표시기에는 현재 시장 상황에 따라 동적으로 조정되는 지능형 추세선 도구가 내장되어 있습니다. 라인의 표준 설정에 따라: 녹색-구매 이니셔티브. 빨간색은 판매 이니셔티브입니다. 오렌지-이전 이니셔티브를 가로 챌 수 있습니다. Pinpoint mt5 Pinpoint Blog Pinpoint 에는 잘못된 신호를 줄이고 입력 품질을 향상시키는 데 도움이되는 다양한 필터가 포함되어 있습니다. 기본 구성은 5 년 동안 15,30
The indicator scans for Dinapoli thrust pattern in multiple timeframes for the all markets filtered and shows the results on Dashboard. Key Features Dashboard can be used for all markets It can scan for thrust pattern on MN1, W1, D1, H4, H1, M30, M15 ,M5, M1 timeframes Ability to choose number of bars required above/below displaced moving average to define thrust Parameters UseMarketWatch: Set true to copy all symbols available in market watch MarketWatchCount : Set the number of symbols that
Advanced Currency Strength28 Indicator
Bernhard Schweigert
4.91 (657)
현재 40% 할인 초보자 또는 전문가 트레이더를 위한 최고의 솔루션! 이 지표는 우리가 독점 기능과 새로운 공식을 통합했기 때문에 독특하고 고품질이며 저렴한 거래 도구입니다. 단 하나의 차트로 28 Forex 쌍의 통화 강도를 읽을 수 있습니다! 새로운 추세 또는 스캘핑 기회의 정확한 트리거 포인트를 정확히 찾아낼 수 있기 때문에 거래가 어떻게 개선될지 상상해 보십시오. 사용 설명서: 여기를 클릭  https://www.mql5.com/en/blogs/post/697384 그것이 첫 번째, 원본입니다! 쓸모없는 지망생 클론을 사지 마십시오. 더 스페셜  강력한 통화 모멘텀을 보여주는 하위 창의 화살표 GAP가 거래를 안내합니다! 기본 또는 호가 통화가 과매도/과매도 영역(외부 시장 피보나치 수준)에 있을 때 개별 차트의 기본 창에 경고 표시가 나타납니다. 통화 강도가 외부 범위에서 떨어질 때 풀백/반전 경고. 교차 패턴의 특별 경고 추세를 빠르게 볼 수 있는 다중 시간
Reversion King MT4
Eugen-alexandru Zibileanu
새로운 시장의 왕이 등장했습니다 – 인디케이터 + 주문 관리 시스템(TP1 + TP2 + TP3) (완전한 트레이딩 시스템) 이 인디케이터는 고급 매매 전략, 사용자 지정이 가능한 주문 관리 시스템, 그리고 Envelopes 확장 기법을 활용한 평균회귀(Mean Reversion) 시스템을 결합한 완전한 트레이딩 솔루션입니다. 또한 RSI를 비롯한 다양한 지능형 확인 필터를 통해 높은 확률의 반전 구간을 포착하며, 명확한 BUY(매수) 및 SELL(매도) 신호를 제공합니다. 이 인디케이터는 리페인트(Repaint)를 하지 않습니다. 단순히 매매 타이밍을 찾는 방법뿐만 아니라, 여러 포지션을 효과적으로 관리하고 이미 수익 중인 포지션을 활용하여 손실 거래를 상쇄하는 실전 자금 관리 기법까지 배울 수 있습니다. M5(5분 차트)에 맞춰 개발 및 최적화되었으며, 거의 모든 통화쌍과 거래 상품에서 우수한 성능을 발휘합니다. 또한 백테스트를 지원하여 다양한 시장 환경에서 시스템의 성과를 검증
이 지표는 실제 거래에 완벽한 자동 파동 분석 지표입니다! 사례... 참고:   웨이브 그레이딩에 서양식 이름을 사용하는 데 익숙하지 않습니다. Tang Lun(Tang Zhong Shuo Zen)의 명명 규칙의 영향으로 기본 웨이브를   펜   으로 명명하고 2차 웨이브 밴드를   세그먼트   로 명명했습니다. 동시에, 세그먼트에는 추세 방향이 있습니다.   주요 추세 세그먼트에는   이름이 지정되지만(이 이름 지정 방법은 향후 노트에서 사용됩니다. 먼저 말씀드리겠습니다.) 알고리즘은 굴곡 이론과 거의 관련이 없으므로 그렇게 해서는 안 됩니다. 이는 나의 시장 분석을   통해 요약된 끊임없이 변화하고 복잡한 운영 규칙을   반영합니다. 밴드는 더 이상 사람마다 다르지 않도록 표준화되고 정의되었습니다. 인위적인 간섭의 드로잉 방법은 시장 진입을 엄격하게 분석하는 데 핵심적인 역할을 합니다. 이 지표를 사용하는 것은 거래 인터페이스의 미학을 개선하고 원래의 K-line 거래를
Harmonic Pattern Plus MT4
Young Ho Seo
4.44 (18)
Introduction Harmonic Patterns are best used to predict potential turning point. Traditionally, Harmonic Pattern was identified manually connecting peaks and troughs points in the chart. Manual harmonic pattern detection is painfully tedious and not suitable for everyone. You are often exposed under subjective pattern identification with manual pattern detection. To avoid these limitations, Harmonic Pattern Plus was designed to automate your harmonic pattern detection process. The functionality
Swing Scanner
Reza Aghajanpour
4.65 (23)
** All Symbols x All Time frames scan just by pressing scanner button ** Discount: The price is $70$, But now it is just $39, Limited time offer is active. *** Contact me  to send you instruction and add you in "Swing scanner group" for sharing or seeing experiences with other users. Swing EA:  https://www.mql5.com/en/market/product/124747 Introduction: Swing Scanner is the indicator designed to detect swings in the direction of the trend and possible reversal swings. The indicator studies sev
KT Alpha Hunter Arrows MT4
KEENBASE SOFTWARE SOLUTIONS
대부분의 화살표 지표는 신호만 보여주고, 나머지 판단은 모두 트레이더에게 맡깁니다. KT Alpha Hunter Arrows는 완성된 트레이딩 플랜을 함께 제공합니다. 각 신호 화살표가 표시될 때마다 차트에는 진입 라인, 손절선, 네 개의 익절 목표, 그리고 현재 종목과 시간대가 지금 거래할 만한 가치가 있는지 알려주는 실시간 엣지 판정이 함께 그려집니다. 포함된 Trade Manager EA는 사용자가 수동으로 진입한 이후의 실행 관리를 맡아, 시장이 흔들리고 감정이 개입되기 쉬운 순간에도 거래 원칙을 유지할 수 있도록 돕습니다. 리페인트 없음. 확정된 캔들 기준 신호만 표시. Forex, 골드, 지수, 그리고 사용자가 거래하는 모든 상품을 위해 설계되었습니다. 주요 기능 캔들이 마감된 후에만 표시되는 비리페인트 매수 및 매도 화살표. 각 신호마다 진입 라인, 구조적 손절선, 네 개의 익절 목표 제공. Edge Dashboard가 현재 차트의 매수와 매도 셋업을 별도로 평가. 판
Break Axis Signal
Leandro Bernardez Camero
BreakAxis — 전환점에서의 정밀 신호 최신 업데이트를 놓치지 않으려면 채널에 가입하세요: https://www.mql5.com/en/channels/forexnewadvisor 축 교차 기반 신호 로직 BreakAxis Signal은 0축 교차를 기반으로 방향 전환을 감지하도록 설계되었습니다. 히스토그램 변화는 시장 모멘텀의 전환 가능성을 강조하며, 방향 화살표를 통해 시각적으로 확인됩니다. 신호 확인 및 안정성 각 신호는 특정 수학적 조건이 충족된 후 생성되며, 리페인팅 없이 과거 데이터의 무결성을 유지합니다. 매수 및 매도 신호는 최근 고점과 저점을 기준으로 계산된 평활화된 값의 동적 전환에 따라 개별적으로 표시됩니다. 시각적 요소 및 알림 방향 전환은 차트에서 시각적으로 확인되며, 실시간 모니터링을 위한 알림 기능도 선택적으로 활성화할 수 있습니다. 이 알고리즘은 일반적인 지표에 의존하지 않고 가격 움직임만을 기반으로 작동하는 깔끔한 탐지 로직을 제공합니다
PZ ABCD Retracement
PZ TRADING SLU
4 (5)
Identify precise entry and exit points with AB=CD patterns This indicator finds AB=CD retracement patterns. The AB=CD Retracement pattern is a 4-point price structure where the initial price segment is partially retraced and followed by an equidistant move from the completion of the pullback, and is the basic foundation for all harmonic patterns. [ Installation Guide | Update Guide | Troubleshooting | FAQ | All Products   ] Customizable pattern sizes Customizable AC and BD ratios Customizable b
제작자의 제품 더 보기
This script allows selecting the TakeProfit and StopLoss levels. It analyzes the history data, and then calculates the probability of reaching a given price level. How the script works Suppose you have a trading strategy and you want to select the TakeProfit and StopLoss levels. Run the script and set the parameter: Number of Bars - the average position holding time in bars. Once the script operation is complete, the AIS-PPL.csv file will be created in the Files folder in the terminal data cata
FREE
The script is based on the simulation of trade transactions using a random number generator. This allows you to get completely different results, even with the same input parameters. When you run the script, a dialog box opens in which you can set the desired values ​​for external variables. In the  Trading options  block, the basic parameters that are necessary for trading modeling are defined. Start Balance  - sets the initial size of the trade balance. Number Trade  - sets the number of trad
FREE
Choosing the levels of StopLoss and TakeProfit can have a very strong impact on the overall performance of trading. In addition to the obvious parameters of a trade transaction - the size of a possible win or probable loss - the levels of StopLoss and TakeProfit also affect the expected duration of the transaction, and the profitability of trading in general. If you have already determined the optimal transaction duration using the “ AIS-ODT ” script, then you can begin to determine the paramete
FREE
This script is designed so that the trader can determine the average duration of trade transactions, at which the ratio of possible profits and losses will be optimal. First, let's look at the general approach to determining the optimal duration of trade transactions. We introduce the following variables: R   - the result of the transaction; T   - the time during which the transaction was open; W  - the time between the closing of the previous transaction and the opening of the next one. Every t
FREE
This script allows selecting the TakeProfit and StopLoss levels. It analyzes the history data, and then calculates the probability of reaching a given price level. How the script works Suppose you have a trading strategy and you want to select the TakeProfit and StopLoss levels. Run the script and set the parameter: Number of Bars - the average position holding time in bars. Once the script operation is complete, the AIS-PPL.csv file will be created in the Files folder in the terminal data cata
FREE
AIS 올바른 평균 표시기를 사용하면 시장에서 추세 움직임의 시작을 설정할 수 있습니다. 지표의 또 다른 중요한 품질은 추세의 끝을 알리는 명확한 신호입니다. 표시기는 다시 그리거나 다시 계산되지 않습니다. 표시된 값 h_AE - AE 채널의 상한 l_AE - AE 채널의 하한 h_EC - 현재 막대에 대한 높은 예측 값 l_EC - 현재 막대에 대한 낮은 예측 값 표시기로 작업할 때의 신호 주 신호는 채널 AE와 EC의 교차점입니다. l_EC선이 h_AE선 위에 있을 때 상승세가 시작될 수 있습니다. 하락추세의 시작은 h_EC선이 l_AE선 아래로 떨어지면서 예상할 수 있습니다. 이 경우 h_AE와 l_AE 라인 사이의 채널 너비에 주의해야 합니다. 그들 사이의 차이가 클수록 추세는 더 강해질 것입니다. 또한 AE 채널에 의한 로컬 고/저 달성에 주의를 기울여야 합니다. 이때 가격변동의 경향이 가장 강해진다. 사용자 지정 가능한 지표 매개변수 표시기 설정은 시간
AIS 가중 이동 평균 표시기는 가중 이동 평균을 계산하고 추세 시장 움직임의 시작을 결정할 수 있도록 합니다. 가중치 계수는 각 막대의 특정 기능을 고려하여 계산됩니다. 이를 통해 임의의 시장 움직임을 필터링할 수 있습니다. 추세의 시작을 확인하는 주요 신호는 지표 라인의 방향과 지표 라인을 교차하는 가격의 변화입니다. WH(파란색 선)는 고가의 가중 평균입니다. WL(빨간색 선)은 저가의 가중 평균입니다. WS(녹색 선)는 모든 가격대의 가중 평균입니다. 옵션 LH - 값을 계산할 막대의 수입니다. LH를 빠르게 선택하려면 먼저 더 높은 시간 프레임의 배수인 값을 확인해야 합니다. 예를 들어 표시기는 M15로 설정됩니다. 그런 다음 LH의 다음 값을 확인합니다. M30/M15 = 2 H1/M15 = 4 H4/M15 = 16 D1/M15 = 96 W1/M15 = 480 그들 사이의 중간 값도 관심을 가질 수 있습니다.
AIS 고급 등급 타당성 지표는 가격이 미래에 도달할 수 있는 수준을 예측하도록 설계되었습니다. 그의 임무는 마지막 세 막대를 분석하고 이를 기반으로 예측을 작성하는 것입니다. 표시기는 모든 기간 및 모든 통화 쌍에서 사용할 수 있습니다. 설정의 도움으로 원하는 예측 품질을 얻을 수 있습니다. 예측 깊이 - 원하는 예측 깊이를 막대로 설정합니다. 이 매개변수는 18-31 내에서 선택하는 것이 좋습니다. 이 한계를 넘어설 수 있습니다. 그러나 이 경우 예측 수준의 "고정"(18보다 작은 값의 경우) 또는 과도한 수준의 폭(31보다 큰 값의 경우)이 가능합니다. 신뢰 수준 1, 신뢰 수준 2 및 신뢰 수준 3 - 예측 신뢰 수준. 1-99 범위 내에서 설정 가능합니다. 신뢰 수준 1은 신뢰 수준 2보다 커야 하고, 신뢰 수준 3은 가장 작아야 합니다. 이러한 각 수준은 예측 깊이 매개변수에 의해 결정된 막대 수에 대해 가격이 이 값에 도달할 확률의 백분율을 보여줍니다. Color
The indicator is designed to measure the price volatility. This allows determining the moments for opening or closing trade positions more accurately. High intensity of the market indicates the instability of its movement, but allows for better results. And, conversely, low intensity of the market indicates the stability of its movement. Parameters Bars to process - the number of bars to measure the price movements. A low value of this parameter allows determining the moments of rapid price mov
This indicator uses the Fibonacci p-numbers to smooth a price series. This allows combining the advantages of the simple and exponential moving averages. The smoothing coefficients depend on the level of the p-number, which is set in the indicator parameters. The higher the level, the greater the influence of the simple moving average and the less significant the exponential moving average. Parameters Fibonacci Numbers Order - order of the Fibonacci p-number, specified by trader. Valid values a
MinDeposit
Aleksej Poljakov
5 (1)
The script analyzes the history of quotes and gives recommendations on the minimum deposit. The calculations take into account the variability of prices and the standard deviation. Margin requirements for the instrument are also taken into account. The result of the script is the minimum recommended deposit for trading the given currency pair.
FREE
The indicator is based on the analysis of interaction of two filters. The first filter is the popular Moving Average. It helps to identify linear price movements and to smooth minor price fluctuations. The second filter is the Sliding Median. It is a non-linear filter. It allows to filter out noise and single spikes in the price movement. A predictive filter implemented in this indicator is based on the difference between these filters. The indicator is trained during operation and is therefore
This indicator studies the price action as a combination of micro-trends. All micro-trends are analyzed and averaged. Price movement is filtered based on this averaging. IP_High and IP_Low (blue and red dashed lines) show the instantaneous price movement. They display the forecast only for the current price values, taking into account only the number of bars defined by the 'Filter level' parameter. SP_High and SP_Low (blue and red solid lines) smooth the price movements with respect to history.
The script allows selecting the required 'Filter level' value of the AIS-MTF indicator. Run the script on the required chart and selected timeframe. Once its operation is complete, the HPS.csv file will be created in the Files folder. Open the file. You will see three columns. The 'Filter lvl' column represents the value of the 'Filter level' for the AIS-MTF indicator. Am. dev. - degree and direction of the indicator's deviation from the price level (sorted in ascending order). Negative values i
FREE
이 표시기는 간단한 선형 평활화 프로세스를 구현합니다. 지수 평활화의 단점 중 하나는 신호의 급격한 감쇠입니다. 이것은 가격대의 장기적인 추세를 완전히 추적하는 것을 불가능하게 만듭니다. 선형 평활화를 사용하면 신호 필터링을 보다 정확하고 미세하게 조정할 수 있습니다. 표시기는 매개변수를 선택하여 구성됩니다. LP - 이 매개변수를 사용하여 평활 기간을 선택할 수 있습니다. 값이 클수록 표시기는 더 장기적인 추세를 표시합니다. 유효한 값은 0 - 255입니다. SP -이 매개 변수는 표시기의 감도에 영향을 미칩니다. 이 매개 변수가 클수록 가격 시리즈의 마지막 값의 영향이 커집니다. 이 매개변수의 값이 0이면 표시기는 LP+1과 같은 기간으로 단순 이동 평균을 표시합니다. 유효한 값은 0 - 255입니다.
Этот индикатор представляет гибридный фильтр основанный на совместном использовании медианы и скользящей средней. Использование медианы позволяет отфильтровывать аномальные выбросы и случайные импульсы в значениях ценового ряда. При этом на трендовую составляющую медианный фильтр не действует, оставляя ее без изменений. Так как медианный фильтр является нелинейным, то для сглаживания его значений используется скользящая средняя. Такой подход позволяет более точно выделять не только тренд, но и п
This indicator is a combination of two modified Lanczos filters. The first filter serves to extrapolate the price. Based on past values, he predicts a possible price movement within the current bar. That is, it shows what the price would be if the past trends remained unchanged. The second filter for smoothing and averaging prices within the window, determined by the level of the filter. Thanks to the selection of weights, this filter is most actively responding to the periodic component that is
The script is based on the simulation of trade transactions using a random number generator. This allows you to get completely different results, even with the same input parameters. When you run the script, a dialog box opens in which you can set the desired values ​​for external variables. In the Trading options block, the basic parameters that are necessary for trading modeling are defined. Start Balance - sets the initial size of the trade balance. Number Trade - sets the number of trade tr
FREE
This script is designed so that the trader can determine the average duration of trade transactions, at which the ratio of possible profits and losses will be optimal. First, let's look at the general approach to determining the optimal duration of trade transactions. We introduce the following variables: R   - the result of the transaction; T   - the time during which the transaction was open; W - the time between the closing of the previous transaction and the opening of the next one. Every tr
FREE
Let's look at the nature of price changes in the Forex market, not paying attention to the reasons why these changes occur. This approach will allow us to identify the main factors affecting the price movement. For example, let's take the opening prices of bars on the EUR-USD currency pair and the H1 timeframe. For these prices, we construct the Lameray diagram (Figure 1). In this diagram, it can be seen that the price movement basically occurs according to a linear equation. To determine the pa
This indicator is more informative. His work is based on the assumption that the price movement in the market can be represented as noise of a particular color, which depends on the parameters of the distribution of price values. Thanks to this, it is possible to analyze the price change from different angles, and considering the price movement as noise of a particular color, one can get information about the current state of affairs in the market and make a forecast about the price behavior. W
Despite some drawbacks of the “ AIS Color Noise Filter ” indicator, the idea to use it to smooth the price series and forecast prices looks quite attractive. This is due to several reasons: first, taking into account several noise components allows building a forecast on factors independent of each other, which can improve the quality of forecasting; secondly, the noise characteristics of the price series behave quite stably throughout the entire history, which makes it possible to obtain stabl
Very often, in the study of financial series apply their smoothing. Using smoothing, you can remove high-frequency components - it is believed that they are caused by random factors and therefore irrelevant. Smoothing always includes some way of averaging the data, in which random changes in the time series mutually absorb each other. Most often, for this purpose, simple or weighted moving average methods are used, as well as exponential smoothing. Each of these methods has its advantages and d
In order to isolate long-term and non-random components, it is necessary to know not only how much the price has changed, but also how these changes occurred. In other words - we are interested not only in the values ​​of price levels, but also in the order in which these levels replace each other. Through this approach, one can find long-term and stable factors that influence (or may influence) the price change at a given point in time. And knowledge of these factors allows you to make a more
One of the powerful methods of analysis is the modeling of financial series using Levy processes. The main advantage of these processes is that they can be used to model a huge number of phenomena - from the simplest to the most complex. Suffice it to say that the idea of ​​the fractal price movement in the market is only a special case of Levy processes. On the other hand, with proper selection of parameters, any Levy process can be represented as a simple moving average. Figure 1 shows an exa
AIS Channel Price
Aleksej Poljakov
Very often, the trader is faced with the task of determining the extent to which the price may change in the near future. For this purpose, you can use the Johnson distribution type SB. The main advantage of this distribution is that it can be used even with a small amount of accumulated data. The empirical approach used in determining the parameters of this distribution, allows you to accurately determine the maximum and minimum levels of the price channel. These values ​​can be used in differ
This indicator allows you to determine the likelihood that the price will reach one or another level. Its algorithm is quite simple and is based on the use of statistical data on the price levels of a particular currency pair. Thanks to the collected historical data, it is possible to determine the extent to which the price will change during the current bar. Despite its simplicity, this indicator can provide invaluable assistance in trading. So, with its help it is possible to determine TakePr
Stable distributions can be used to smooth financial series. Since a fairly deep history can be used to calculate the distribution parameters, such smoothing may in some cases be even more effective than other methods. The figure shows an example of the distribution of the opening prices of the currency pair " EUR-USD " on the time frame H1 for ten years (figure 1). Looks fascinating, doesn't it? The main idea behind this indicator is to determine the parameters of a stable distribution based
When making trading decisions, it is useful to rely not only on historical data, but also on the current market situation. In order to make it more convenient to monitor current trends in market movement, you can use the AIS Current Price Filter  indicator. This indicator takes into account only the most significant price changes in one direction or another. Thanks to this, it is possible to predict short-term trends in the near future - no matter how the current market situation develops, soon
The Cauchy distribution is a classic example of a fat-tailed distribution. Thick tails indicate that the probability of a random variable deviating from the central trend is very high. So, for a normal distribution, the deviation of a random variable from its mathematical expectation by 3 or more standard deviations is extremely rare (the 3 sigma rule), and for the Cauchy distribution, deviations from the center can be arbitrarily large. This property can be used to simulate price changes in th
필터:
리뷰 없음
리뷰 답변